


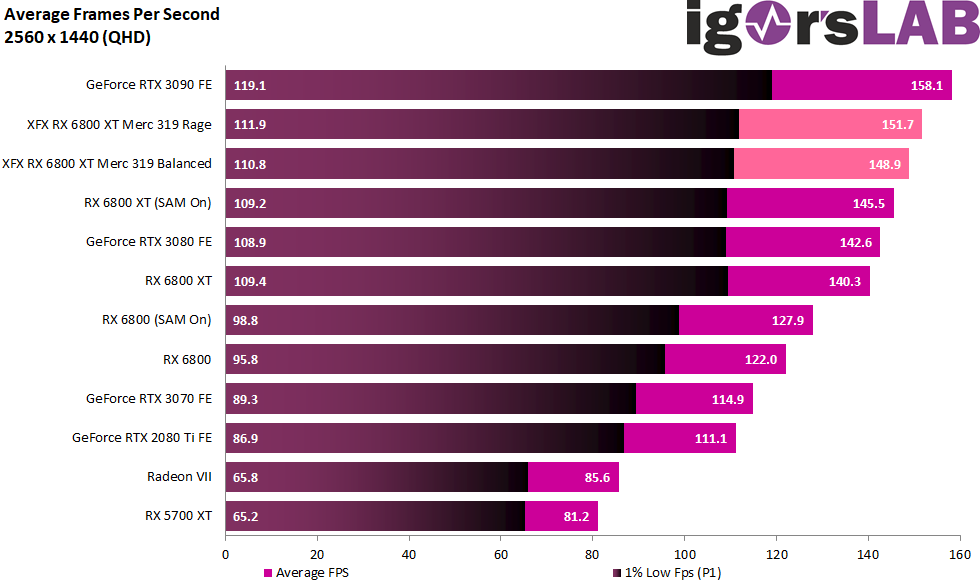
Gaming performance in QHD – 2560 x 1440 pixels
The card performs about 4 FPS more on normalized average with Silent BIOS 2 than AMD’s RX 6800 XT with SAM. By the way, the board partner card was tested exclusively with SAM activated, since the effort for both measurements (i.e. additionally those on an Intel system) would have been too high. However, the increases are very similar, so that you can also orientate yourself on the entry of the AMD card without SAM as a basis. The GeForce RTX 3080 FE is beaten even more clearly here and if you switch to the Rage mode in the driver, then the gap to the GeForce RX 3090 FE is even smaller than the already quite large lead over the RX 3080 FE!
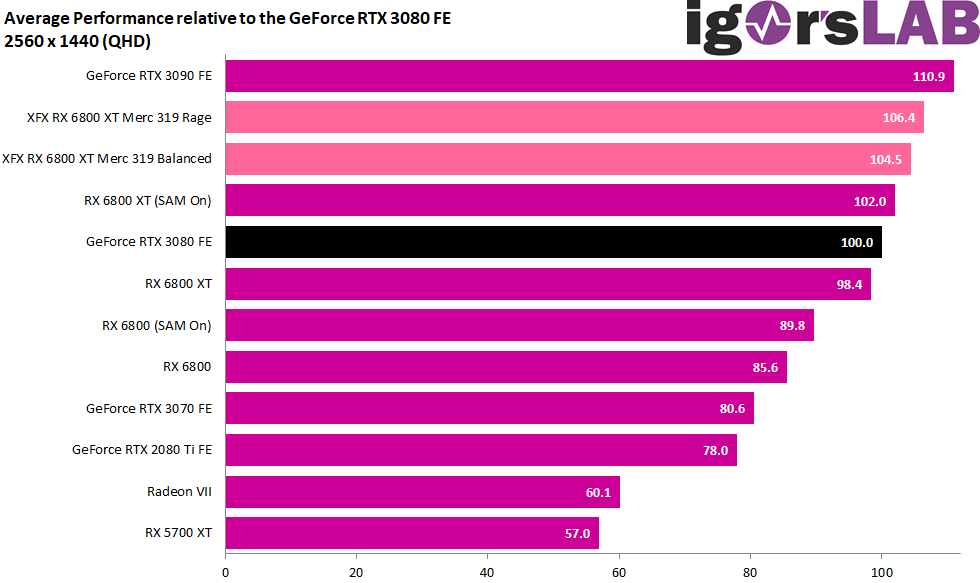
Expressed in percentages, the whole thing looks like this: the card is a good 4 percentage points ahead of the GeForce RTX 3080 FE in balanced mode and a good 6 percentage points ahead in rage mode, but the RTX 3090’s lead then shrinks to a good 4 percent.
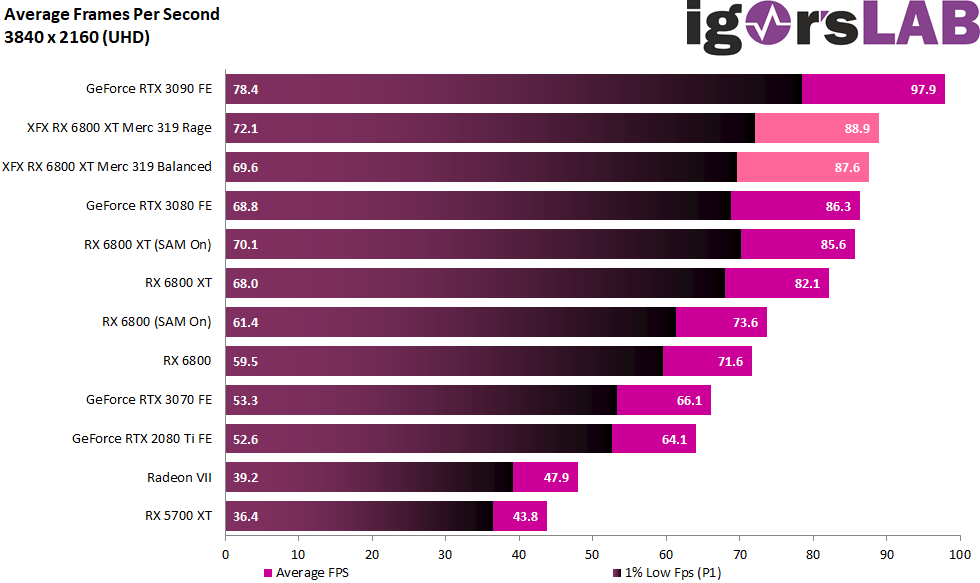
Gaming performance in UHD – 3840 x 2160 pixels
The GeForce RTX 3080 FE can narrowly hold its own against the AMD reference card with SAM in the sum of all games, but it doesn’t really stand a chance against The Board Partner card. The gap to the GeForce RTX 3090 alone grows significantly for all graphics cards.
It even increases to almost 12 percentage points compared to the board partner card in balanced mode. However, its advantage over the GeForce RTX 3080 FR shrinks to 3 percentage points in Rage mode and even only 1.5 percentage points in Balanced mode. Overall, all RX-6800-XT passes move much closer together.
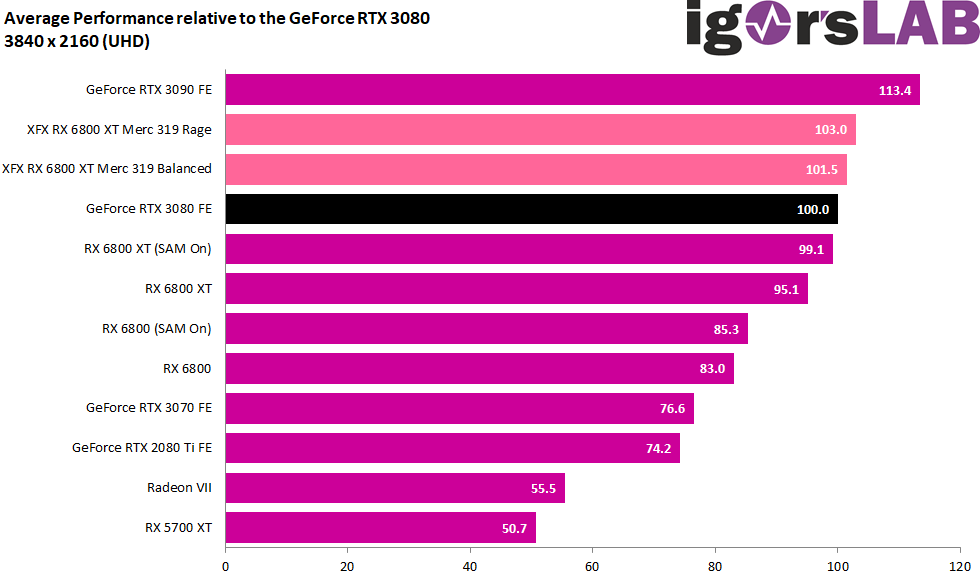
But you can read on the next page how much more power consumption this new advantage is linked to in total.
- 1 - Introduction and Technical Details
- 2 - Teardown: PCB and Cooler
- 3 - Gaming Performance
- 4 - Power Consumtion in Gaming and Efficiency
- 5 - Power Consumption in Detail, Voltages and Standards
- 6 - Transients and PSU Recommendation
- 7 - Clock Rate and Temperatures
- 8 - Fan Speed and Noise
- 9 - Summary and Conclusion


Kommentieren