


Measurement setup in general
Basically, there is not much to say. I use NVIDIA LDAT to measure the response times. This is placed in the center of the display. Just like I measure color fidelity with the SpyderX, for example.
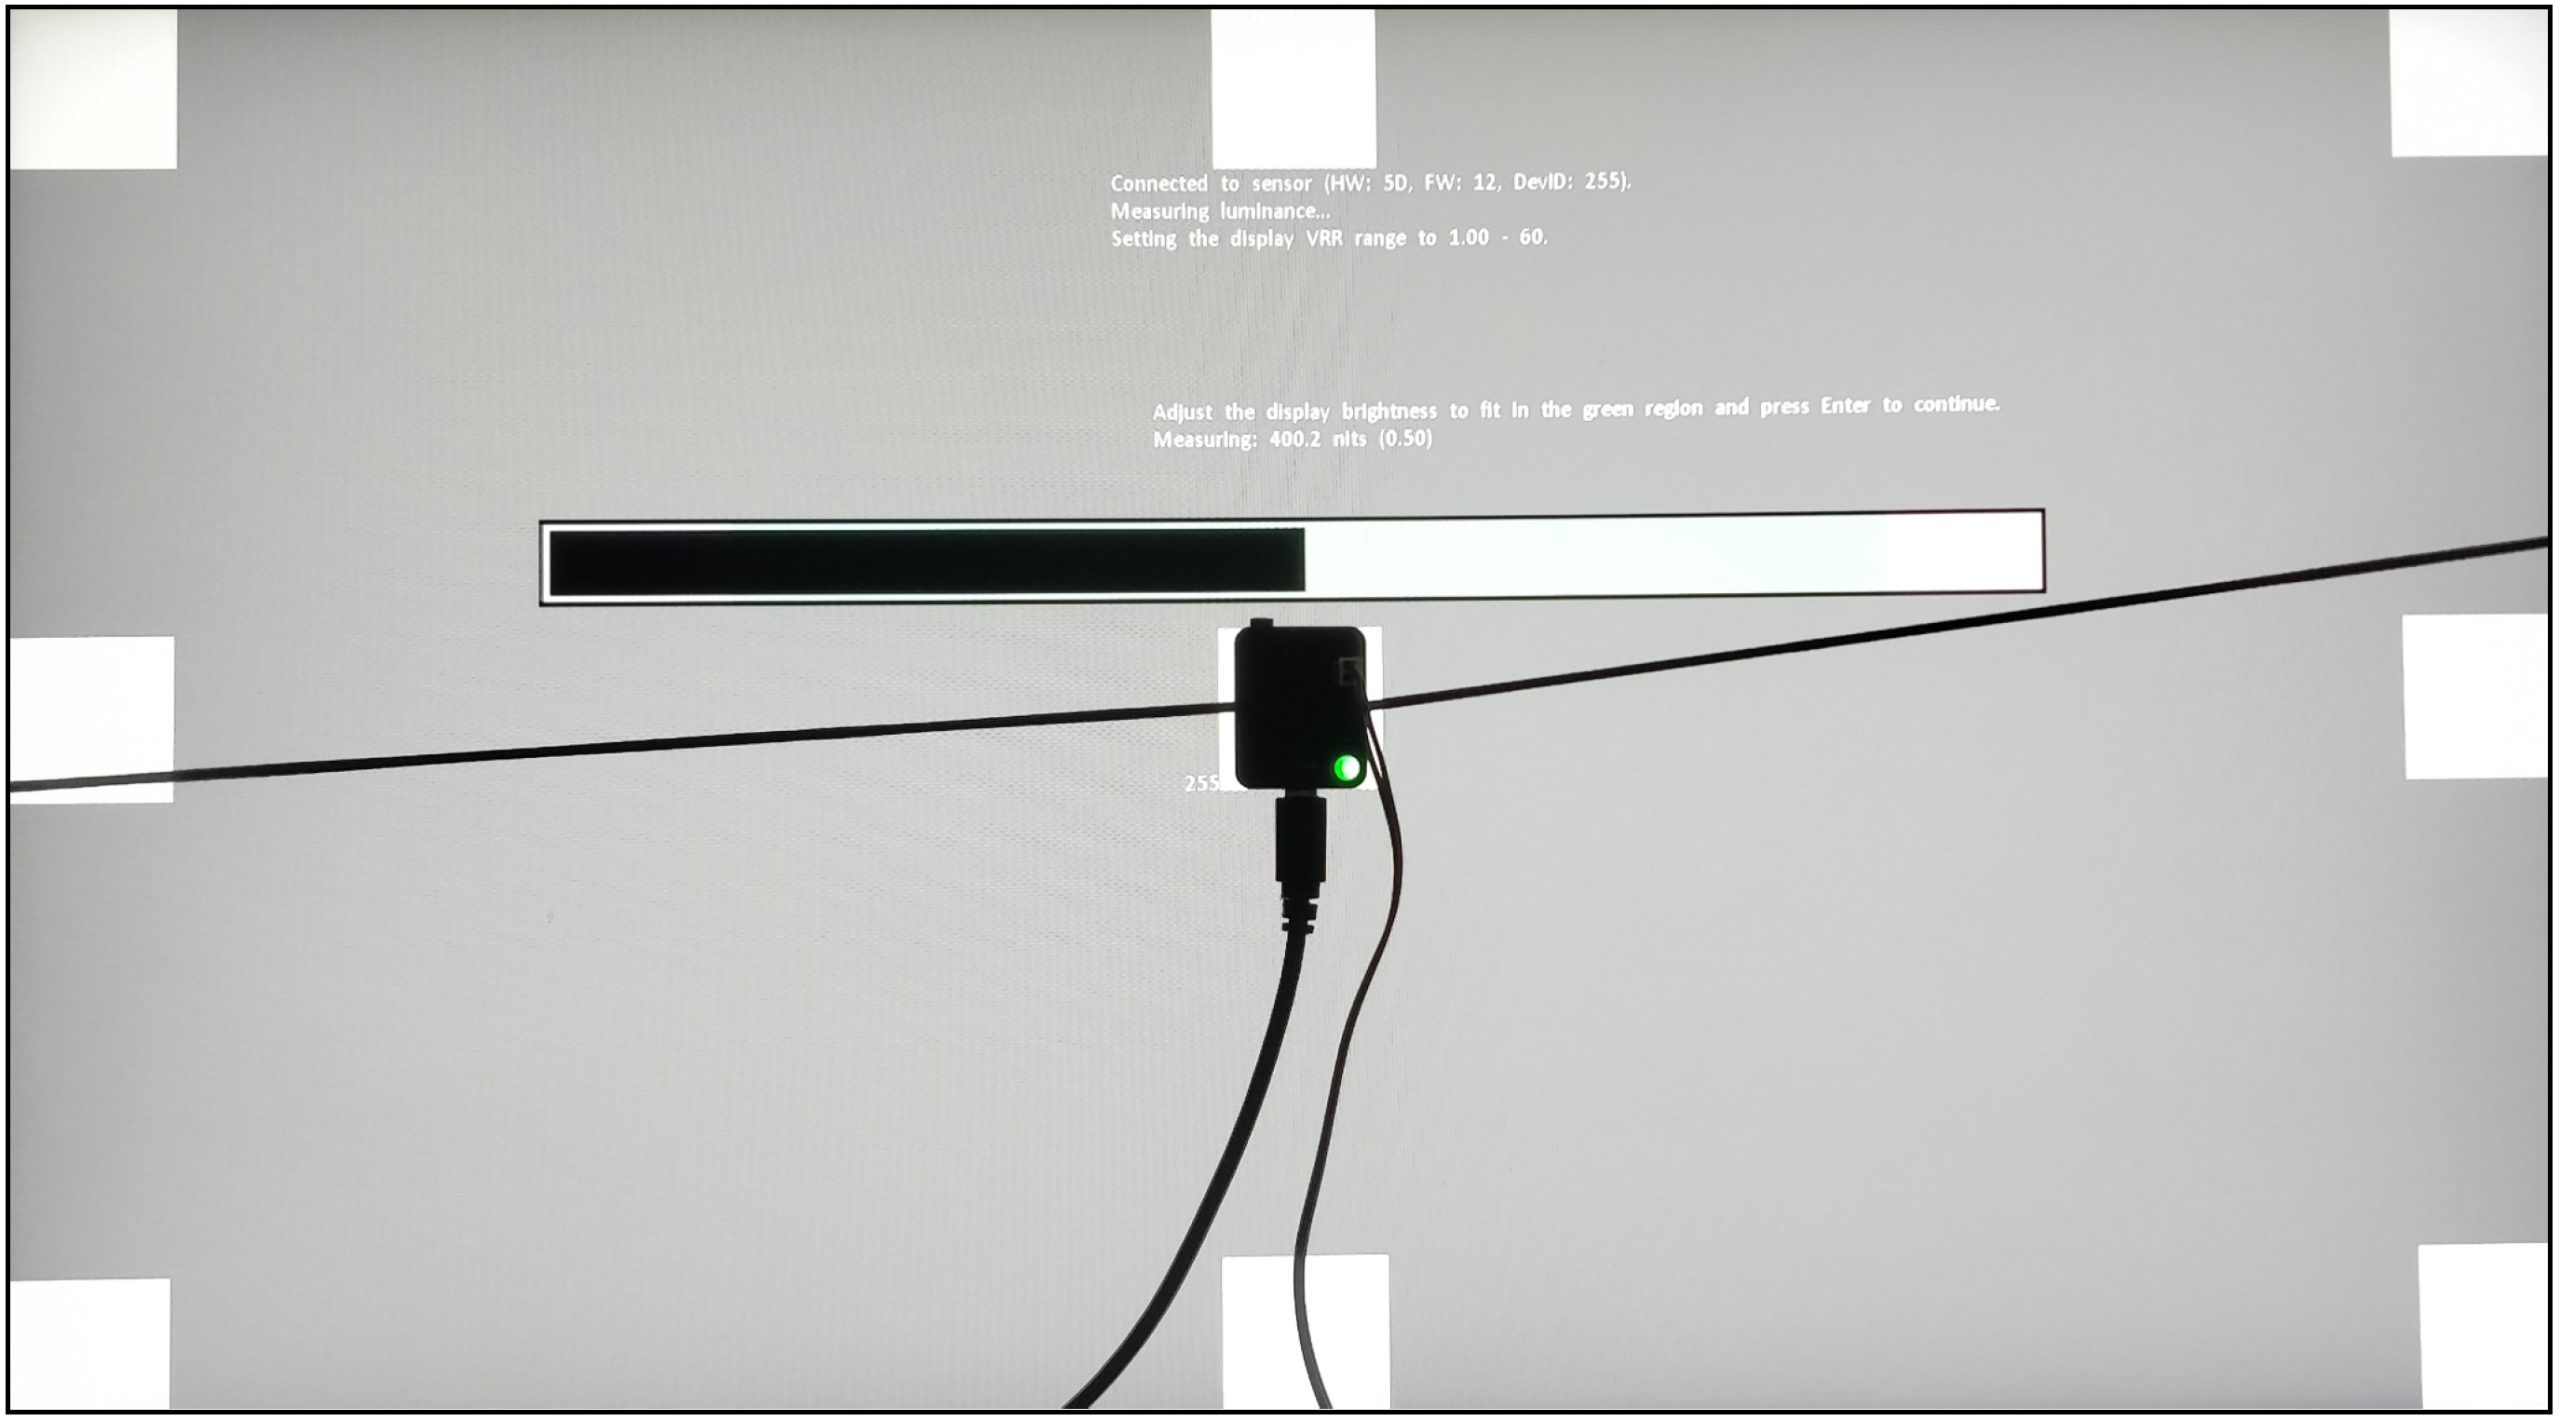
I let the monitor warm up for an hour at 200 nits beforehand. As with calibration, the panel should warm up first. Then you avoid different measured values. My current test setup looks like this:
| CPU | Intel Core i9-12900K |
| Mainboard | MSI MPG Z690 Carbon WiFi |
| RAM | 2x 16 GB Corsair Dominator 6000 MHz CL 30-36-36-76 |
| SSD 1 | Samsung 980 Pro 500 GB (System) |
| SSD 2 | MSI M480 2 TB (games) |
| SSD 3 | HP EX950 2 TB (games) |
| SSD 4 | HP SDD S750 1 TB S-ATA (backup) |
| CPU cooler | Alphacool Eisbaer Aurora 360 |
| Power supply | Seasonic Prime Platinum 1300 Watt |
| GPUs |
NVIDIA GeForce RTX 4090 FE (Driver 560.70) MSI AMD Radeon RX 6700 XT Gaming X (Driver 24.7.1) |
| Sound | SoundblasterX AE-5 Plus |
| Keyboard | Sharkoon Purewriter RGB (Red Button) via USB @1000 Hz polling rate |
| Mouse | Sharkoon Light² 200 @1000 Hz polling rate |
| Monitor |
Titan Army P2510S (IPS panel: 2560 x 1440p @ 240 Hz) |
| Test tools / software |
Tools Software |
If anything changes here, I will of course update this. The fact is that the PC hardware is basically irrelevant. I connected three different computers to the monitor and the results were always the same. The monitor itself should be NVIDIA G-Sync compatible. However, this is not a must for the GtG measurements! I always measure the response times after calibration. This creates the same conditions for all monitors.
Measurement method (GtG)
With the gray to gray (GtG) measurement, different gray levels are measured. But also from black = 0 to 255 = white. This results in 36 response times in the rise-up (black to white) and 36 in the rise-down (white to black) – making a total of 72 measurements. LDAT measures the time in ms that is required from the start color to the target color.
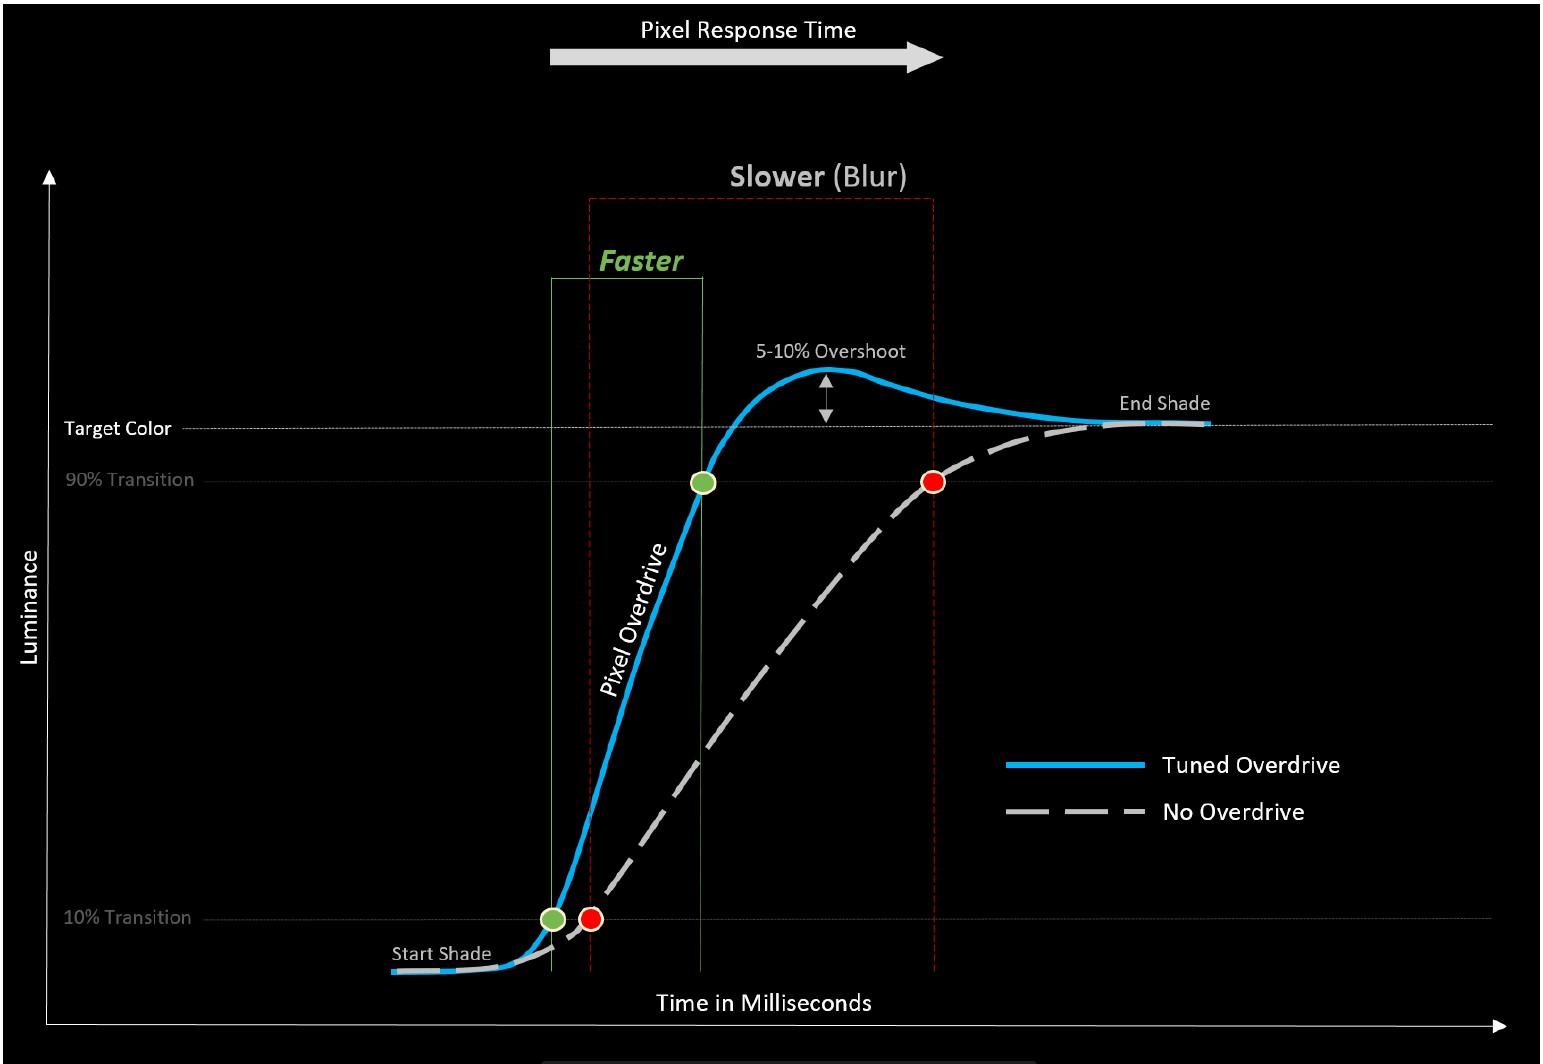
The current international standard for the response time is the 80 % transition. This means: In order to avoid measurement inaccuracies with regard to signal noise, LDAT also only measures the response time after 10 % of the start-transition curve and 10 % before the actual end. The overshoot is considered separately. See also the picture above.
Furthermore, it is currently not technically possible for me to make UFO recordings. I simply don’t have the necessary equipment. Unfortunately, I don’t have an adjustable high-speed camera (0 to 1000 FPS).
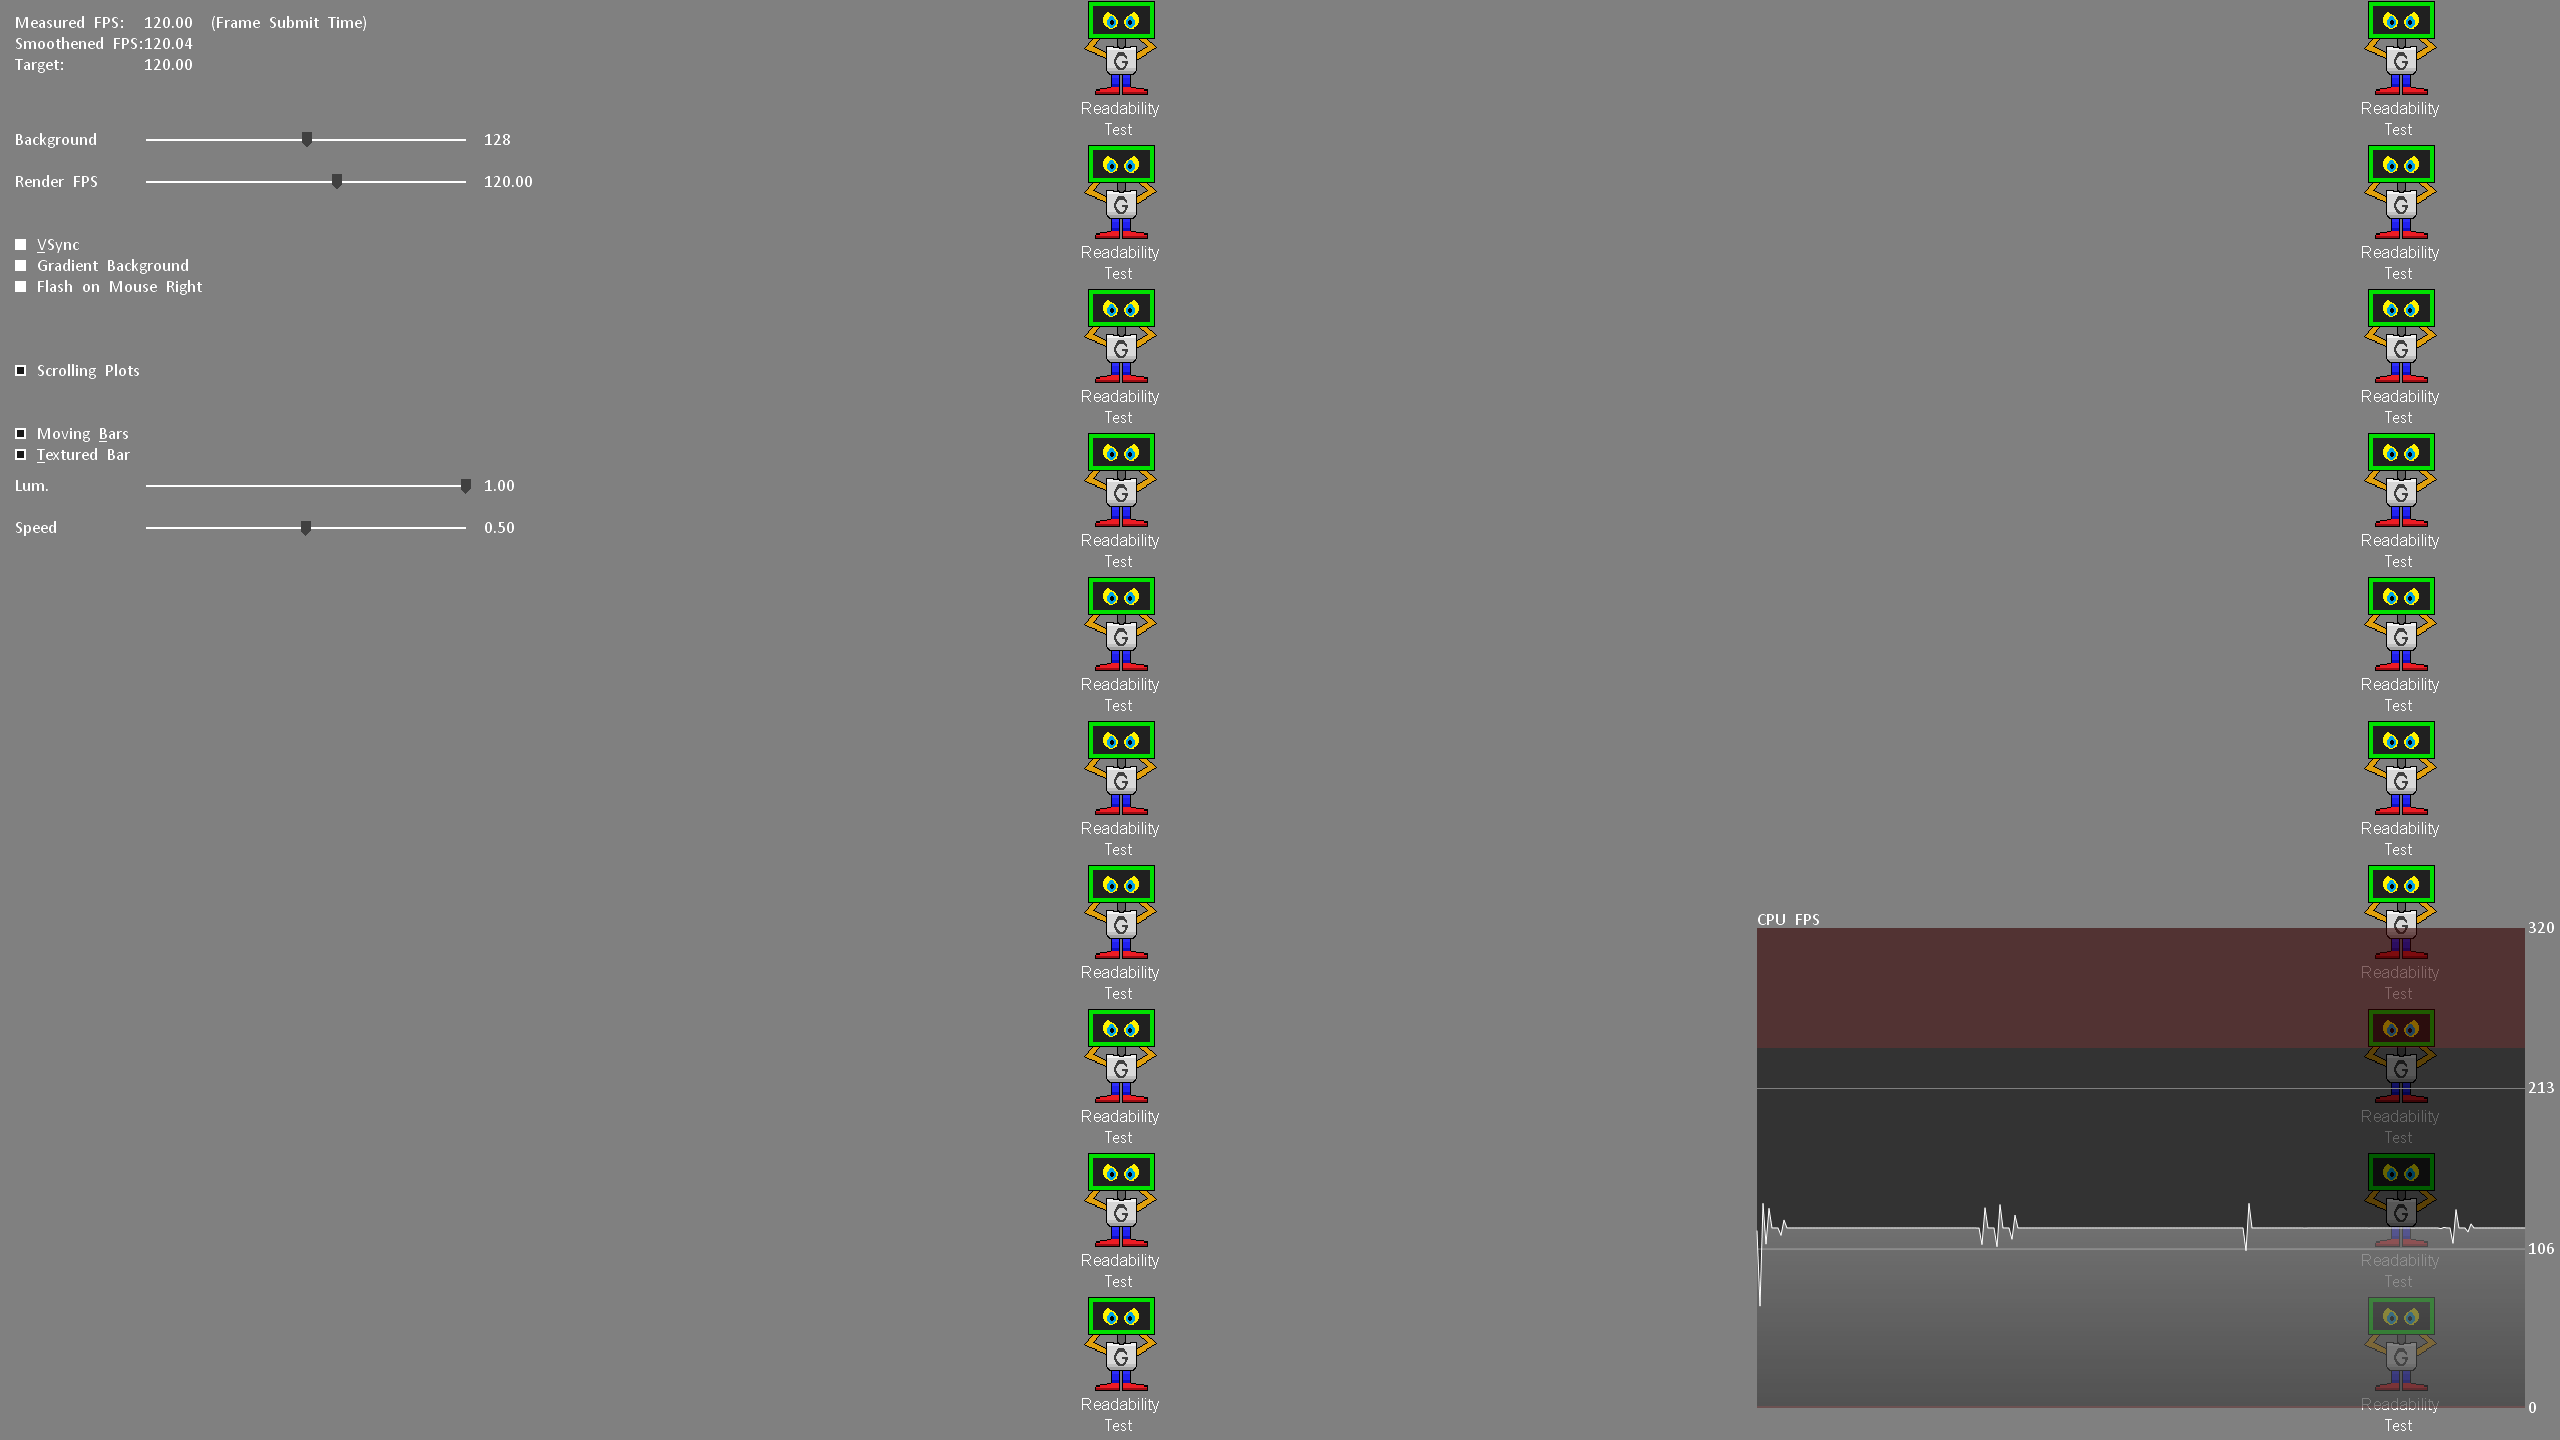
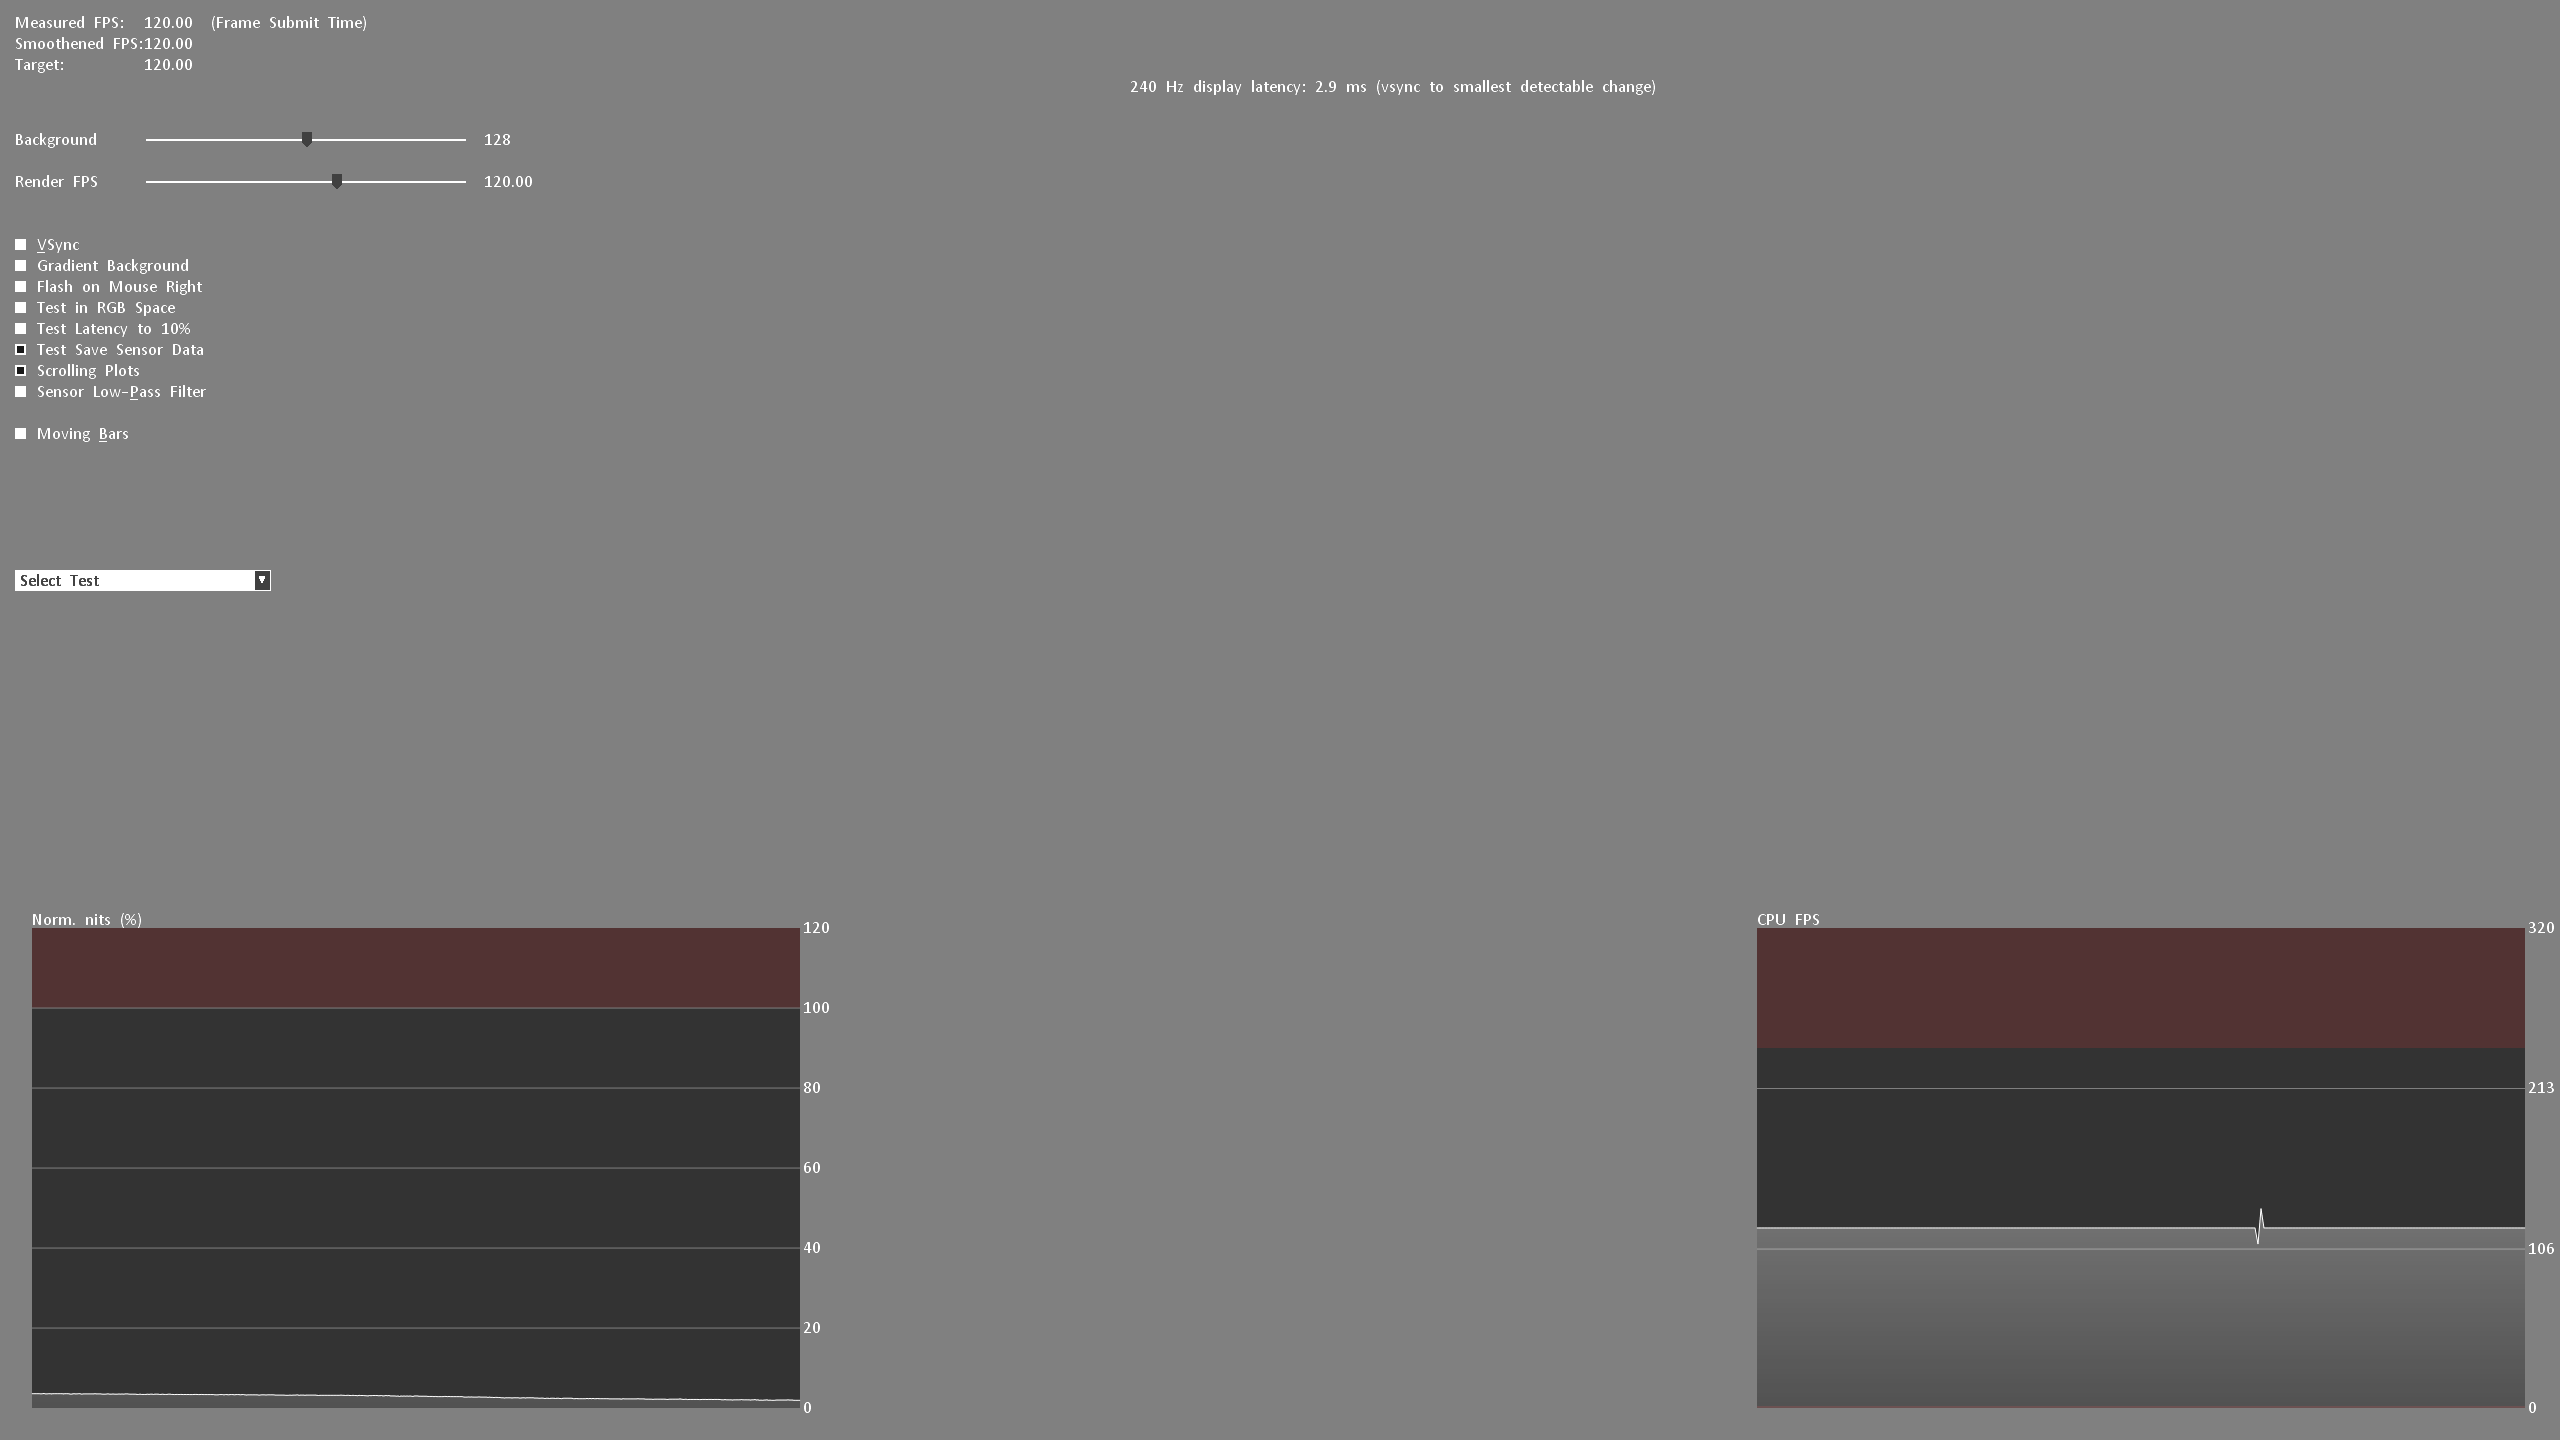
Nevertheless, I look at the motion clarity on the one hand with UFO (click here) and on the other hand with the NVIDIA LDAT software. (see picture above)
Display lag, monitor input lag and E2E latency
The display lag is the sum of the processing lag and half the scan-out (the image build-up to the middle of the screen = refresh lag). Measured via LDAT, for this – and I emphasize – only for the display lag, G-Sync compatibility is mandatory. This basically means FreeSync via DisplayPort. G-Sync must be activated in the NVIDIA driver.
For the actual input lag, I add the average pixel response time (playable overdrive). Example: 3.6 ms display lag 2.6 ms response time = 6.2 ms input lag

Finally, I measure the E2E latency. In other words: from the mouse click to half the pixel response time. Yes, only half the transition is measured here.
Attention:
All latency measurements are performed at the maximum refresh rate and the same FPS. Example: 240 Hz with 240 FPS
Measuring the color performance
I have already explained how I measure color performance in the basic article on Calman Ultimate from Portrait Displays.

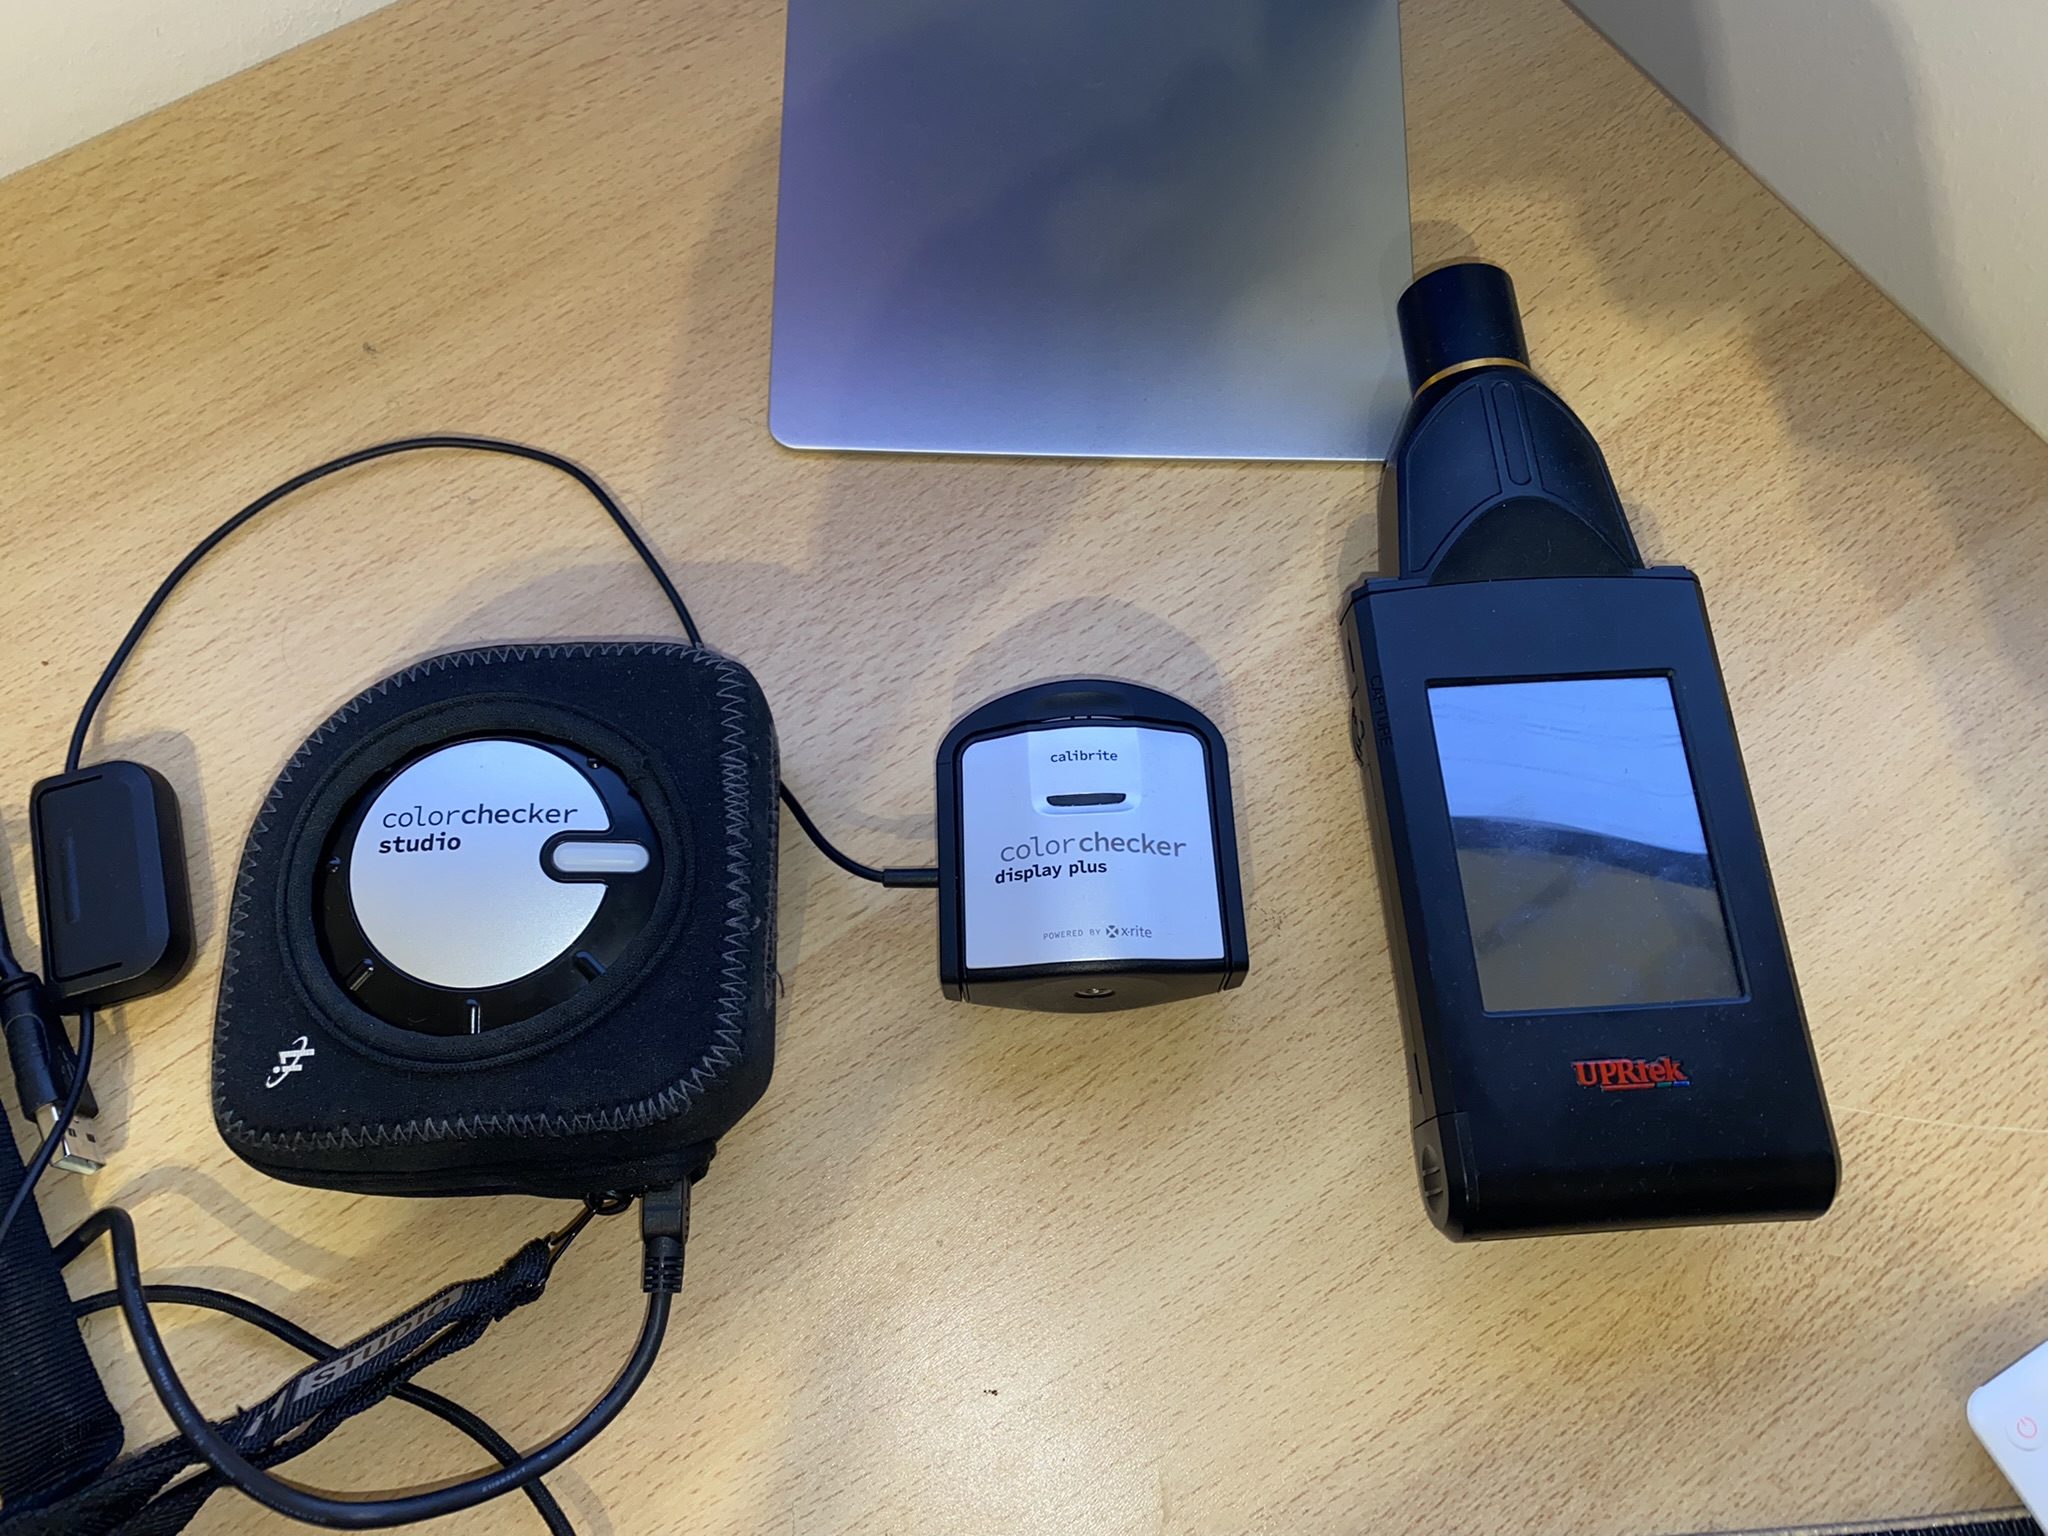
To be able to offer you the best possible color accuracy measurements, I always use the UPRtek MK550T Spectroradiometer.
MK550T_Handheld_Spectroradiometer_10_Specification_EN
On the one hand, the respective monitor is “profiled” in conjunction with Calman Ultimate so that I can also measure accurately with the Calibrite ColorChecker Display Plus Colorimeter. Secondly, each calibration is validated with the UPRtek MK550T. Furthermore, I also carry out various measurements with the UPRtek uSpectrum software – for example, the spectral analysis of each display in relation to the balu light component – the subject of eye-safe.
Here again to read:
I used the Calman Ultimate color calibration software from Portrait Displays for all measurements and calibrations. With my measurements, I can offer you certainty as to whether a monitor complies with the manufacturer’s specifications – or not.
Hint
If you look at other tests on monitors from other testers, there may be differences – especially in the response times. You must therefore always check how other colleagues measure such things. This does not mean that my or other measurements are wrong. The differences arise due to different test methodologies and different hardware. The decisive factor is that all monitors are tested using the same measurement system/methodology. Then the values can be compared with each other. Please do not compare my measurement system one-to-one with others.
All measurements (latencies, response times, color performance, etc.) are repeated 3 times and must be subject to my defined accuracy.
Measurement repeatability:
| Average Response Time | /- 0.5 ms |
| Average Latency | /- 1 ms |
| Average delta E 2000 | /- 0,5 |
| Brightness | /- 10 Nits |
The best result will be published. This ensures plausibility and fairness in the end! Continue on the next page.

- 1 - Introduction, Features and Specs
- 2 - Workmanship and Details
- 3 - How we measure: Equipment and Methods
- 4 - Pixel Response Times
- 5 - Display Latencies
- 6 - Color-Performance @ Default Settings
- 7 - Direct Comparison and Power Consumption
- 8 - Color-Performance calibrated
- 9 - HDR-Performance
- 10 - Summary and Conclusion


1 Antwort
Kommentar
Lade neue Kommentare
Mitglied
Alle Kommentare lesen unter igor´sLAB Community →