


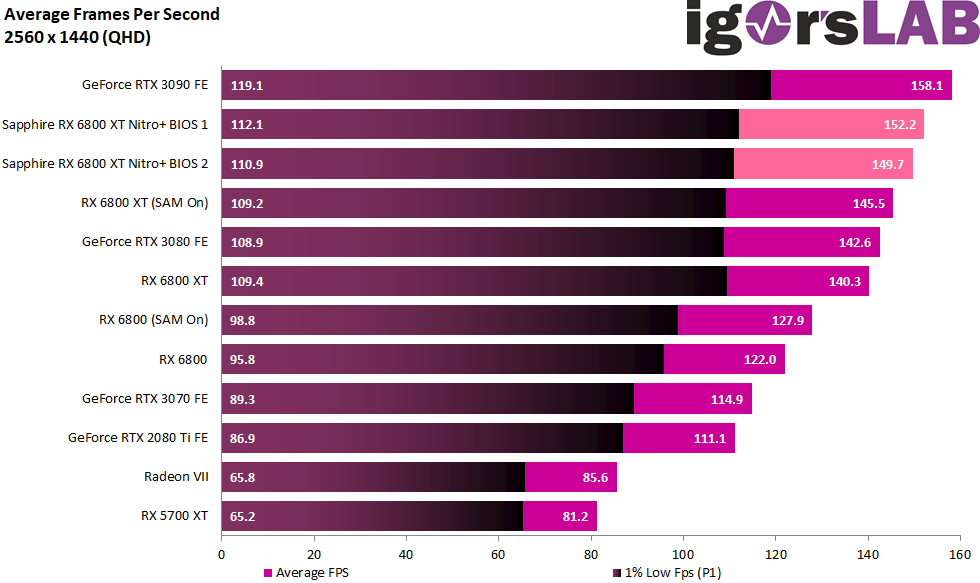
Gaming performance in QHD – 2560 x 1440 pixels
The card performs with the Silent BIOS 2 in the normalized average about 4 FPS more than the RX 6800 XT from AMD with SAM. Incidentally, the board partner card was tested exclusively with activated SAM, as the effort for both measurements (i.e. additionally those on an Intel system) would have been too high. The increases turn out to be very similar, so that one can also orientate oneself by the entry of the AMD card without SAM as a basis. The GeForce RTX 3080 FE is beaten here even more clearly and if one switches to BIOS 1, which is activated by default, then the distance to the GeForce RX 3090 FE is even smaller than the already quite large lead over the RX 3080 FE!
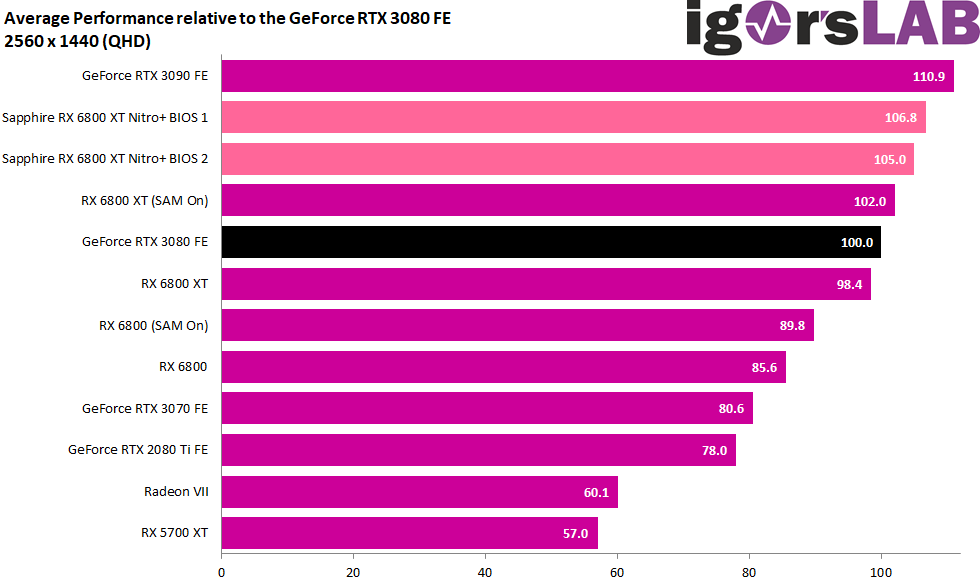
Expressed in percent, the whole thing then looks like that the card with BIOS 1 is almost 7 percent ahead of the GeForce RTX 3080 FE, but the lead of the RTX 3090 shrinks to a good 4 percent.
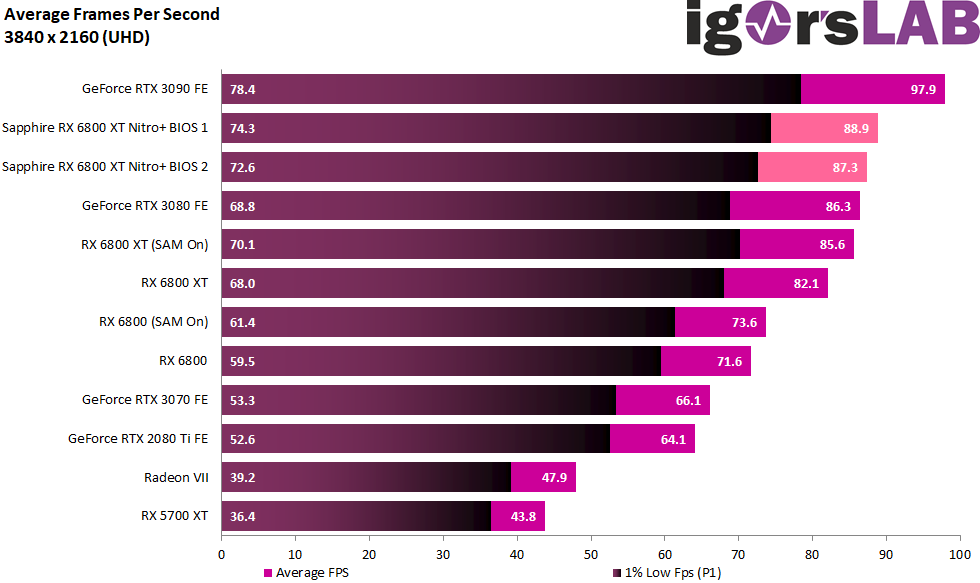
Gaming performance in UHD – 3840 x 2160 pixels
The GeForce RTX 3080 FE can just about hold its own against the AMD reference card with SAM in the sum of all games, but doesn’t have a real chance against the board partner card. Alone the gap to the GeForce RTX 3090 increases significantly for all graphic cards.
It even increases to almost 10 percent compared to the board partner card including BIOS 1. However, their advantage over the GeForce RTX 3080 FR shrinks to 3 percent (BIOS 1) and even 1 percent in BIOS 2. Overall, all RX-6800-XT runs are much closer together.
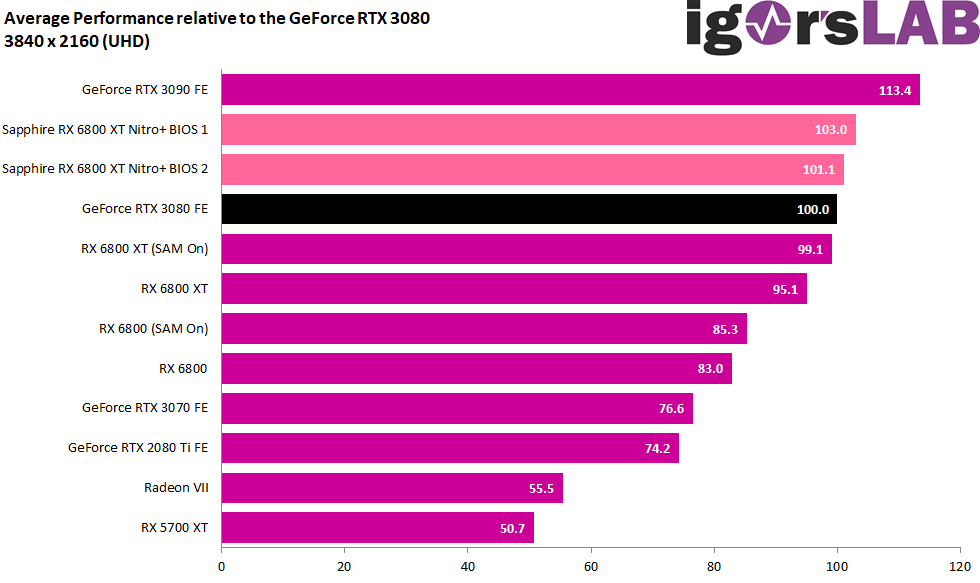
But you can read on the next page how much more power consumption this new lead is associated with overall.
- 1 - Einführung und technische Details
- 2 - Teardown: Platine, Spannunsversorgung, Kühler
- 3 - Gaming Performance
- 4 - Leistungsaufnahme beim Gaming und Effizienzanalyse
- 5 - Leistungsaufnahme, Spannungen und Normeinhaltung
- 6 - Lastspitzen und Netzteil-Empfehlung
- 7 - Taktraten und Temperaturen
- 8 - Lüfter und Geräuschemission ('Lautsärke')
- 9 - Übersicht, Zusammenfassung und Fazit


Kommentieren