


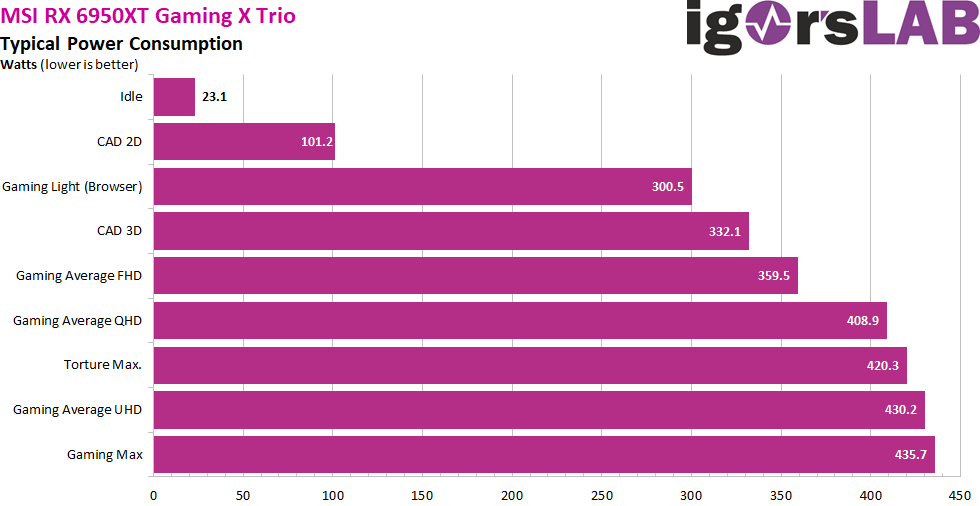
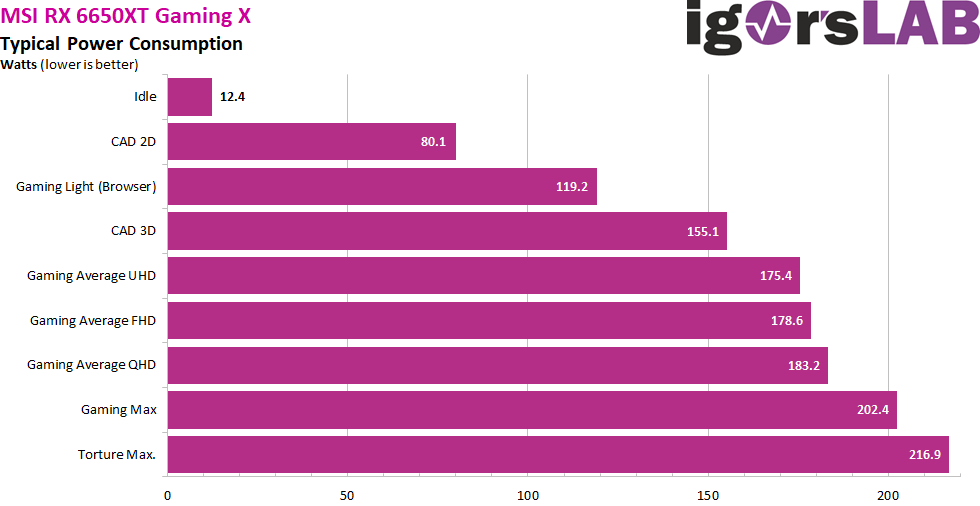
Power consumption of all three cards as overview of different loads
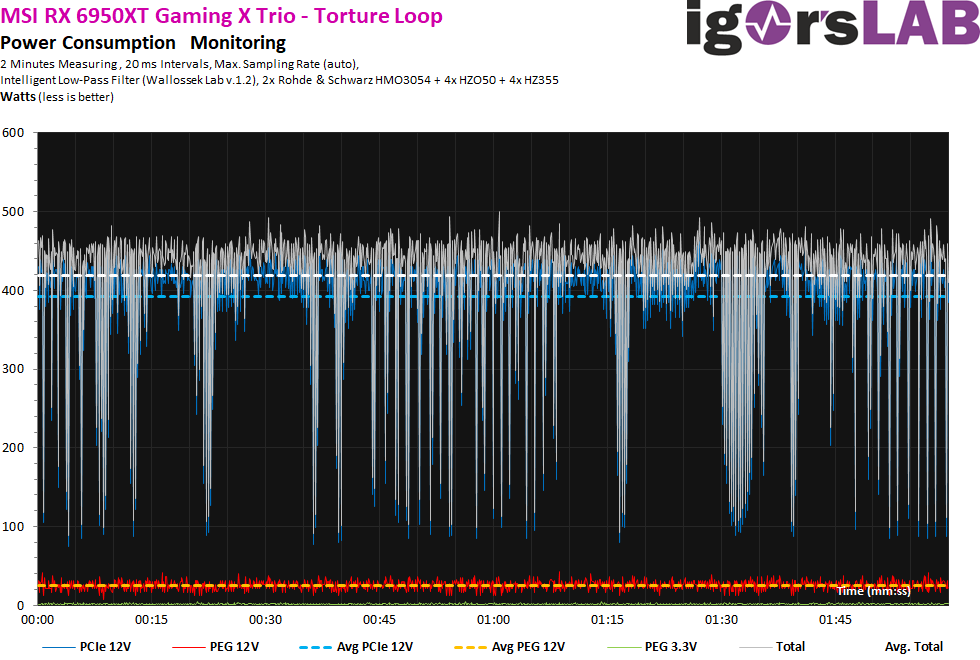
The maximum values of a very demanding scene are not the whole truth, because the power consumption has many other facets. First of all, here is the overview of the three new cards, although it is already known from the previous page how much higher the value for the refresh cards unfortunately turns out to be.

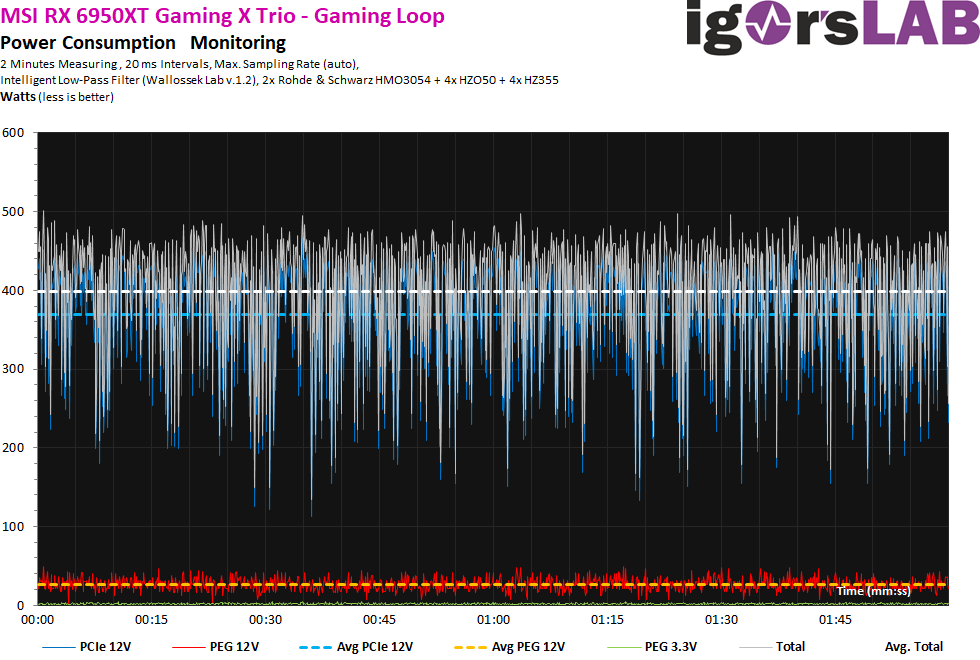
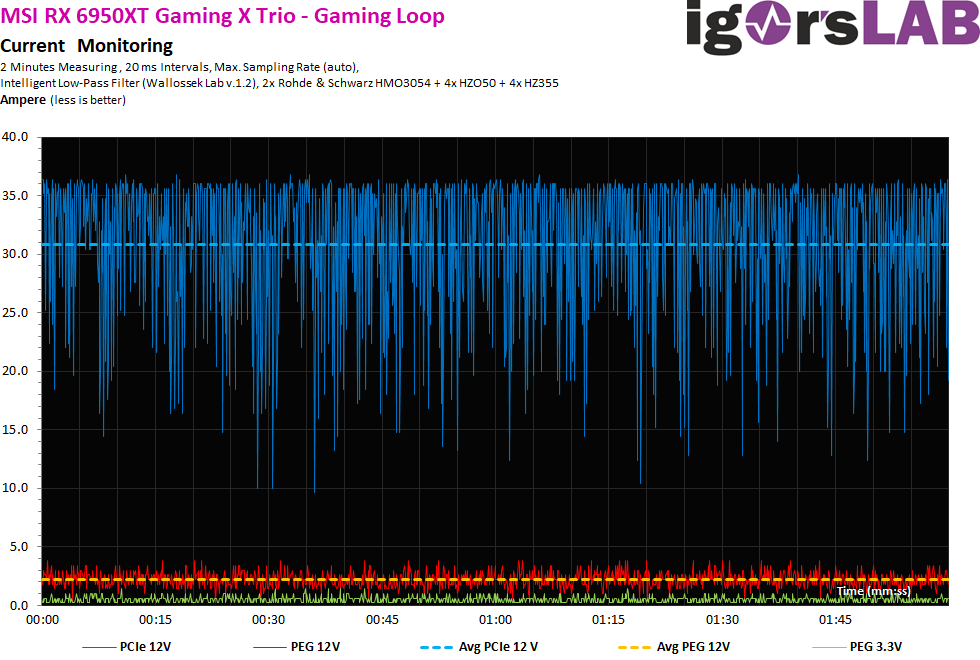
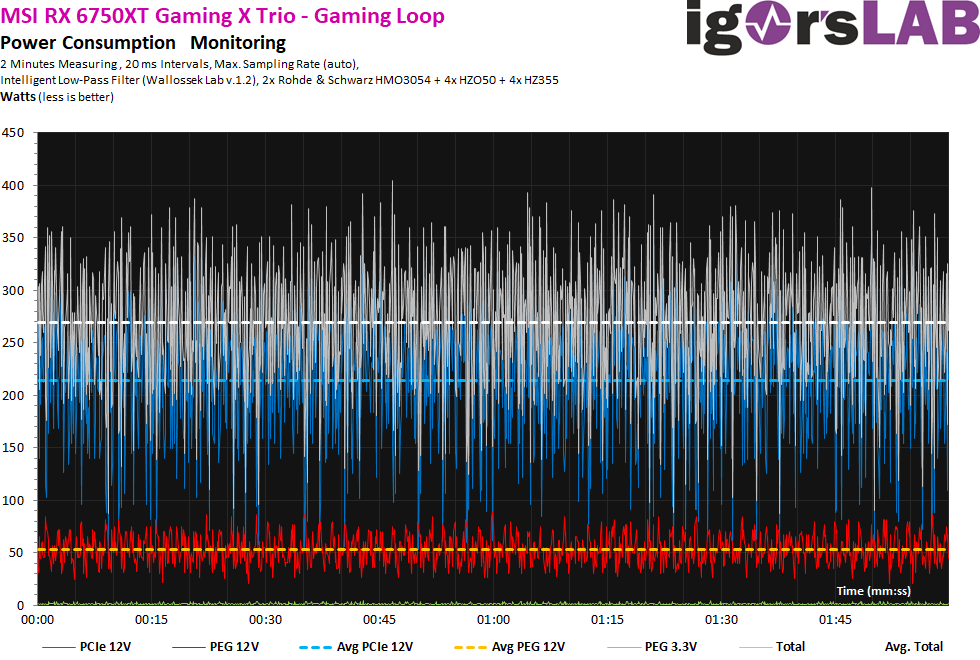
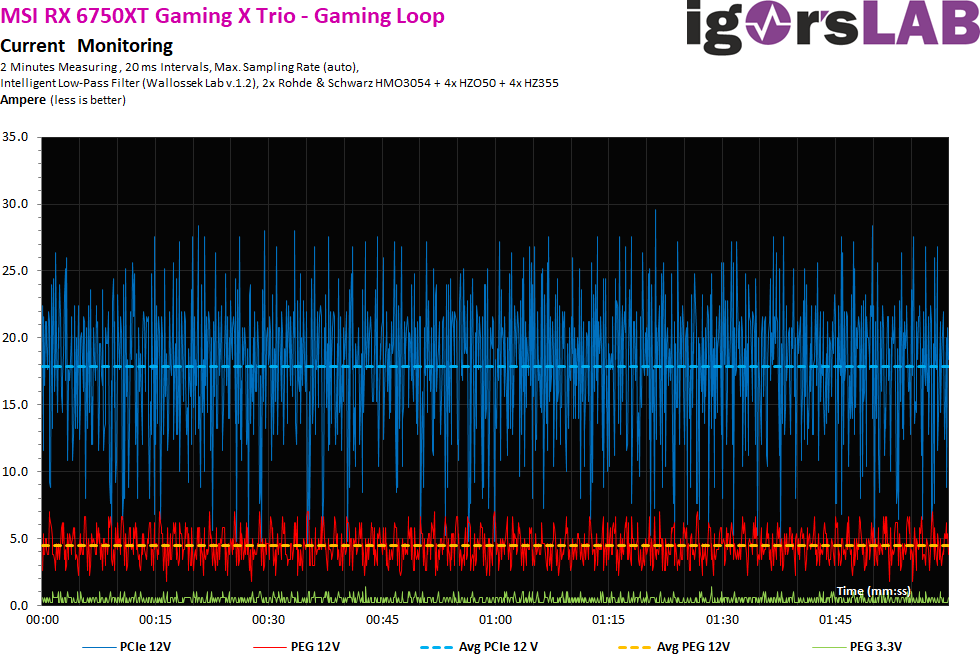
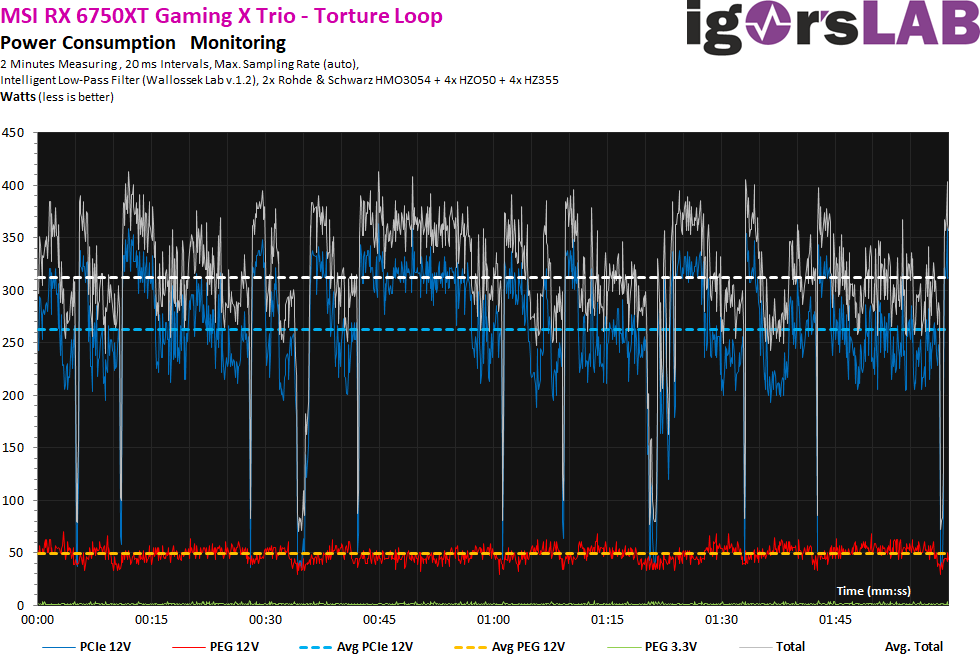
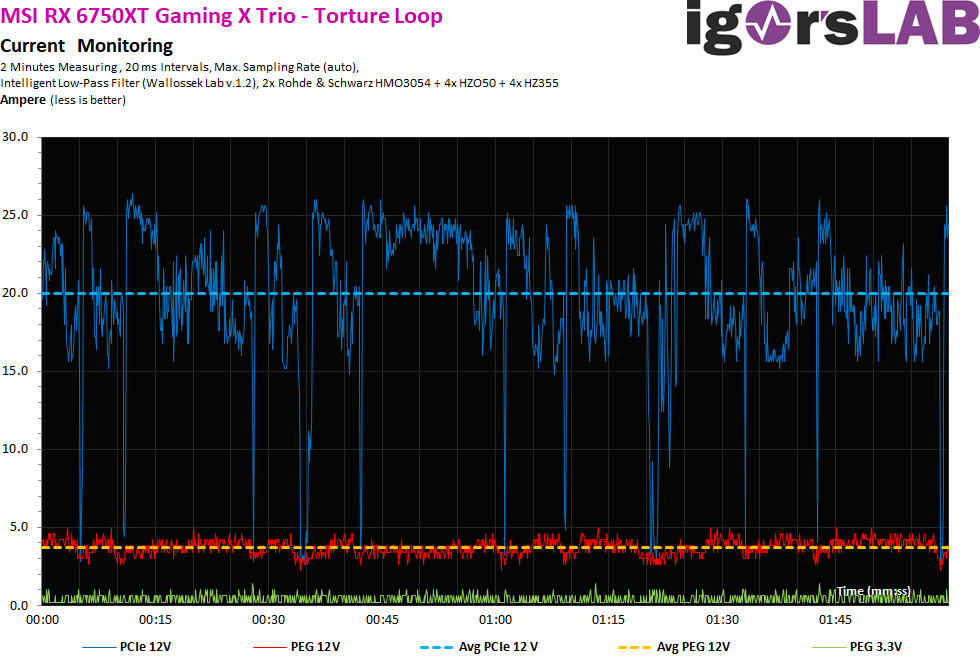
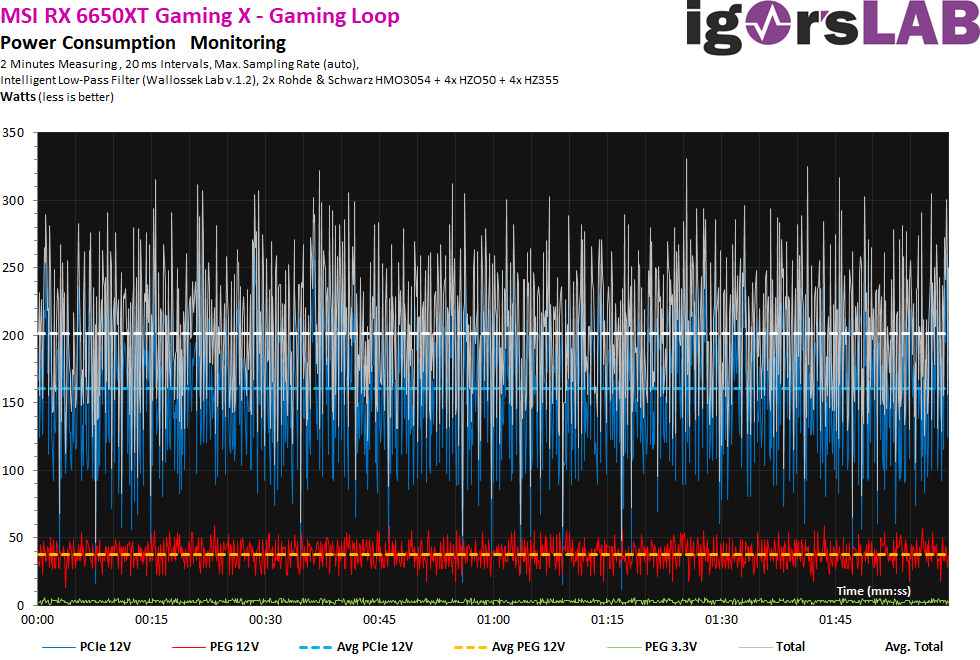
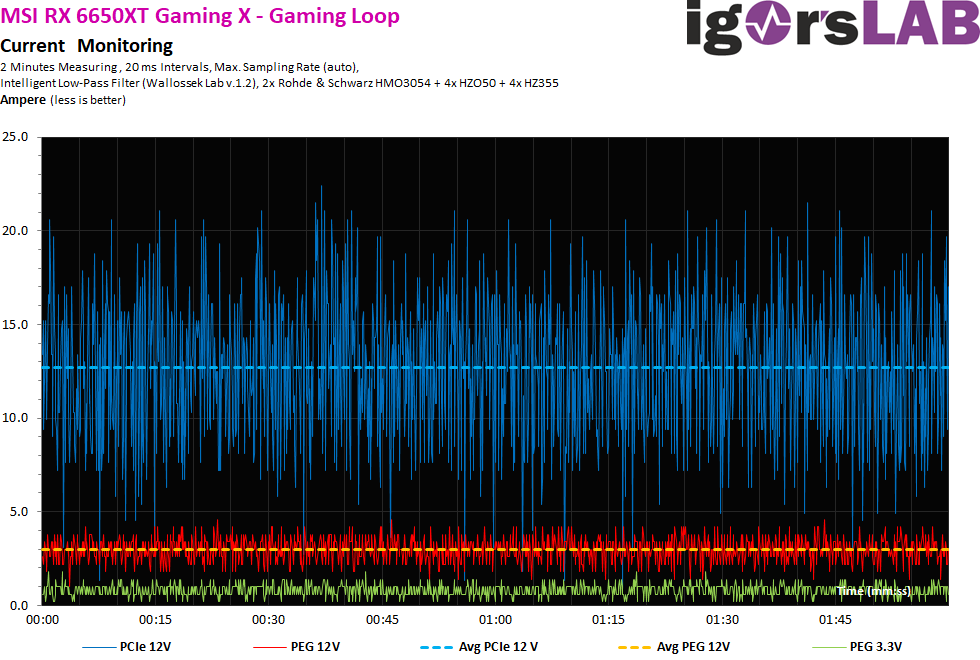
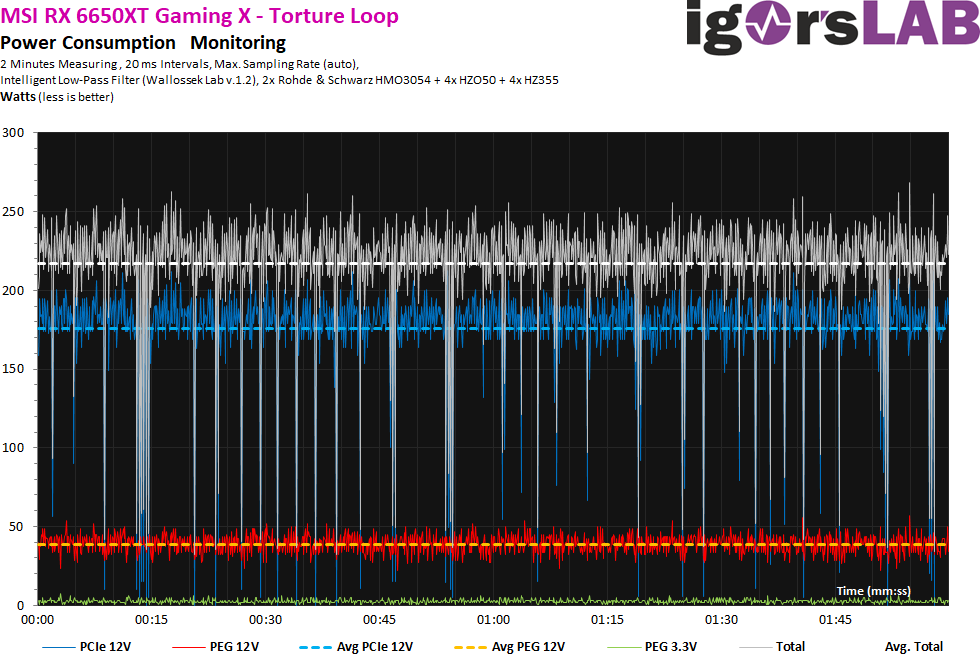
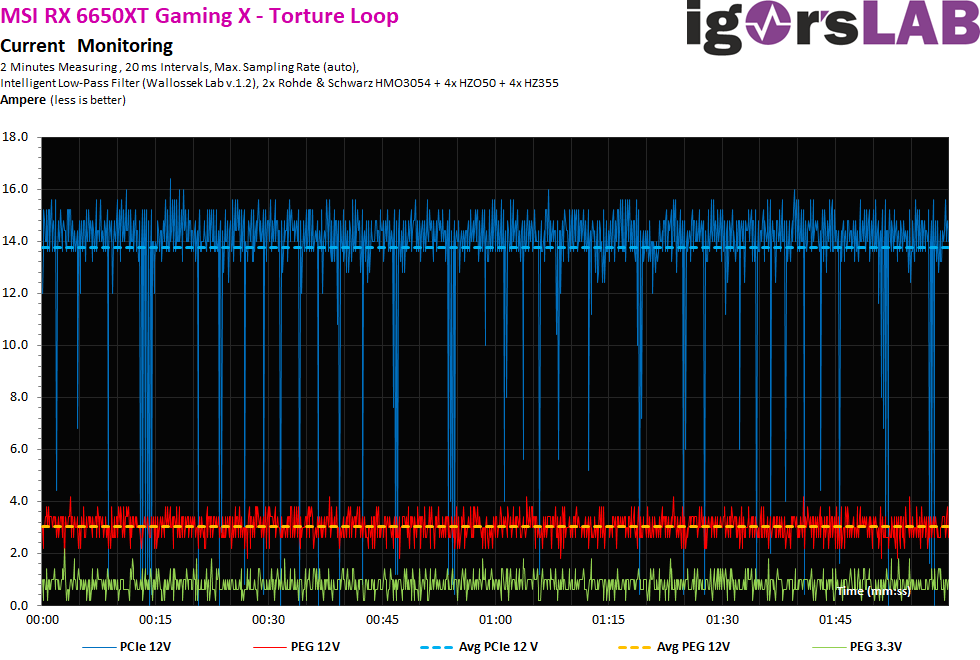
The somewhat more detailed curve for gaming and torture looks quite relaxed towards the top, although the intervals with the long 20 ms are still very granular. In detail, these intervals (the load peaks will follow shortly) look like this for the average gaming loop (Horizon Zero Dawn as an example) and Furmark:


- 1 - Intro, Unboxing, Specs and Test System
- 2 - Gaming Performance Full-HD (1920 x 1080 Pixels)
- 3 - Gaming Performance WQHD (2560 x 1440 Pixels)
- 4 - Gaming Performance Ultra-HD (3840 x 2160 Pixels)
- 5 - FPS-Curves and Percentiles
- 6 - Frame Times and Variances
- 7 - Gaming: Power Consumption CPU, GPU and Efficiency
- 8 - Power Consumption in Applications and Details
- 9 - Standards, Transients and PSU Recommendation
- 10 - Temperatures and Thermal Imaging
- 11 - Fand Speed and Noise
- 12 - Summary and Conclusion


87 Antworten
Kommentar
Lade neue Kommentare
Urgestein
Mitglied
Veteran
Mitglied
Mitglied
Urgestein
Veteran
Urgestein
Mitglied
1
Mitglied
Mitglied
Mitglied
Mitglied
1
Mitglied
Urgestein
Urgestein
Urgestein
Alle Kommentare lesen unter igor´sLAB Community →