


IMC tests
Finally, there are a few real benchmark tests to examine how reliable the SP values actually are. Of course, I couldn’t resist running a few RAM-OC tests as well, so let’s start with that. In the last Raptor Lake Binning article, I had already explained how little the MC SP, i.e. the silicon prediction of the memory controller, says about the actually possible stable RAM clock. So now I wanted to know: Is this still the case with the 14th generation, when Intel itself has even advertised DDR5-8000? Has the RAM controller perhaps been improved?
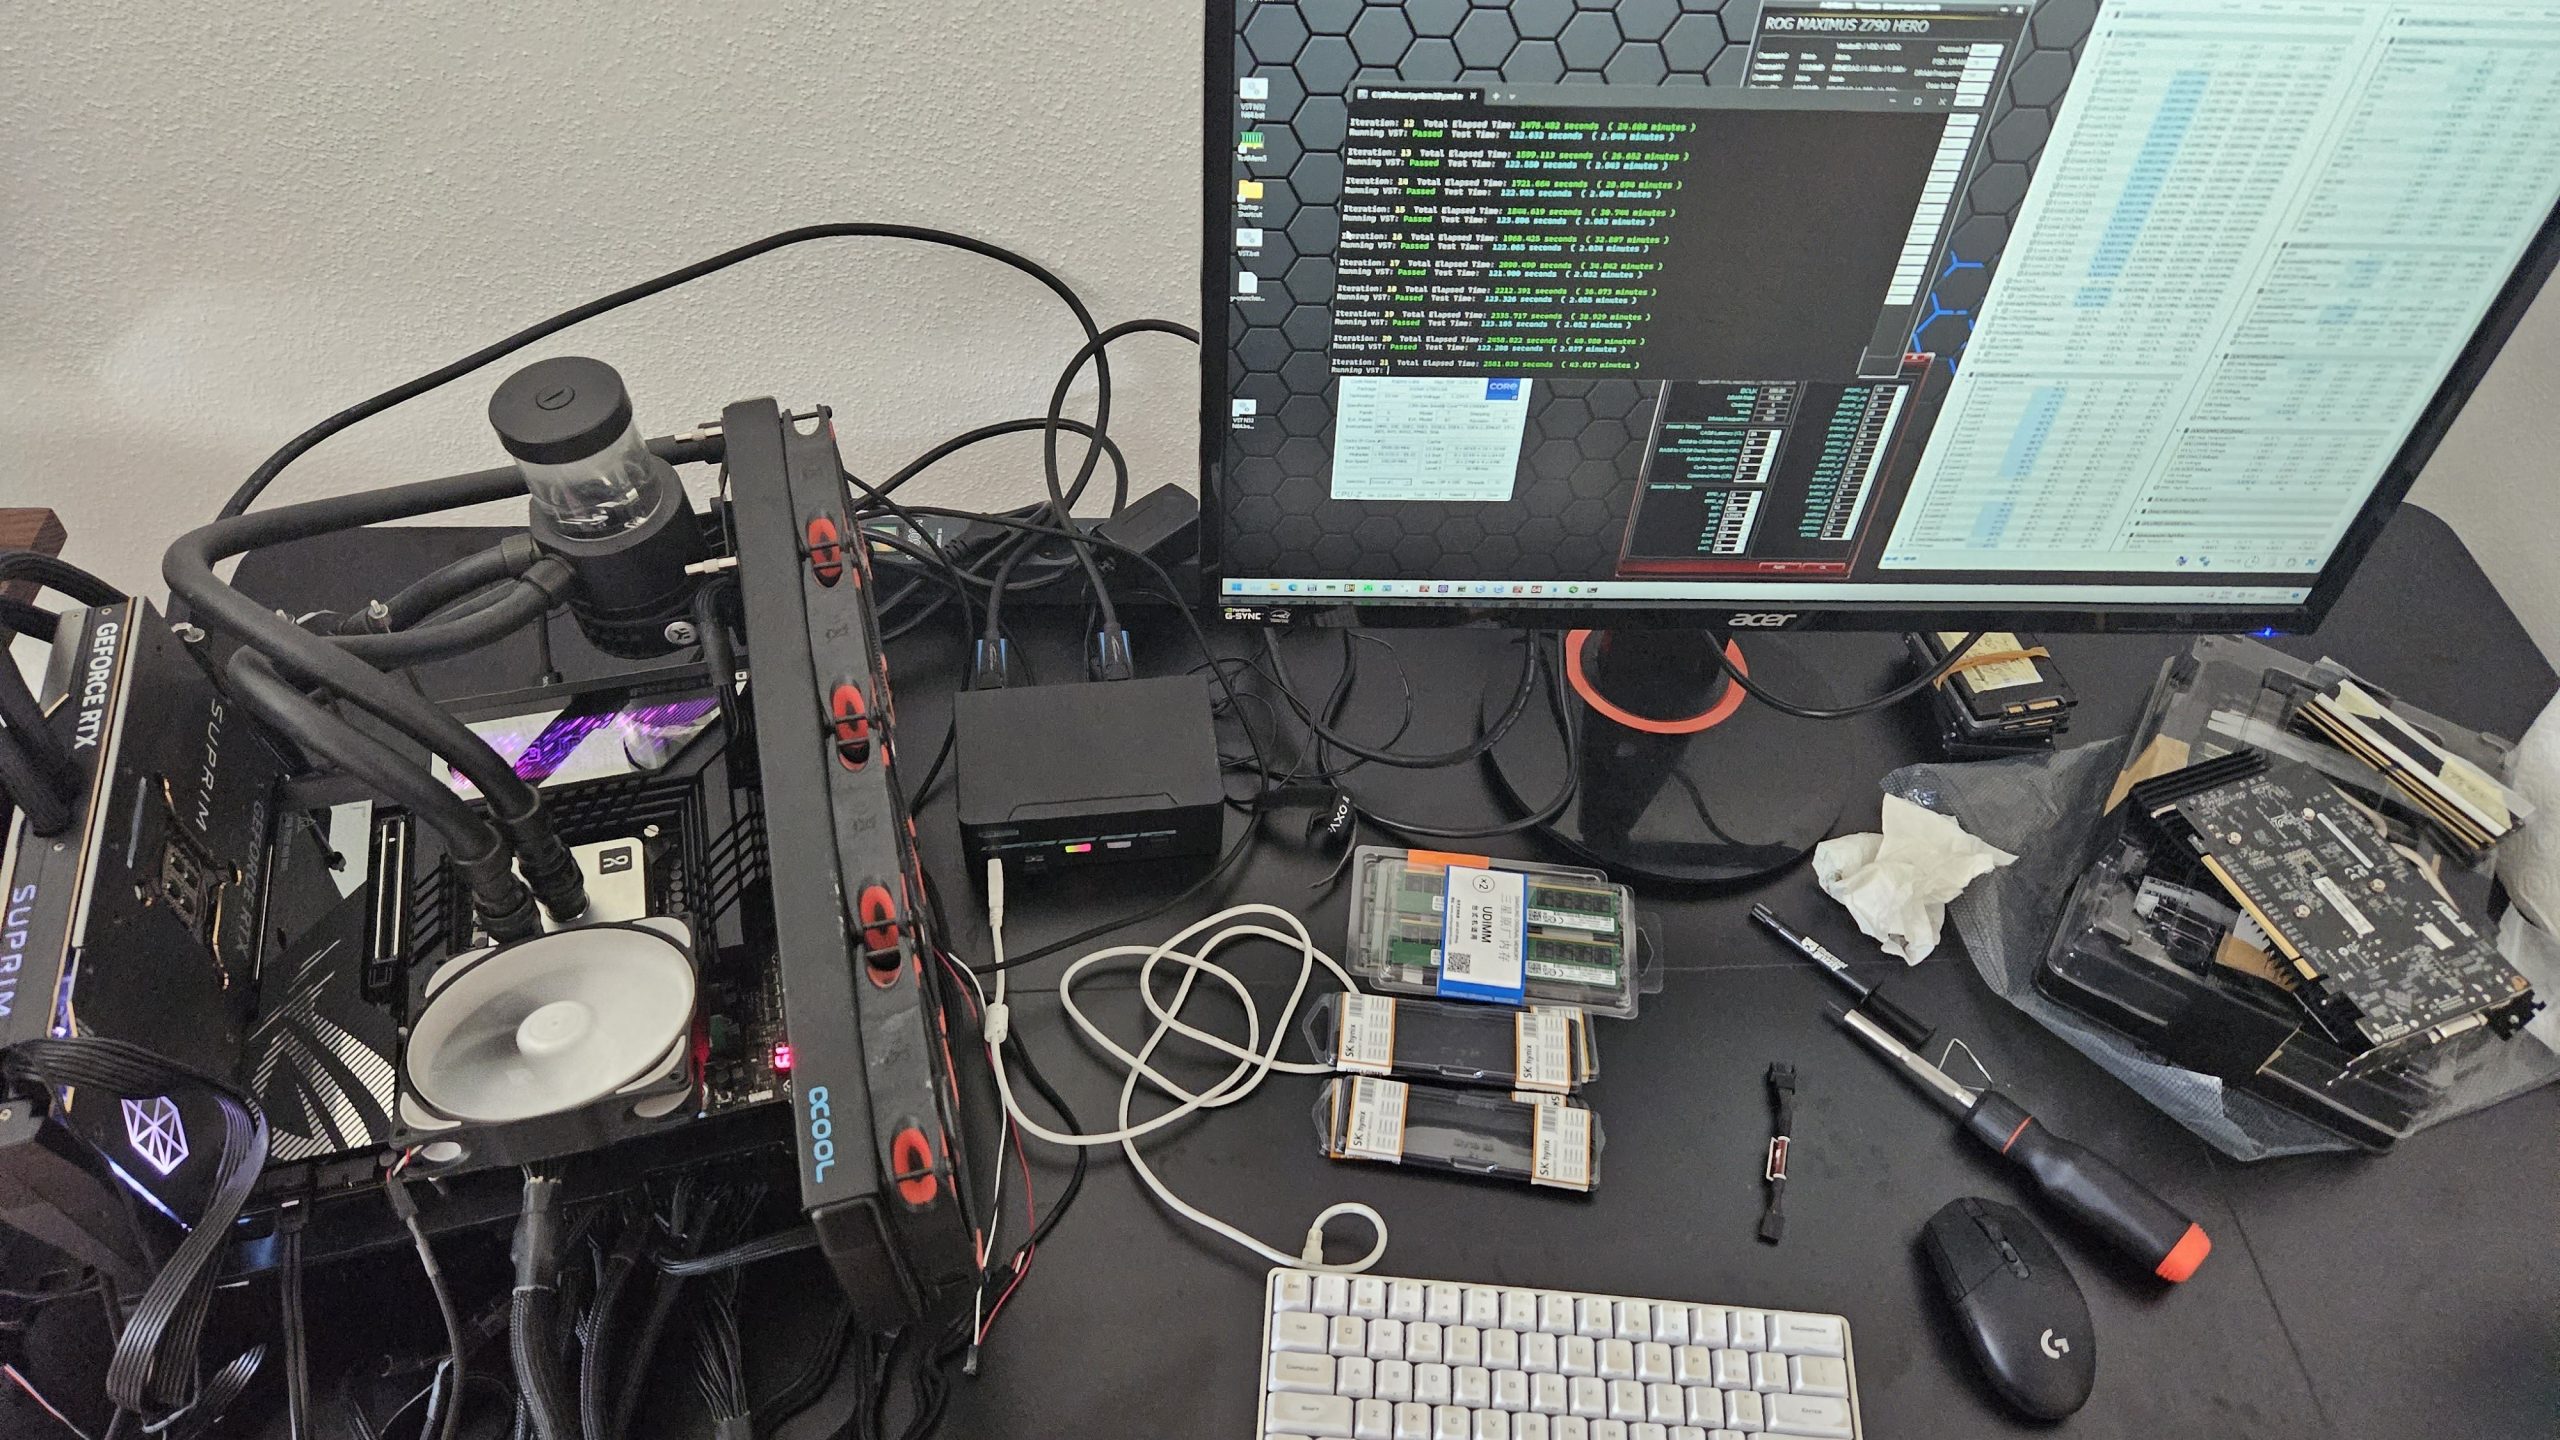
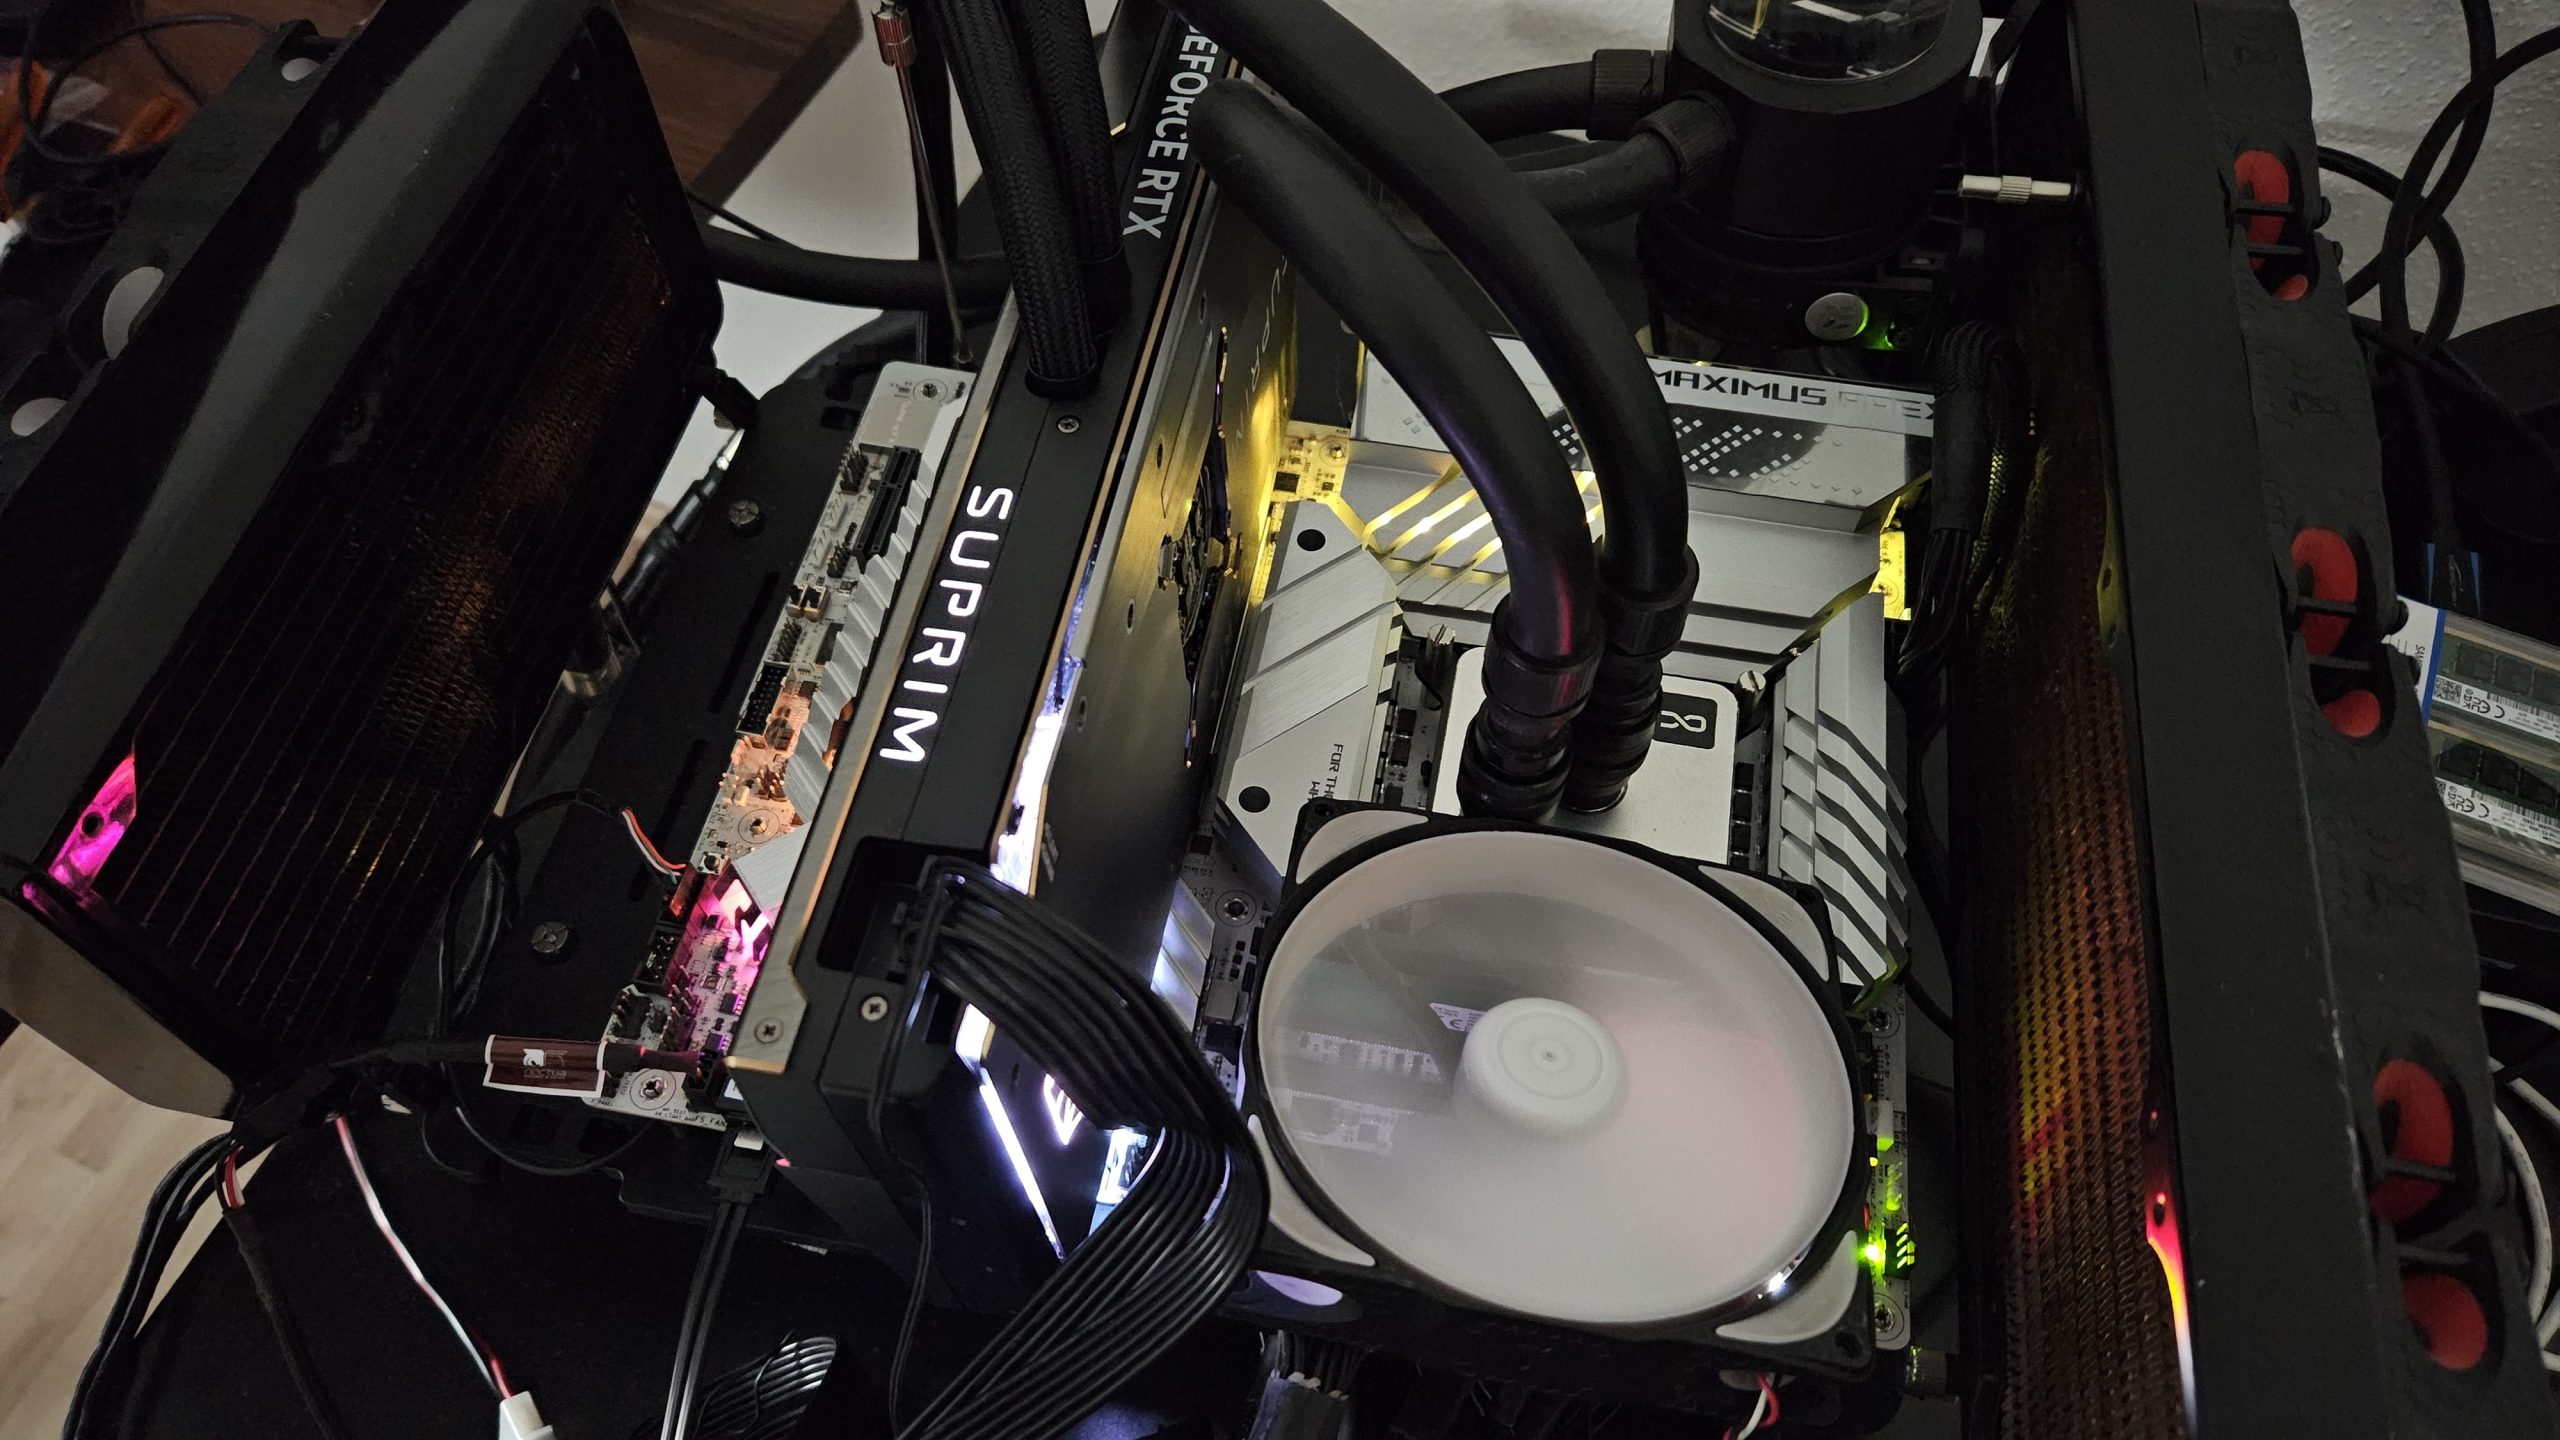
I was kind enough to take some CPUs to my home test bench and test them extensively there. In order to remain comparable, I used the same setup as for the IMC tests with the 13900KF. The mainboard used is the Asus Maximus Z790 Hero, tested with 1.6 V on the specially binned single-rank Hynix 16 Gbit A-Die modules and other voltages set to “auto”. The primary timings are set to 38-48-48-48 and the RAM clock is increased until y-cruncher can no longer create 10 error-free loops with the VST algorithm.
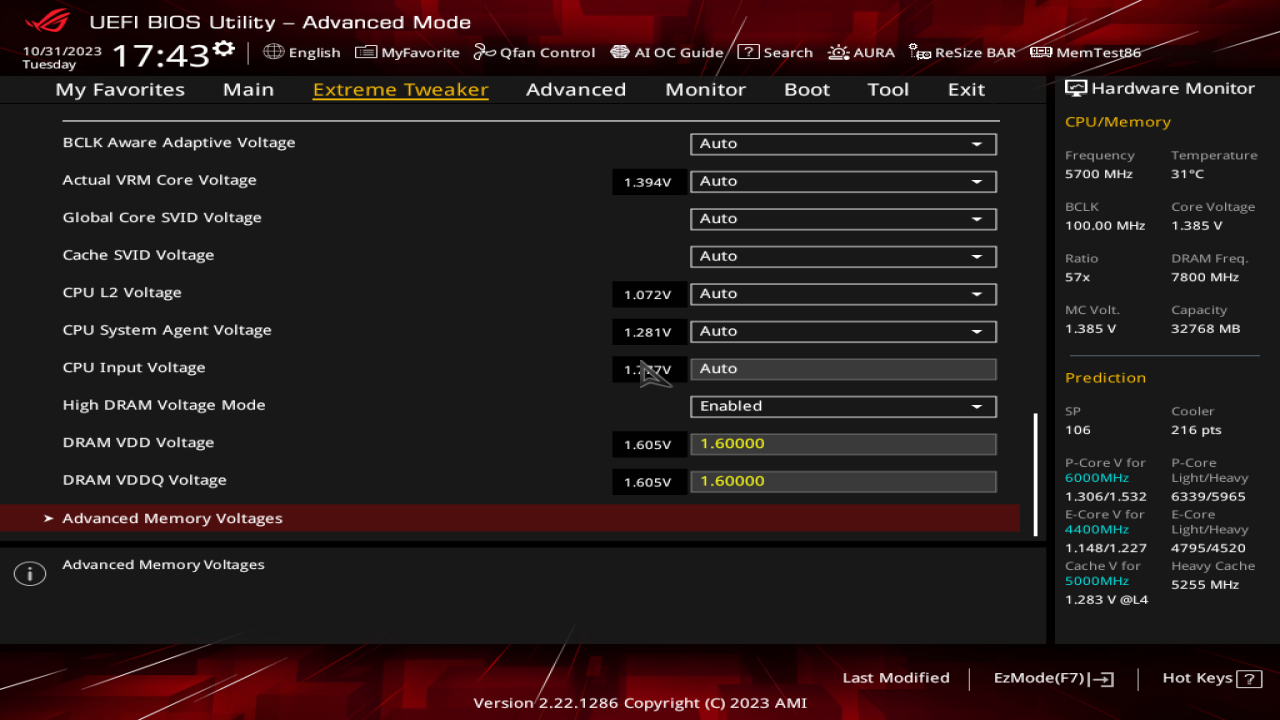
For the BIOS, I initially wanted to go to the latest release at the time of the test 1402, but then I realized that my 13900KF CPU could only reach DDR5-7400 stably, whereas previously DDR5-7800 was still possible. So something must have changed in the auto RAM settings in this BIOS release, in a negative sense. So I flashed back to 0904 from March 2023 and lo and behold, 7800 Mbps runs smoothly again. And in fact, i9-14900K(F) and i5-14600K(F) CPUs also work with this relatively antiquated BIOS. Only the i7-14700K(F) remains stuck in POST – probably because it is a new CPU type with regard to the number of cores.
I can’t test the i7s on the Hero, but the RAM tests are therefore directly comparable with those of the last binning from January 2023. All CPUs are then allowed to run again on the Asus Maximus Z790 Apex with the latest BIOS, so that we also have a 2-DIMM motherboard with the latest BIOS for comparison. The 14700K(F)’s will then also run there. My 13900KF CPU, which I have always used for reviews of RAM kits, is also included and I have also read out the MC SP for each CPU for fun.
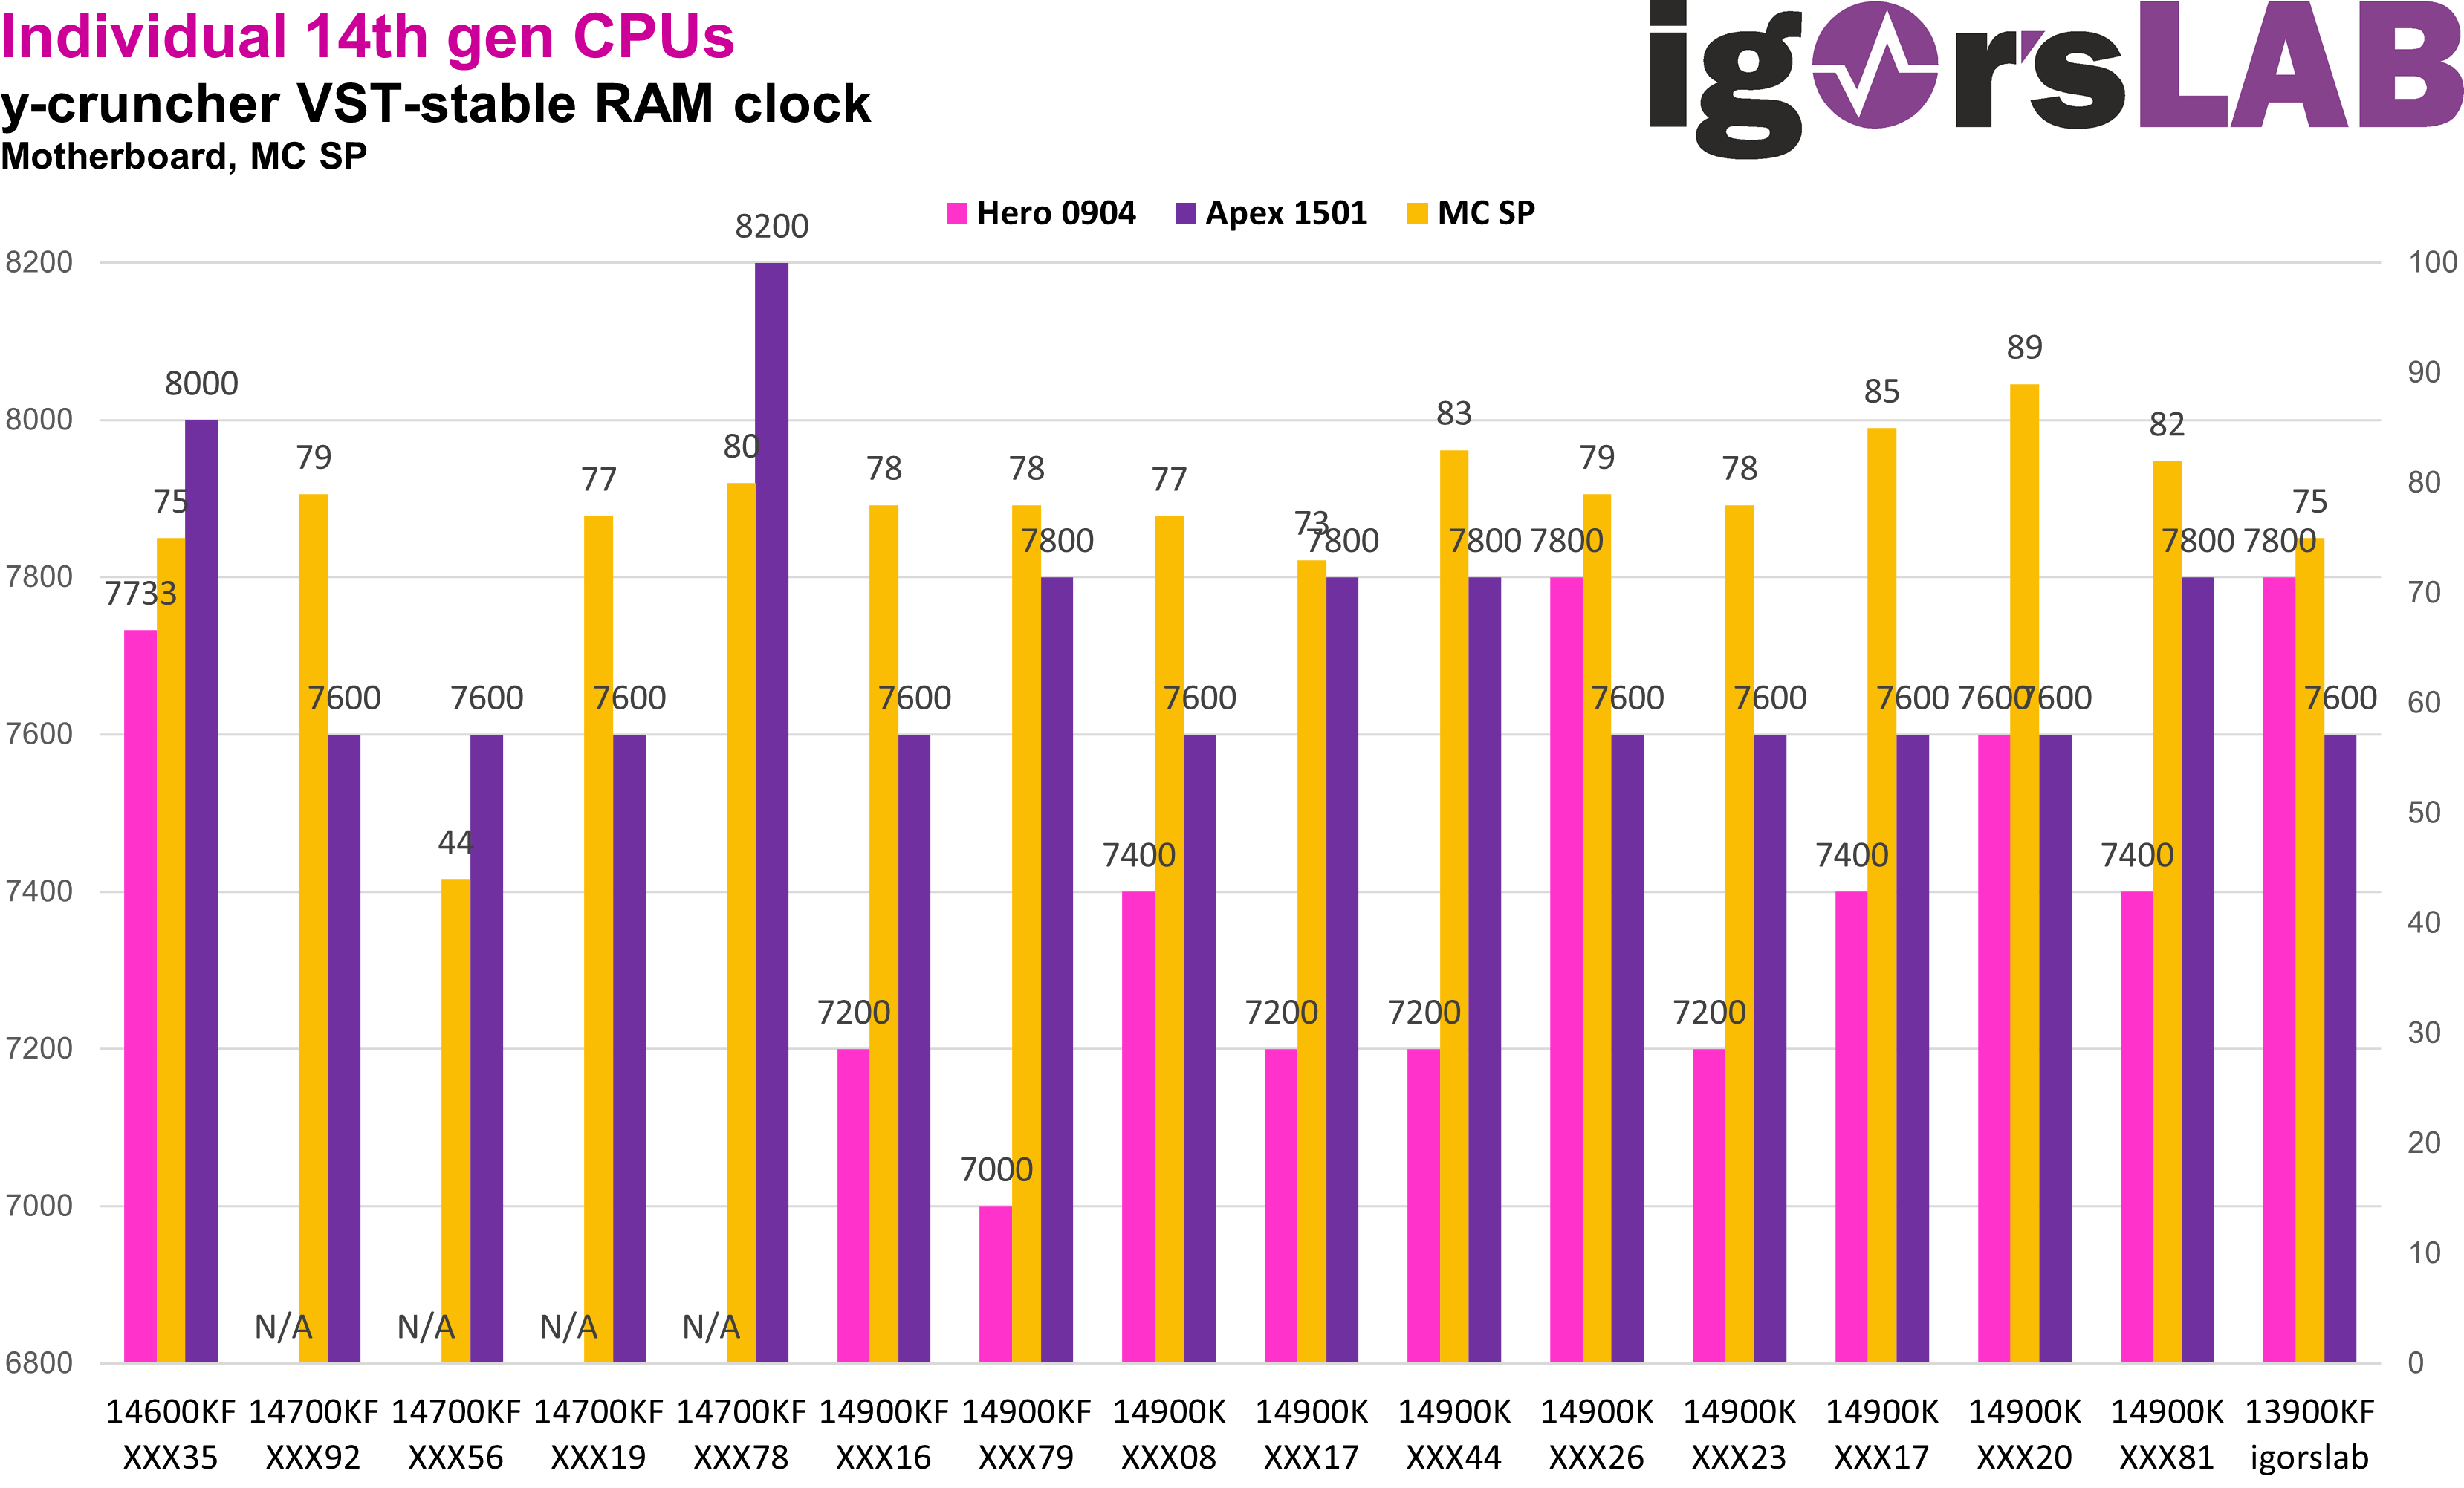
What do we see here now? Exactly, nothing. Everything is completely random and the MC SP still has no meaning for real daily use cases with stability – or I am reproducibly unable to measure it. It is also bizarre that some CPUs manage a higher RAM clock on the Hero than on the Apex. With other chips it is the other way around, only rarely can a CPU deliver good results on both boards. DDR5-8000 can only be achieved by 2 of the 15 CPUs, and only on the Apex mainboard. One of the CPUs doesn’t even manage DDR5-7000 stably on the Hero – a new negative record. Incidentally, these are CPUs that have well above-average SP values – so they are not rejects. What should we make of the fact that Intel advertises “beyond 8000 MT/s”? I’ll leave the question as it is.
SP values vs. Cinebench R23
If the MC SP is already unreliable, how reliable is the SP of P and E cores? After all, this is apparently based on real values, the VID programmed by Intel. But how accurate is this actually? To find out, I ran each CPU through Cinebench R23 again and increased the clock and voltage until the benchmark crashed or the system was bluescreened. Of course, Cinebench is still not a stability test, nor will it ever be, but it is a useful piece of software for quickly comparing CPUs in terms of their clock potential.
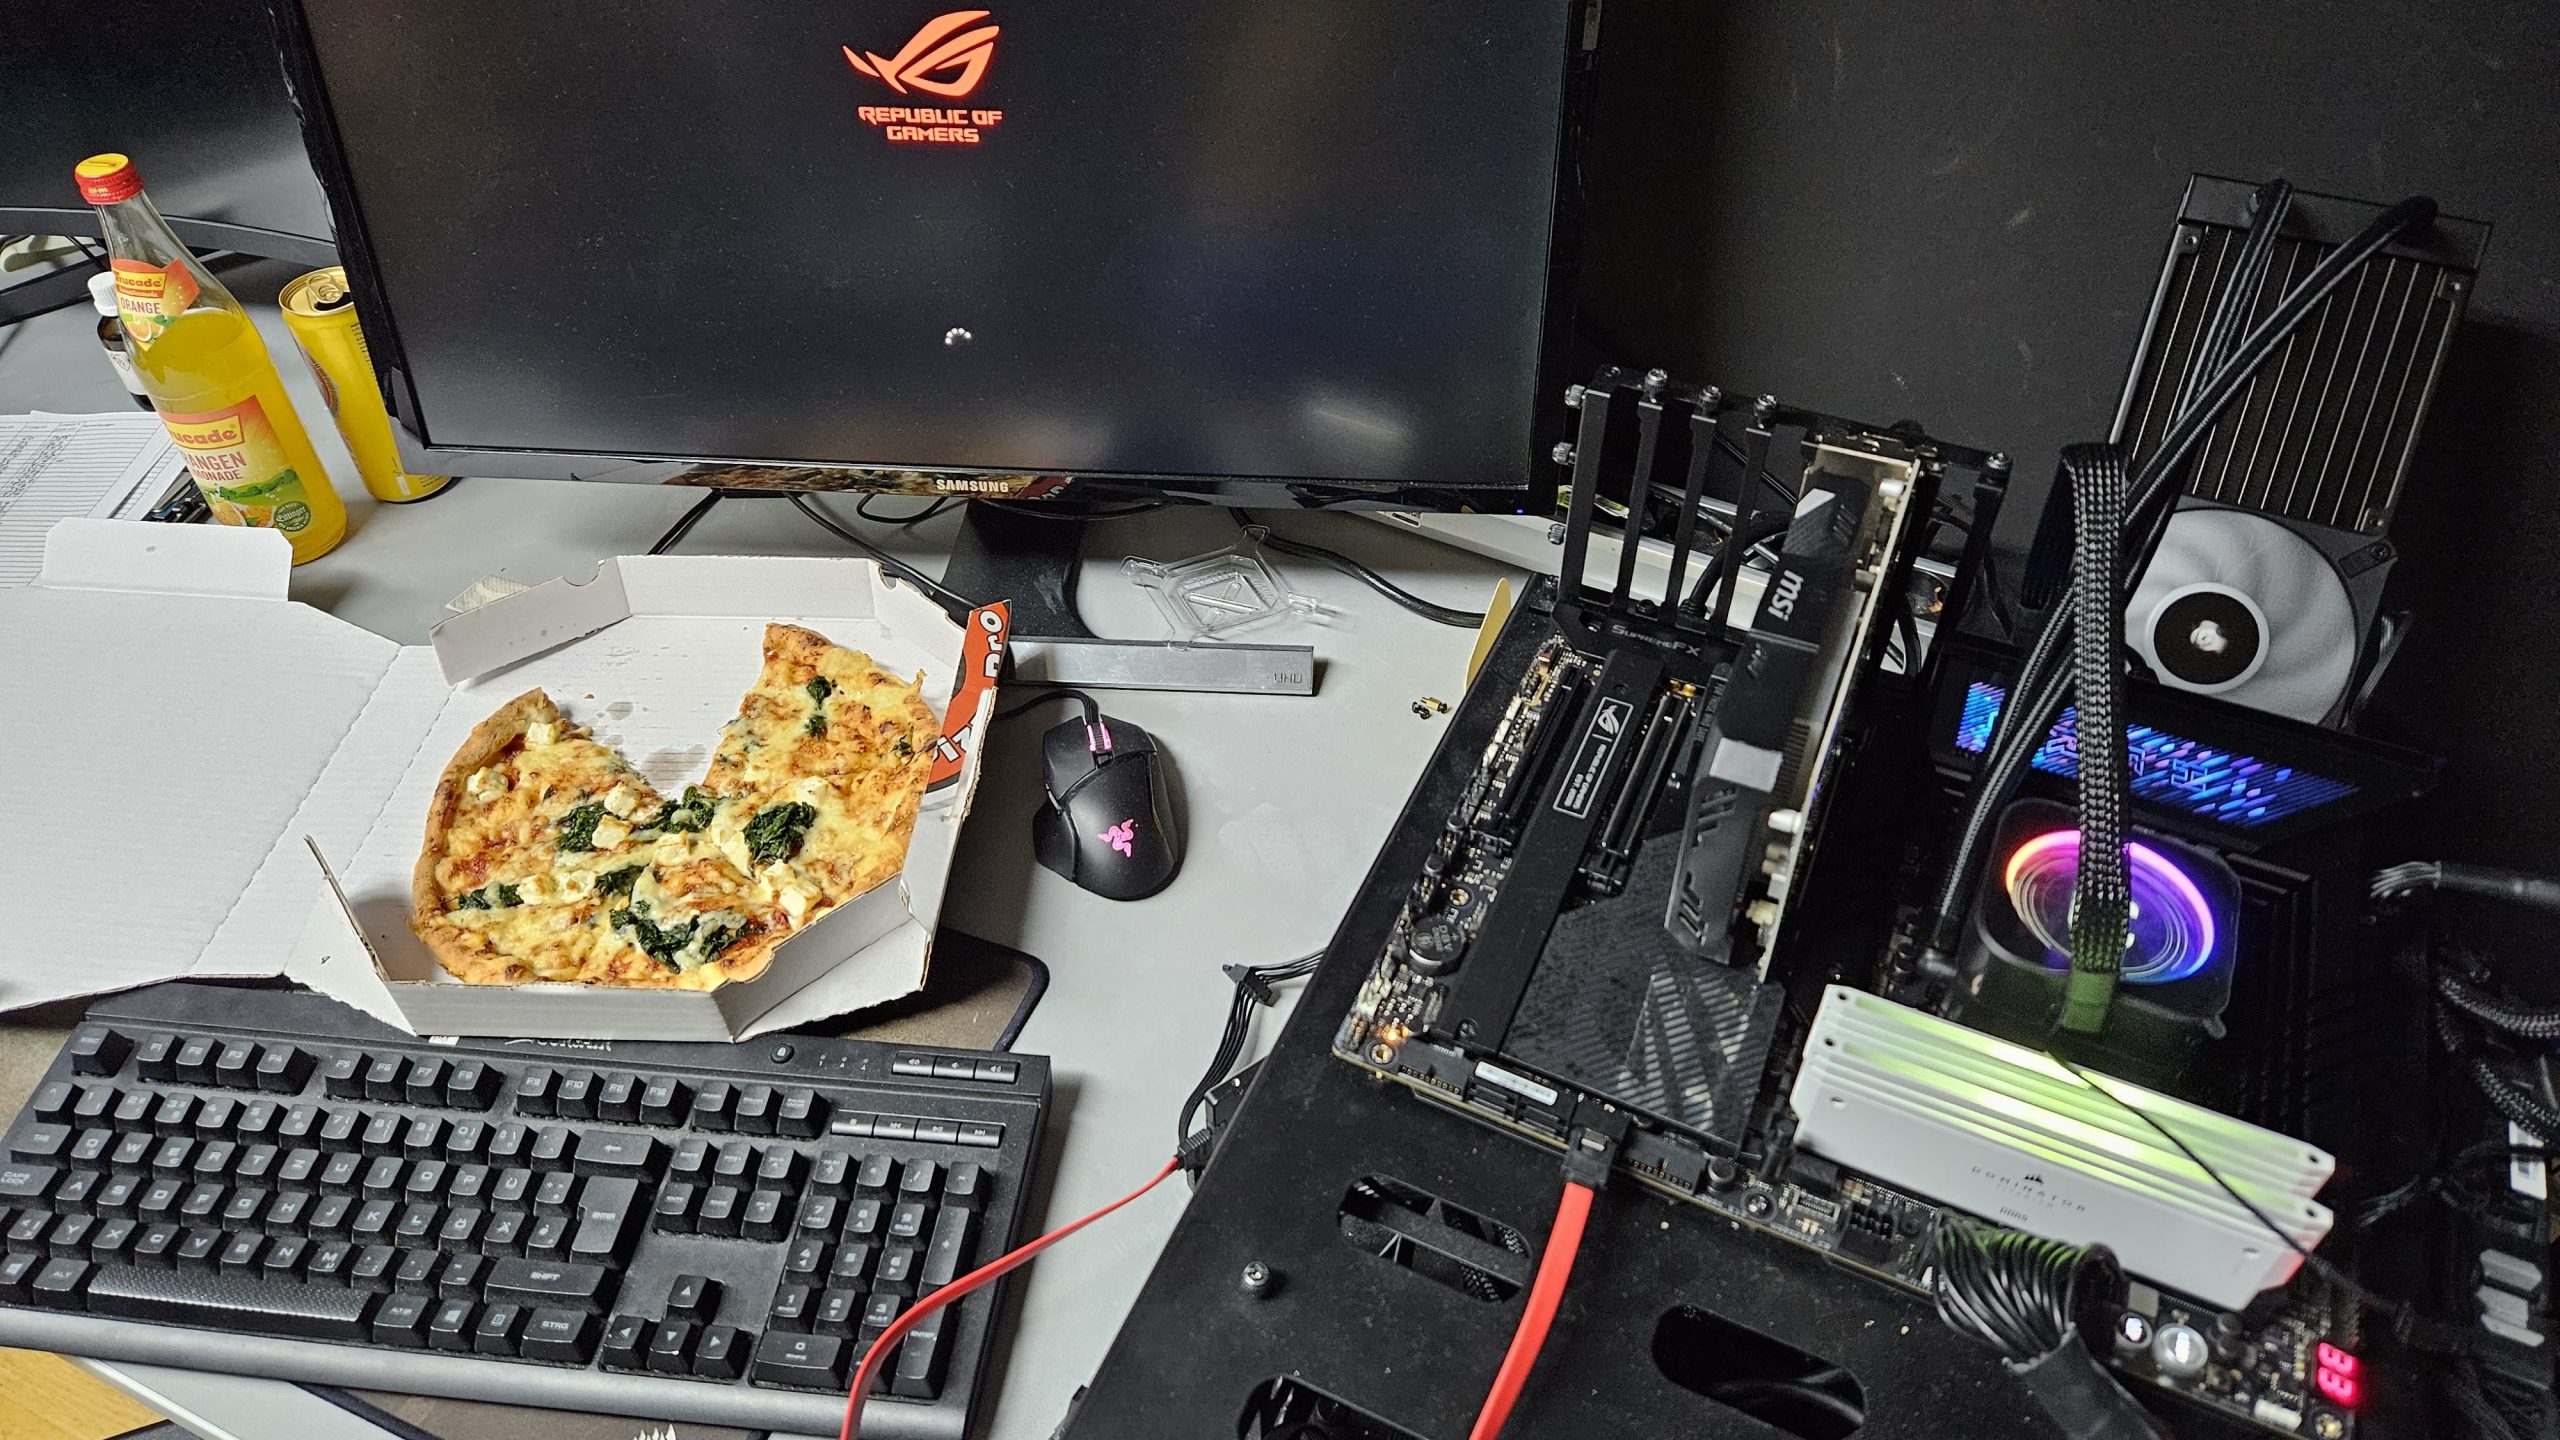
Cooling is provided by my usual custom water cooling loop with Alphacool Core 1 cooler, various radiators and 140 l/h flow rate. The water temperature is between 22 and 25 °C. In the mainboard settings, the LLC was set to level 6, which provides a good mix of Vdroop and stability. The clock rates of P-cores, E-cores and cache are set statically and, if necessary, refined with BCLK if a whole multiplier step leads to a crash. Temperature and performance limits have been raised as far as possible.
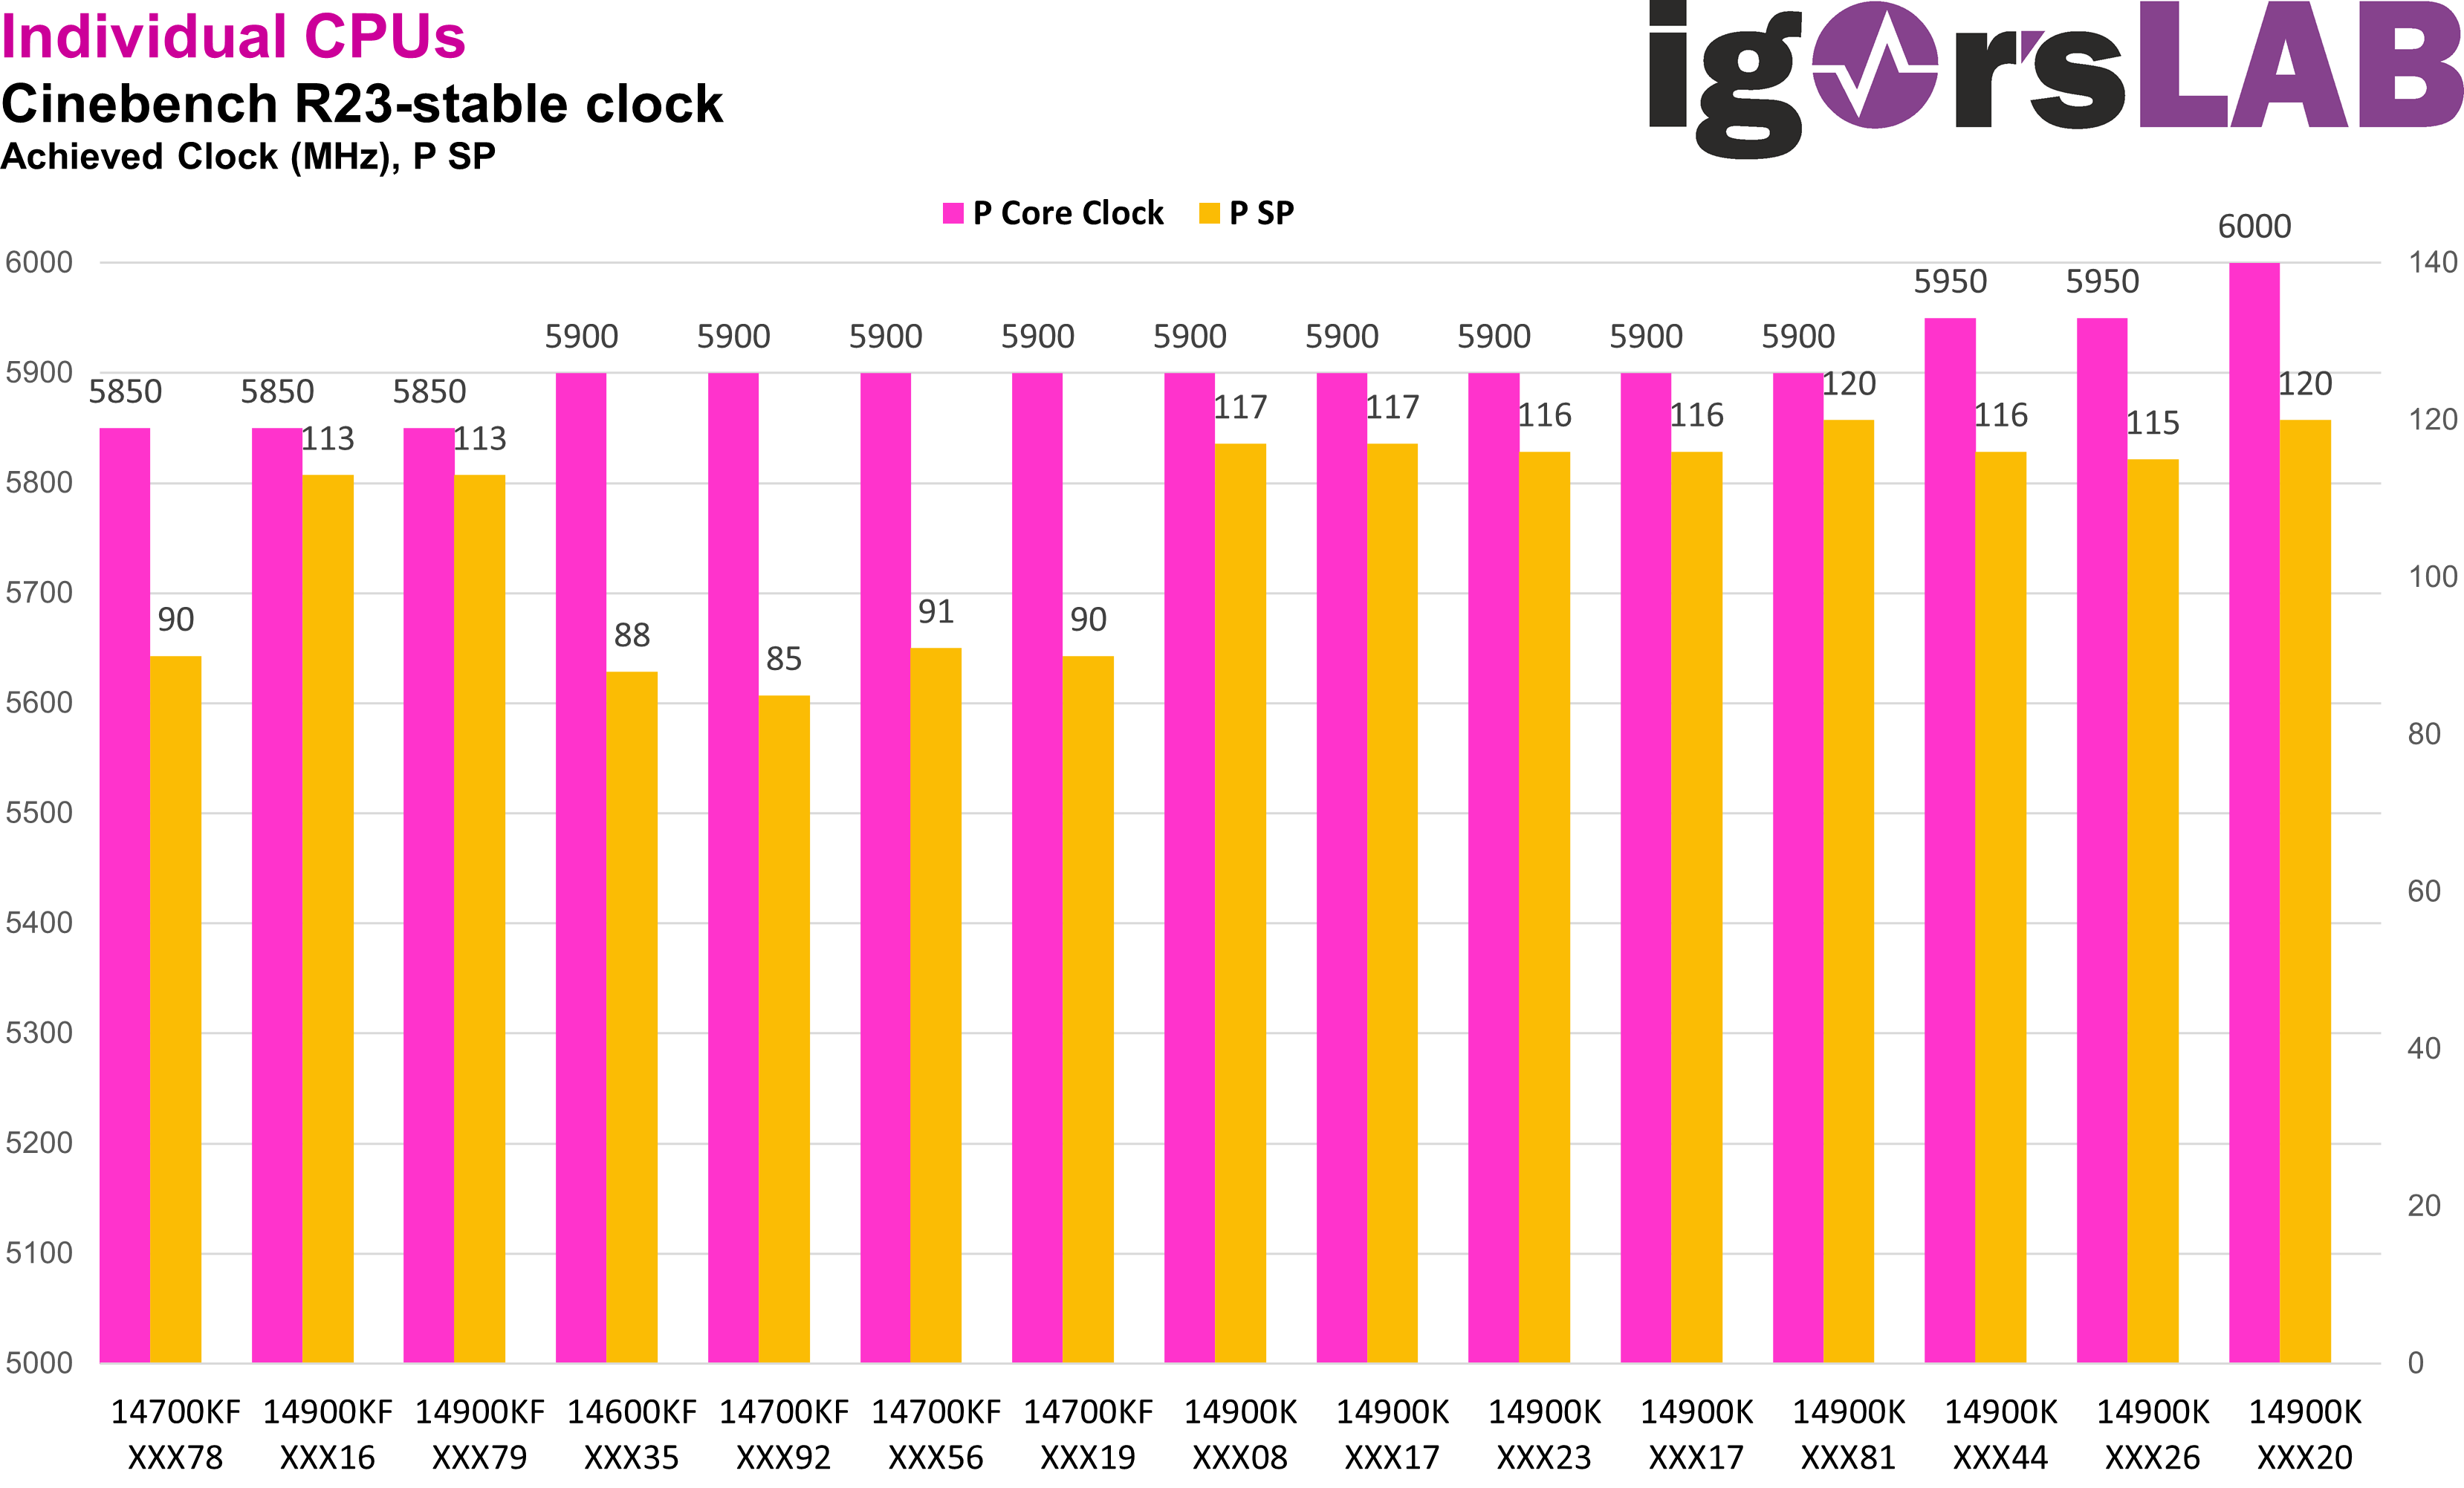
The weighting of the SP values can be clearly seen here: An i7 with P SP 90 achieves the same clock rate as an i9 with P SP 113. As already mentioned, these are CPUs that have already been pre-selected on the basis of the SP, which is why they all achieve a relatively high clock rate on all cores. However, the SP is not the whole truth, because on the one hand, an SP difference of a maximum of 6 points cannot even result in a 50 MHz difference in the clock rate of the 14700KF chips. On the other hand, there are two 14900K with P SP 120, one of which achieves 5.9 GHz, the other 6.0 GHz. So yes, the P SP indicates a reliable trend to some extent, but the last 5-6 SP points – equivalent to 25 – 30 mV – are probably still a matter of luck.
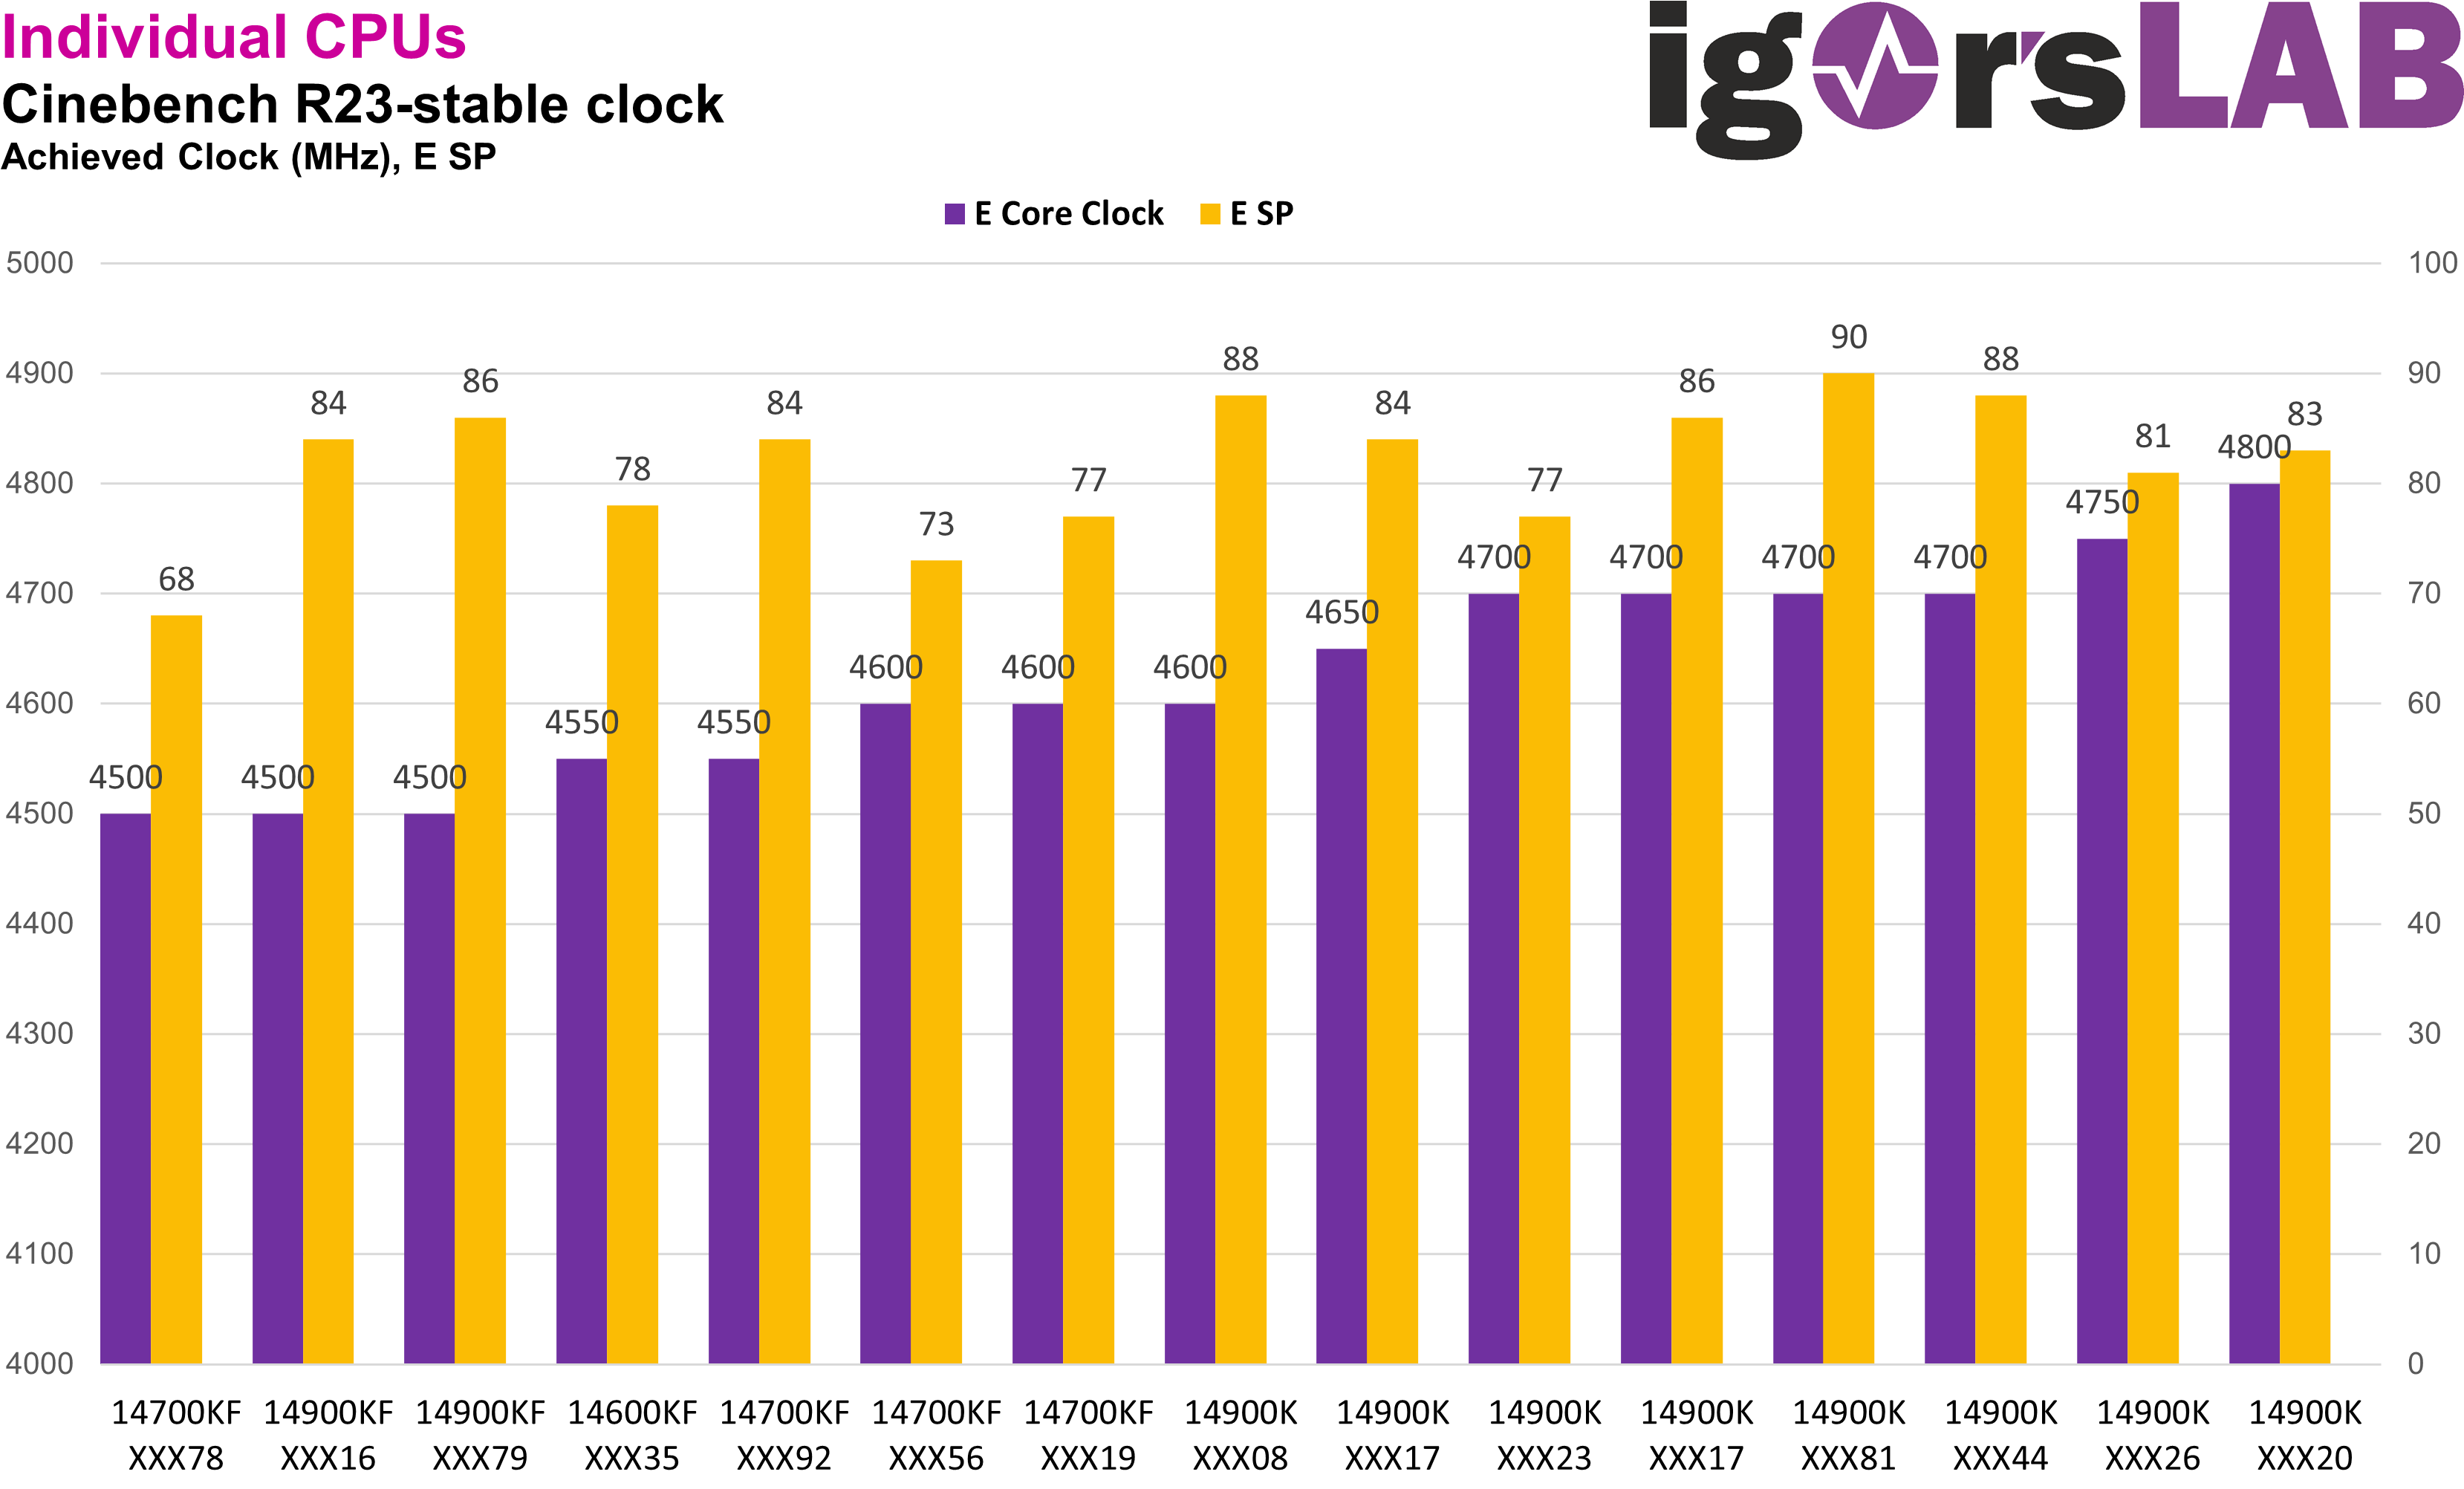
The whole thing becomes even clearer when we look at the maximum stable e-core clock. The worst E SP of 68 also manages the lowest clock rate and the highest E SP of 90 is at least in the right third, but apart from that, almost anything is possible. The highest E Core clock rate is achieved by an E SP 83, while an E SP 88 gives up at 200 MHz less. So here too, only a real benchmark test is really reliable in case of doubt and of course the cooler with its mounting (washer mod / frame) also plays a decisive role. Here I used the stock LGA, but repeated the tests 3 times each time with a new mounting.
Now we don’t know for sure what the E SP is based on – most likely also on VID values – and how accurate it is. As we know, E cores are always combined in clusters of 4, which are clocked together and can therefore also have a V/F curve together. However, if all E cores are to run at full speed at the same time, a small discrepancy between the VID of a cluster and the requirements of a single core is of course enough to falsify the SP calculation. In this respect, the weighting of P SP to E SP in a ratio of 2:1 or 4:1, if you consider the number of core types, seems quite sensible on the part of Asus.
Summary
As the benchmark tests show, the SP of P and E cores and thus the overall SP value is quite reliable. Although there appear to be uncertainties of 20-30 mV, as is so often the case, this can only be measured in real benchmark tests. However, many other variables also play a role here, even more so if you want to operate XOC below 0°C, where the scaling from clock to voltage often behaves quite differently.
The MC SP is still not really meaningful for the actual stable, maximum RAM clock rate, whether with old or new BIOS and whether on 2-DIMM or 4-DIMM mainboards. Unfortunately, only a real test will help here. The RAM controller (IMC) seems to have remained the same since the 13th generation, if in our test DDR5-7800 on the Maximus Z790 Hero motherboard is the absolute limit, which only 1 of 15 new CPUs reaches. The fact that Intel promises more than 8000 Mbps seems, despite the footnote and disclaimer on the presentation slide, kind of like a sham. If Intel already sells CPUs with special core quality as an extra SKU, why can’t they do the same for the RAM controller? Many of the already rather unreasonable target group would probably be happy to pay extra for a 14900KSR.
Raptor Lake Refresh is at most just that, as confirmed by the binning results. In fact, Intel seems to have moved the old 13900 CPUs 1 to 2 SP steps down to make room for the new i9-14900K and 14900KF variants. According to our data, the best of the best CPUs have improved by a maximum of 20 mV compared to the last generation. One could say, “13900KSS” would be a more accurate product name. If we are to believe screenshots in relevant Internet forums, our 13900KS yield was not the best back then either.
Whether there is any truth to the speculation about the “R” batches, the antennas on my aluminum hat are not able to tell me clearly. If you ask alleged insiders about this, you often just get the answer “Batches don’t matter anymore!”. Of course, there is also a certain psychological component here, in that you subconsciously want to recognize patterns in the data in order to believe that you can see the potential main prize. Anyone who has ever opened a few loot boxes will be familiar with this. Nevertheless, it would be just as negligent not to point out this peculiarity in the data, especially if you detach yourself from the letter “R” alone. Because if you look at the counter part of the batch number lexicographically, you can see the behavior in i5, i7 and i9 CPUs of the 14th generation.
So, enough amateur data science on my part. Now it’s your turn! The data is of course available to you again in the form of the Google Sheet: https://docs.google.com/spreadsheets/d/1MQUSjXqYPPYV3Sb9P0RIni6OEkncPKnySg7XpuJdkRY/
Feel free to browse through the Excel wallpapers yourself and if you find any more interesting correlations or strange anomalies, please let us know in the forum! Finally, all that remains for me to say is thank you for reading and thanks again to MIFCOM for this unique opportunity – hopefully until the next binning! 😊


34 Antworten
Kommentar
Lade neue Kommentare
Urgestein
Veteran
Moderator
Urgestein
Urgestein
Mitglied
Urgestein
Veteran
Veteran
Urgestein
1
Urgestein
Urgestein
Mitglied
Mitglied
Urgestein
Mitglied
Veteran
Alle Kommentare lesen unter igor´sLAB Community →