


Temperature gradients and boost clock in detail
The cooler works really well for its size and since I want to compare the two BIOS versions, I completely renounce the values of the open construction, which is unrealistic anyway. The comparison reveals very large differences in both the clock and the temperatures. The OC-BIOS allows temperatures of well below 70 °C, while with the Silent BIOS you hit this mark exactly. Interestingly, the extreme jumps at the clock hardly have a negative impact on the percentiles, so that the Silent BIOS is actually the more reasonable solution here as well. Despite all the rule rage.
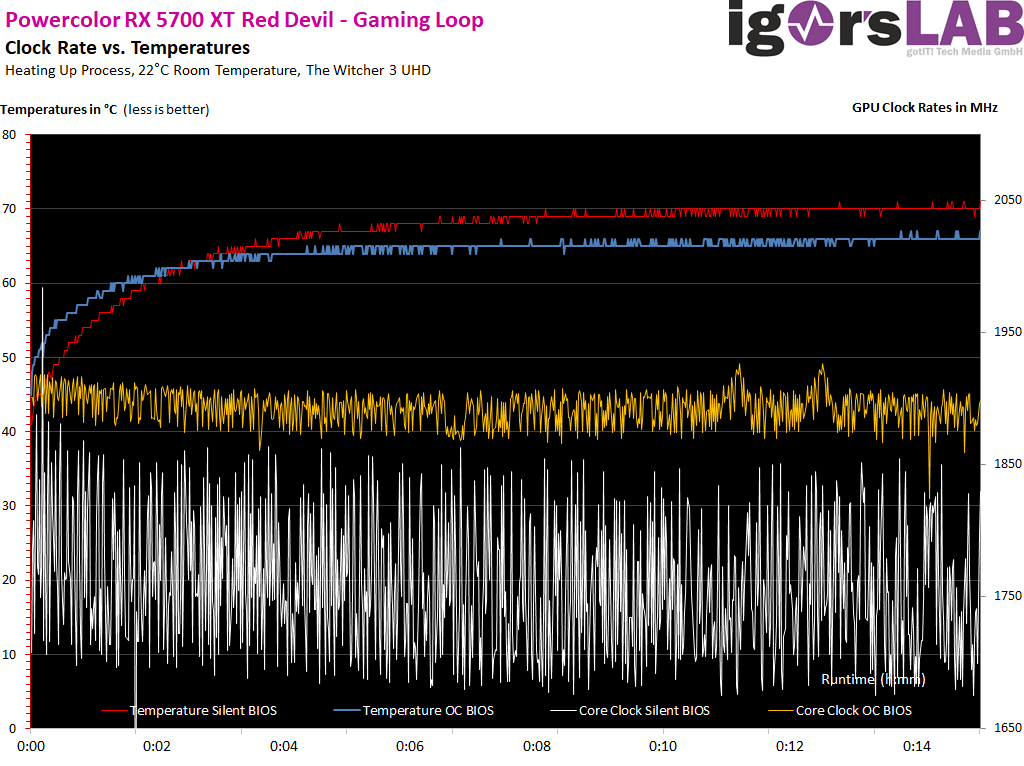
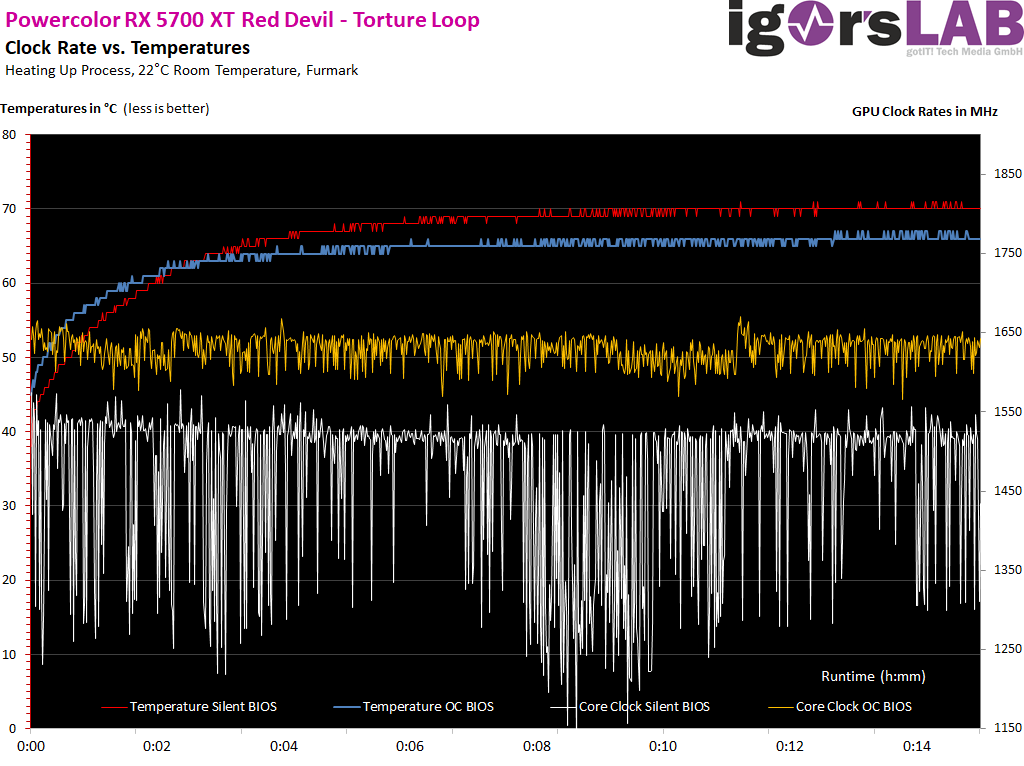
This is no different with the stress test, because the waste heat is largely the same as the power consumption.
And now the whole thing again in sober numbers in table form, whereI compare both BIOS versions in closed housing:
| Initial OC and Silent BIOS |
Final value OC BIOS |
Final value Silent BIOS |
|
|---|---|---|---|
| GPU Temperatures |
33 °C | 66 – 67 °C |
70 °C |
| GPU clock | 1994 MHz | 1888 – 1925 MHz |
1750 – 1798 MHz |
| Ambient temperature | 22 °C | 22 °C | 22 °C |
| Air temperature in the housing | 25 °C | 45 °C | 43 °C |
Board Analysis: Infrared Images
The following image gallery shows all infrared images for the gaming and torture loops in closed construction, but with both BIOS versions as a comparison. The images are self-explanatory and speak a clear language. And I would like to point out once again that the sensor values for the memory are absolute nonsense, because the temperature under the flip-chip modules of the memory is also measurably lower on the board side:
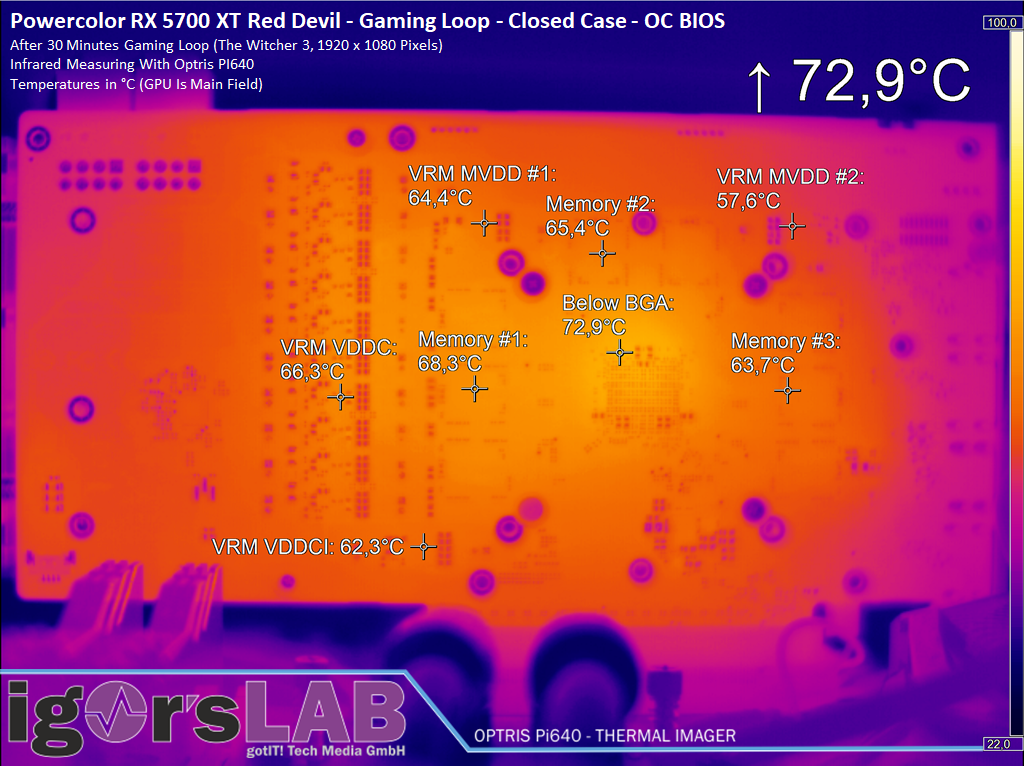
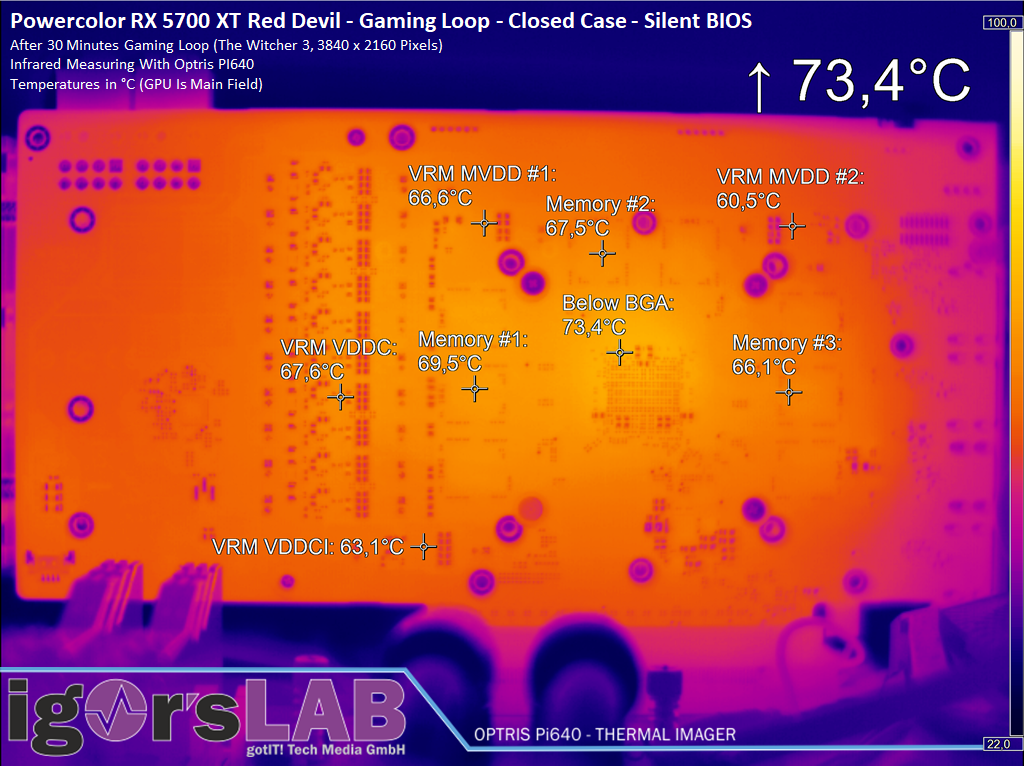
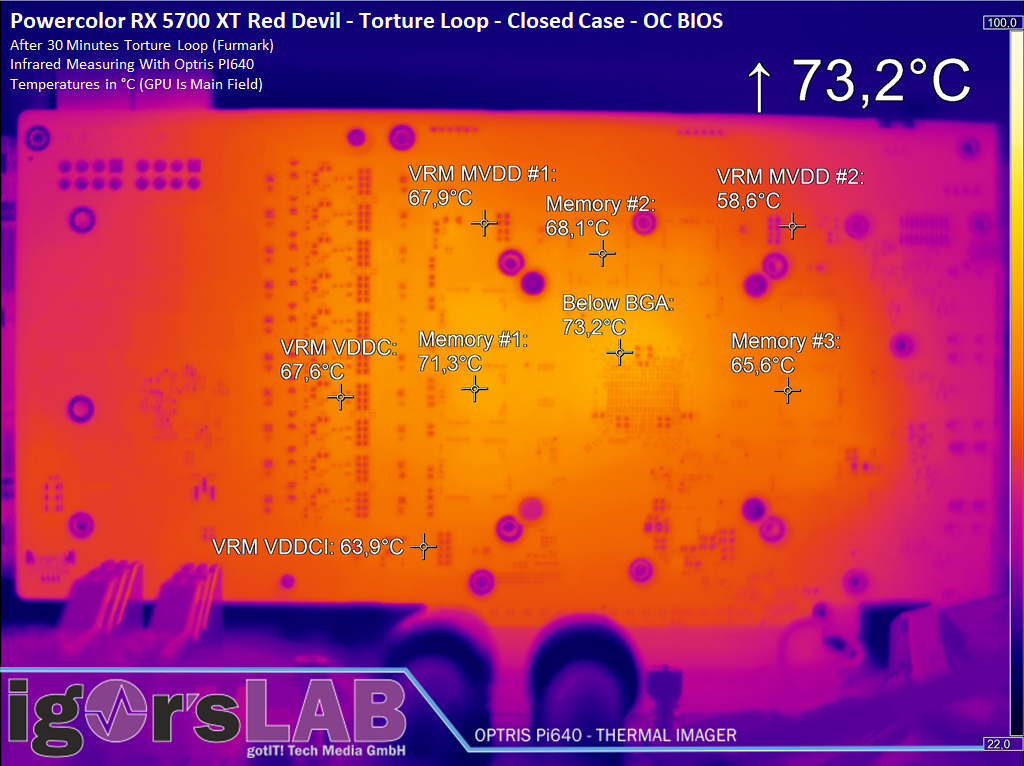
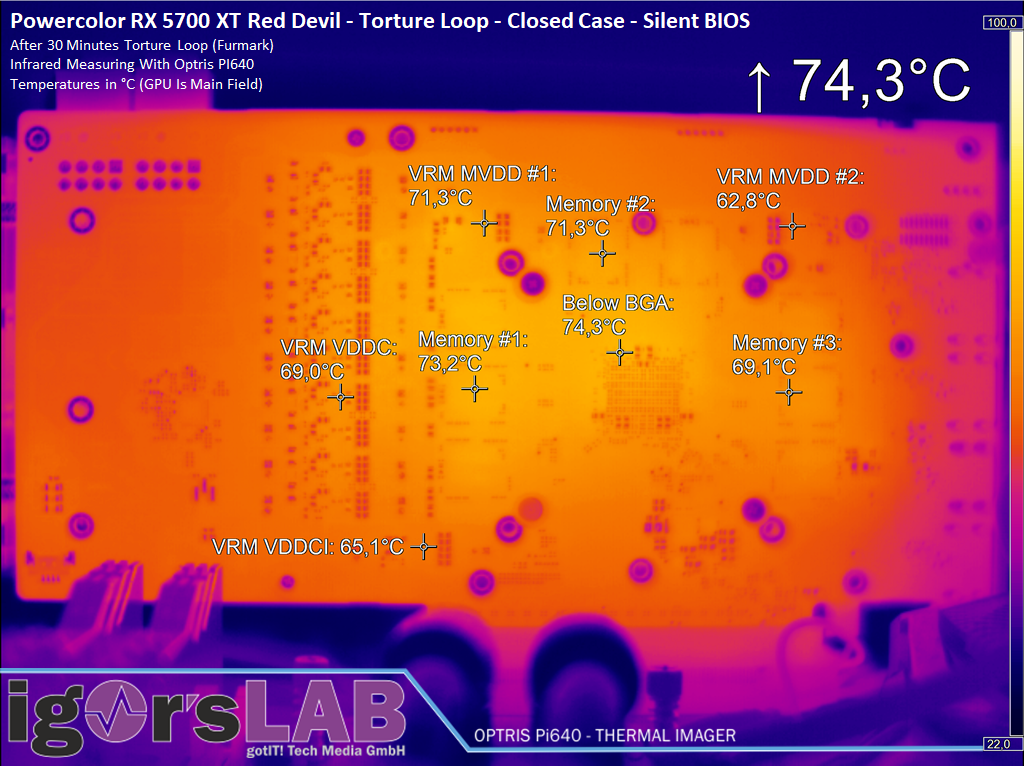
Whether it's OC or Silent BIOS, the cooler cools like a heavy worker and that's a good thing.


Kommentieren