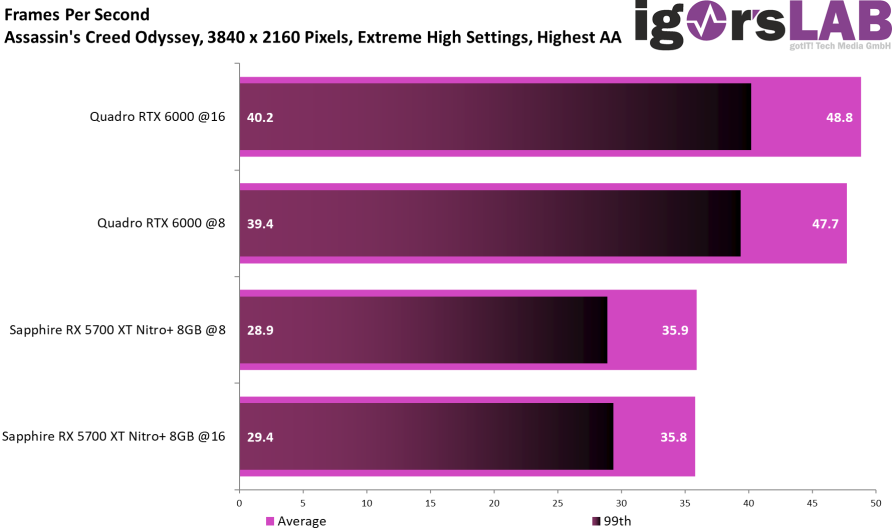
Now I put full load on the cards and activate AA in the maximum level for the first time. The performance loss over PCIe 3.0 @8 with the Quadro RTX 6000 increases reproducibly to 2.3% and leaves the range of possible measurement tolerances again. This is not only measurable, but in some cases even subjectively perceptible again compared to the run with @16. The difference between the two PCIe 4.0 measurements with the Radeon RX 5700XT, however, is virtually zero at 0.1%. The more than 13 FPS advantage of the Quadro RTX 6000 @8 compared to the RX 5700 XT shows once again that the interface is no longer of great importance when the graphics card is fully loaded. The loss with activated AA is about the same for both cards.
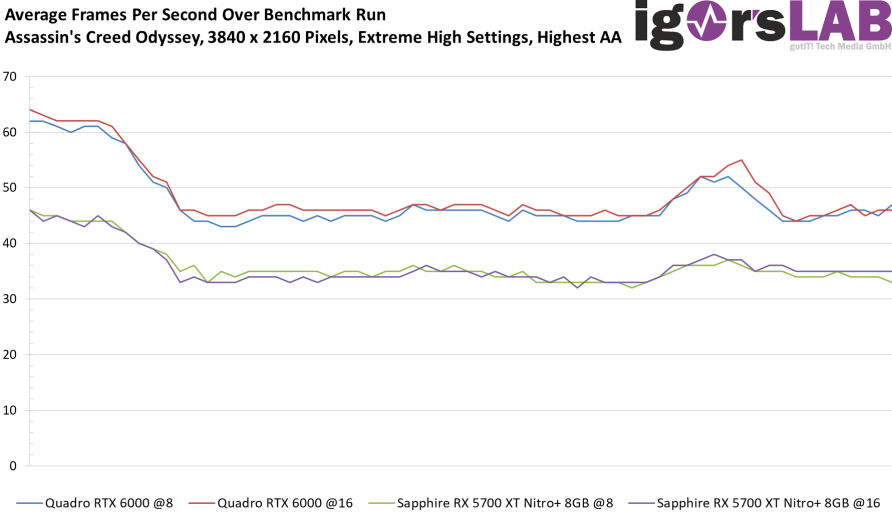
You can see the difference quite well again on the FPS curves:
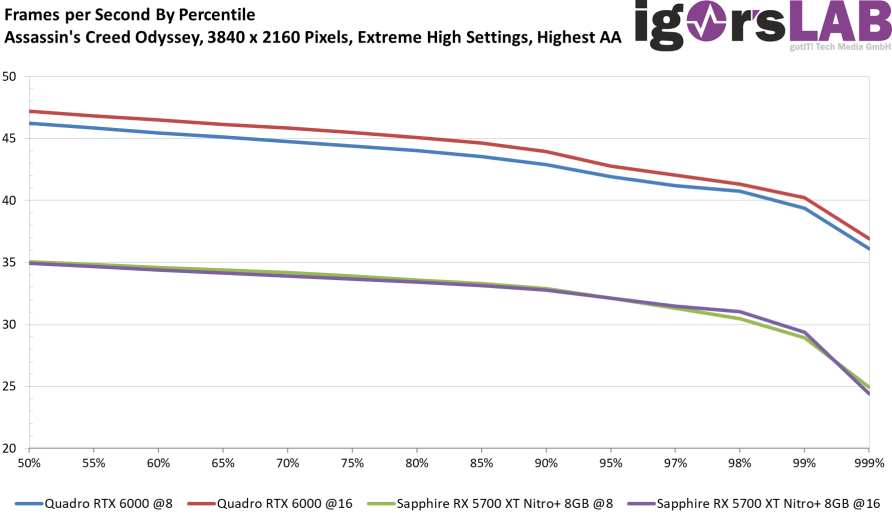
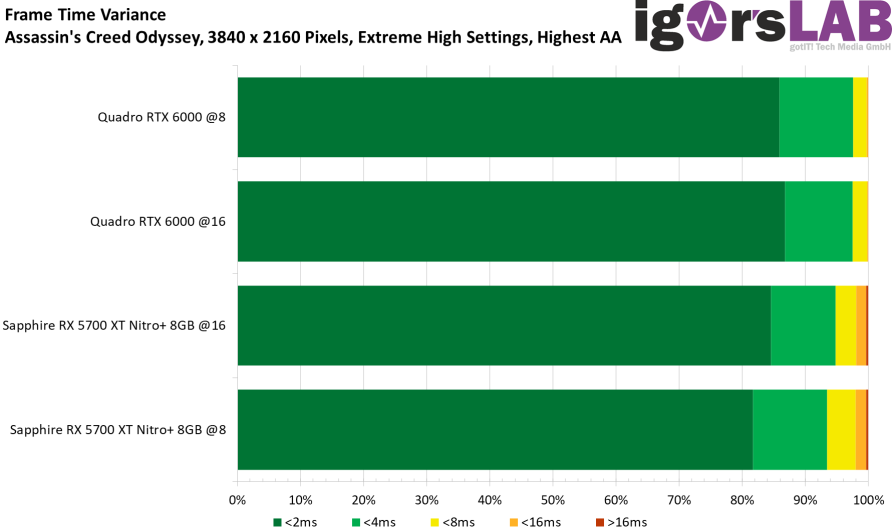
Now let’s take a look at the percentiles, because the 99th percentile is the most important one. Percentile isn’t everything. What you see is flattening of the curves overall, which this time without exception is not as strong as before.
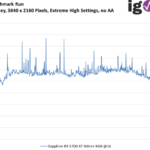
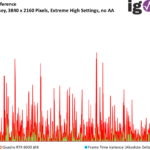
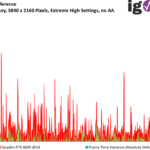
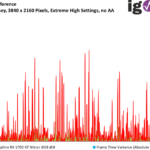
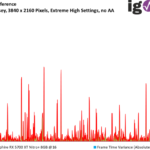
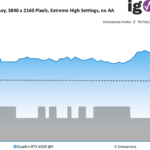
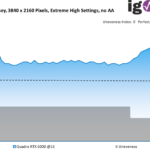
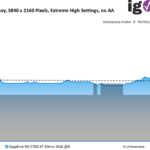
Frame Time shows the advantage of the wider bus on the Quadro RTX 6000. The RX 5700XT performs approximately the same with both connections. Also here I have the whole progressions later as single graphics for each map.
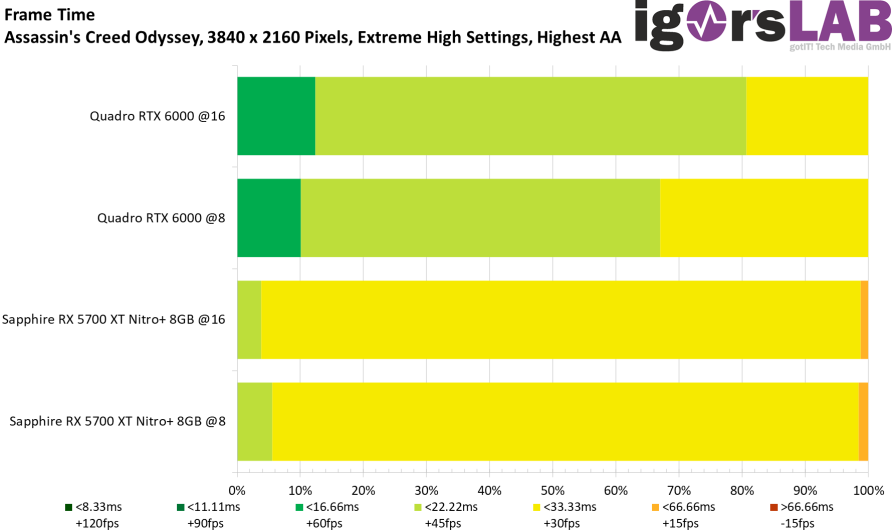
This time, the evaluated variances hardly allow any conclusion as to which bus width is currently in use. A very interesting finding.
Individual graphics for each run as picture gallery
Assassin's Creed Odyssey - Quadro RTX 6000 @8 - FrameTimeSolo - 3840 x 2160 Pixels Extreme High Settings, no AA
Assassin's Creed Odyssey - Quadro RTX 6000 @16 - FrameTimeSolo - 3840 x 2160 Pixels Extreme High Settings, no AA
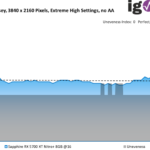
Assassin's Creed Odyssey - Sapphire RX 5700 XT Nitro+ 8GB @8 - FrameTimeSolo - 3840 x 2160 Pixels Extreme High Settings, no AA
Assassin's Creed Odyssey - Sapphire RX 5700 XT Nitro+ 8GB @16 - FrameTimeSolo - 3840 x 2160 Pixels Extreme High Settings, no AA
Assassin's Creed Odyssey - Quadro RTX 6000 @8 - FPSvsFrameTimeDiff - 3840 x 2160 Pixels Extreme High Settings, no AA
Assassin's Creed Odyssey - Quadro RTX 6000 @16 - FPSvsFrameTimeDiff - 3840 x 2160 Pixels Extreme High Settings, no AA
Assassin's Creed Odyssey - Sapphire RX 5700 XT Nitro+ 8GB @8 - FPSvsFrameTimeDiff - 3840 x 2160 Pixels Extreme High Settings, no AA
Assassin's Creed Odyssey - Sapphire RX 5700 XT Nitro+ 8GB @16 - FPSvsFrameTimeDiff - 3840 x 2160 Pixels Extreme High Settings, no AA
Assassin's Creed Odyssey - Quadro RTX 6000 @8 - Unevenness - 3840 x 2160 Pixels Extreme High Settings, no AA
Assassin's Creed Odyssey - Quadro RTX 6000 @16 - Unevenness - 3840 x 2160 Pixels Extreme High Settings, no AA
Assassin's Creed Odyssey - Sapphire RX 5700 XT Nitro+ 8GB @8 - Unevenness - 3840 x 2160 Pixels Extreme High Settings, no AA
Assassin's Creed Odyssey - Sapphire RX 5700 XT Nitro+ 8GB @16 - Unevenness - 3840 x 2160 Pixels Extreme High Settings, no AA


Kommentieren