


Test system and test preparation
I use the usual suspects like CrystalDiskMark and Atto to check the theoretical information from the specs. However, I do not make it easy even for these programs, because the SSDs were written to several times with about 66% of the storage space. Thus, these are not brand-new SSDs, but rather everyday goods that have already been worn down. Let’s see what remains of the theory in everyday life after the wear and tear. The SSDs under test are located in the second NVMe slot of the motherboard and are not used as a system disk.
In addition, I use AJA as an everyday test to simulate the encoding of larger Ultra HD video streams and the storage test of SPECwpc, which contains a lot of real applications and it will be interesting to see what performance is left for the large workloads. However, I picked out the applications with the biggest differences and loads as examples here. The whole thing runs on my current small workstation with the Ryzen 9 5950X and the MSI MEG X570 Godlike along with 32 GB DDR4 3800.
I have also summarized the individual components of the test system in a table:
| Test System and Equipment |
|
|---|---|
| Hardware: |
AMD Ryzen 9 5950X |
| Cooling: |
Alphacool Ice Block XPX Pro Alphacool Ice Wolf (modified) |
| Case: |
Raijintek Paean |
| Monitor: | BenQ PD3220U |
| Thermal Imager: |
1x Optris PI640 + 2x Xi400 Thermal Imagers Pix Connect Software Type K Class 1 thermal sensors (up to 4 channels) |
| OS: | Windows 11 Pro (all updates, current certified drivers) |
Sequential performance of the used SSDs
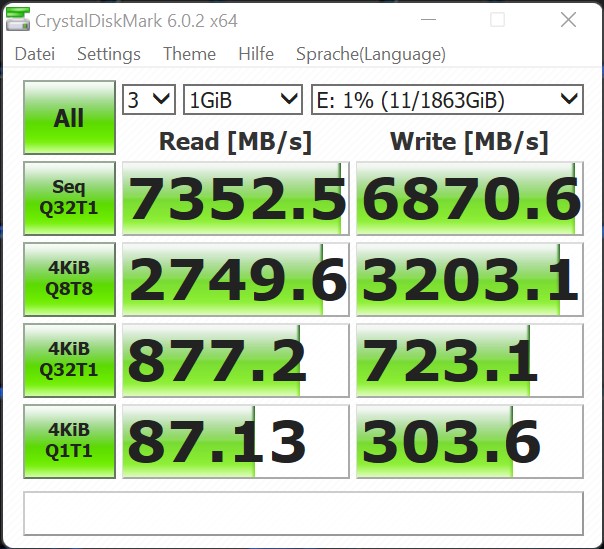
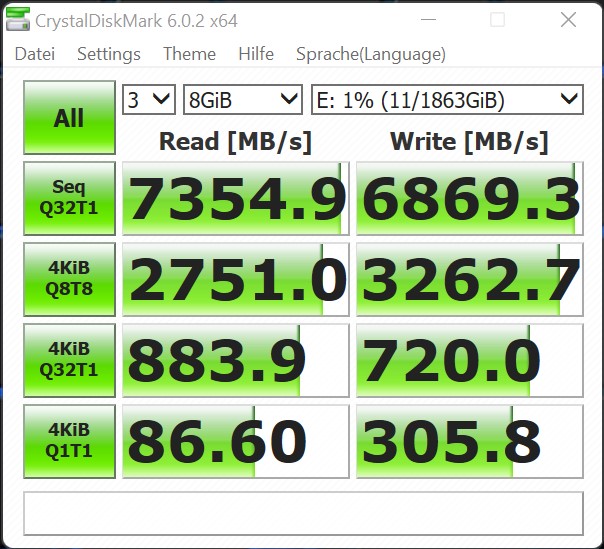
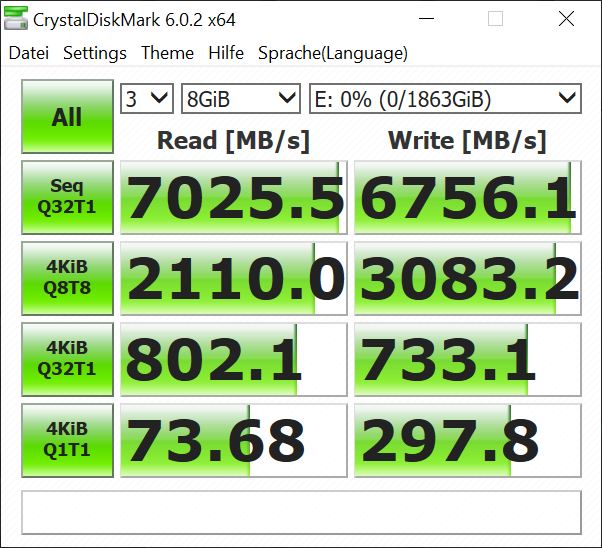
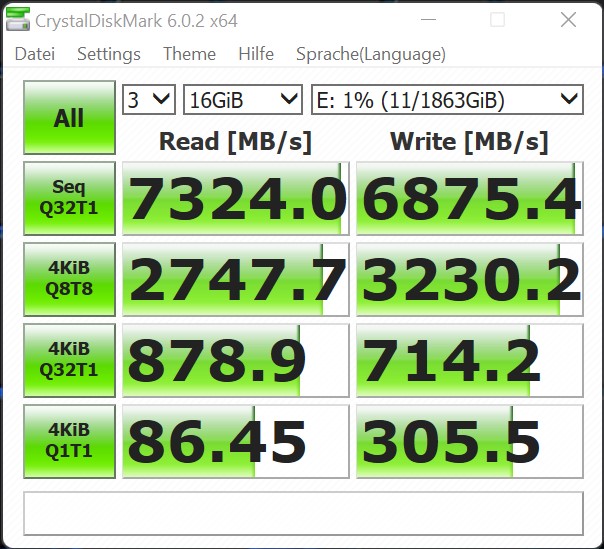
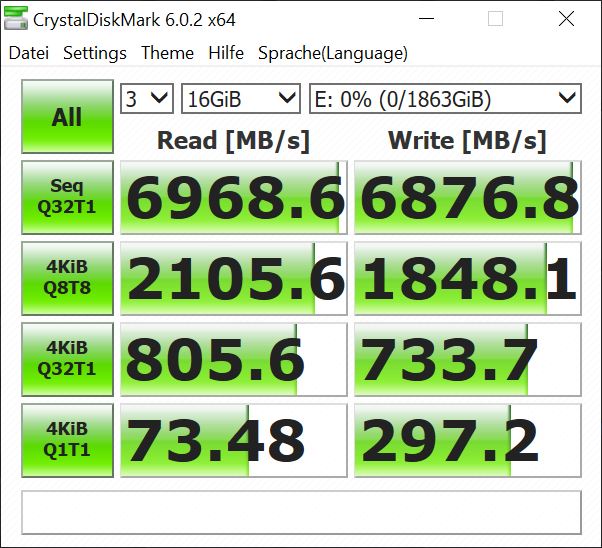
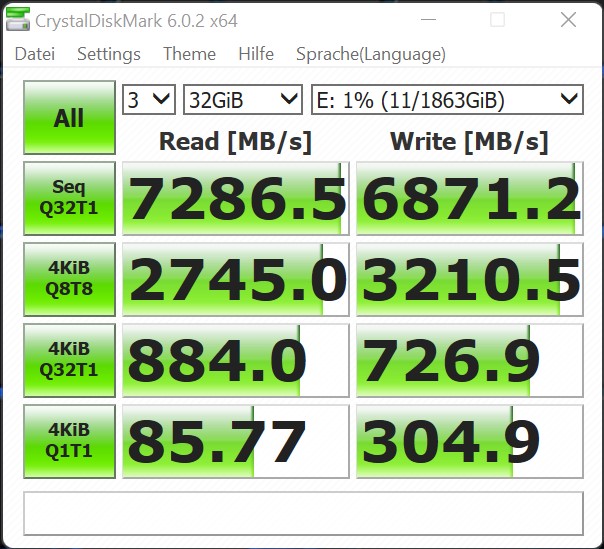
Synthetics are a great way to really break out the big numbers once in a while. We will see later how well this works in reality with the real application benchmarks. Therefore, I start with the CrystalDiskMark and four different file sizes. The SSDs were no longer new at the time of the test (I always do these tests at the end for certain reasons) and I also had fill levels of plenty of 50% before deleting the data several times. This certainly also explains why we are a bit short of the maximum values, but can still show impressive figures. That is certainly why the wording with the “up to”.
Let’s first look at the new MSI SPATIUM M480 2TB Play
| MSI SPATIUM M480 2 TB NVMe PLAY | MSI SPATIUM M480 2 TB NVMe |
 |
 |
 |
 |
 |
 |
 |
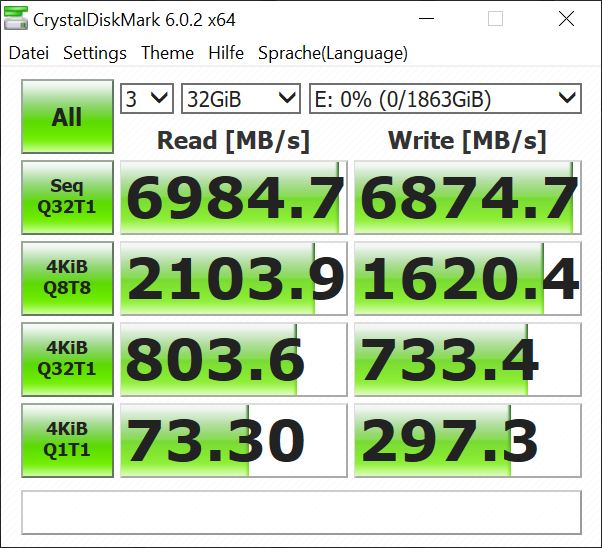 |
You can see very well that the dynamic pSLC does exactly what it is supposed to, mind you with an empty (though not virgin) SSD. The nice thing about the 2 TB SSD is that there is a lot of space left and you should therefore never fill it more than 2/3 with data. A higher load does not affect reading, but the dynamic SLC will certainly reach its limits at some point during writing. And if you do it over and over again, switching the memory modules between the two methods will also eventually become impossible.
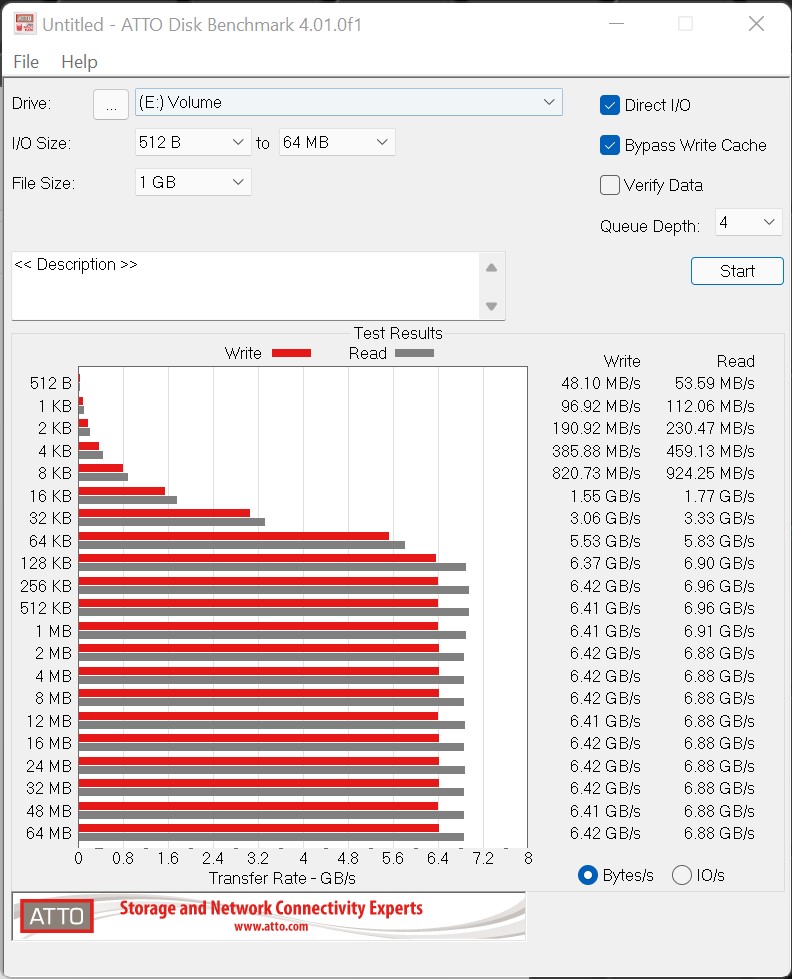
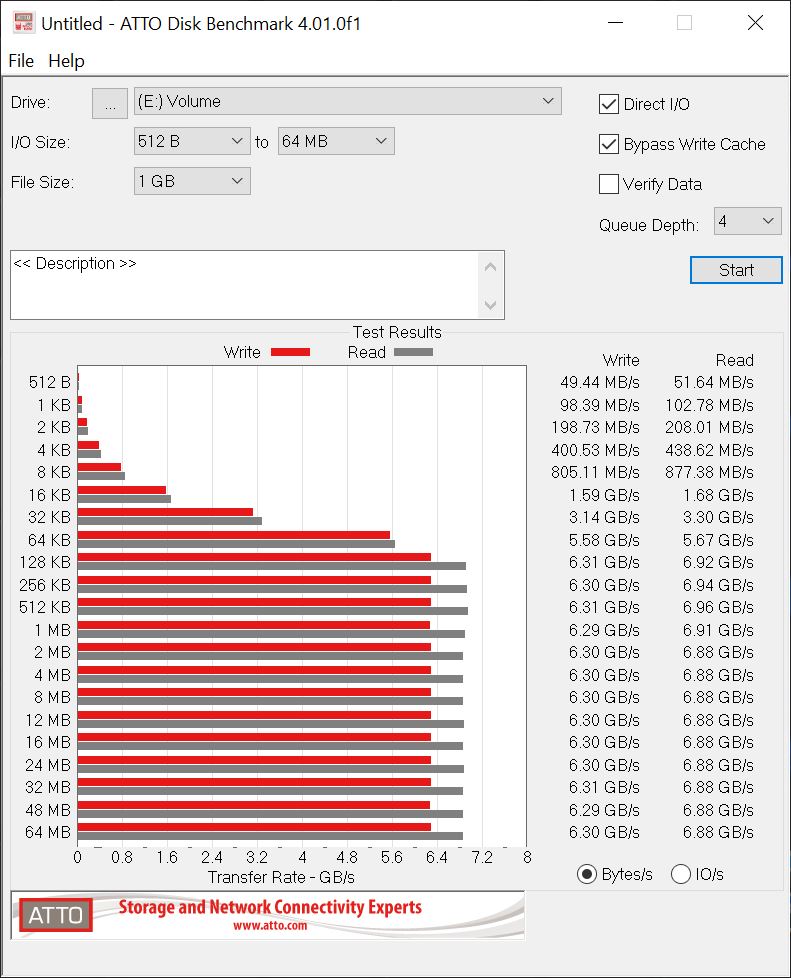
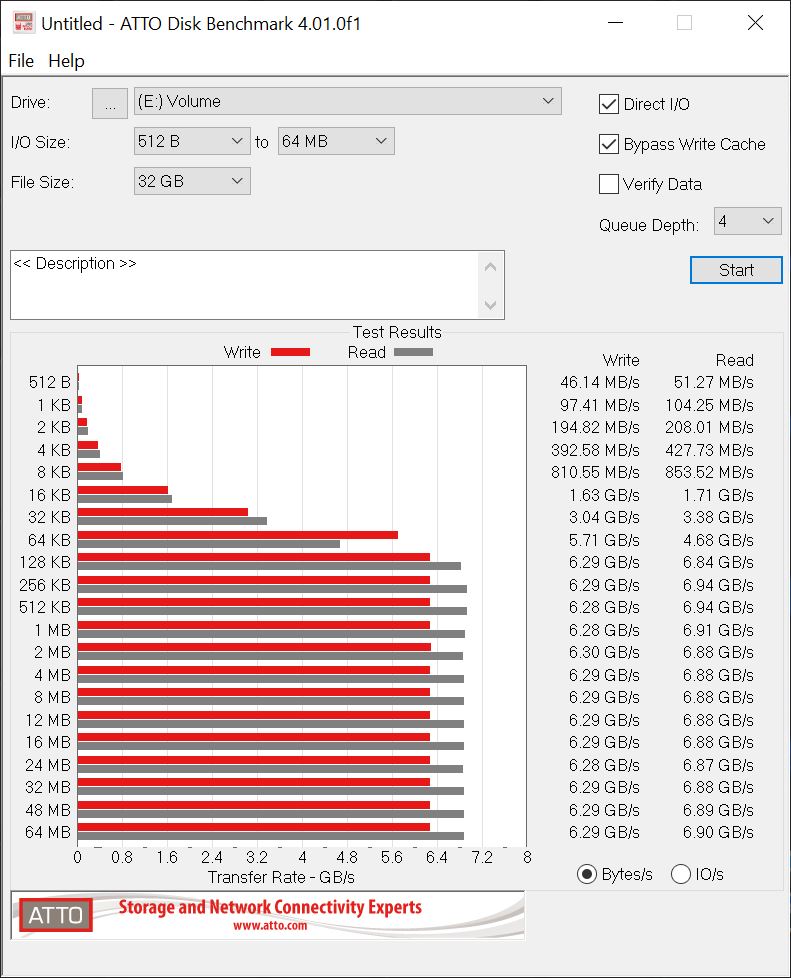
ATTO also works very similarly, although I only work with two sizes here, which ends up being the same. You only just miss the limit of 7000 MB/s, but it is still enough for an impressive result.
| MSI SPATIUM M480 2 TB NVMe PLAY | MSI SPATIUM M480 2 TB NVMe |
 |
 |
 |
 |
But what happens when you stream a video? For this purpose, the industry uses the AJA benchmark, which is in effect an interface between synthetic benchmarks and practical application. The Spatium M480 Play does not fluff here either, although it already deviates a bit from the theoretical write and read rates. Let’s first look at the writing process of the encoded video content and then compare the whole thing in the table with the predecessor:
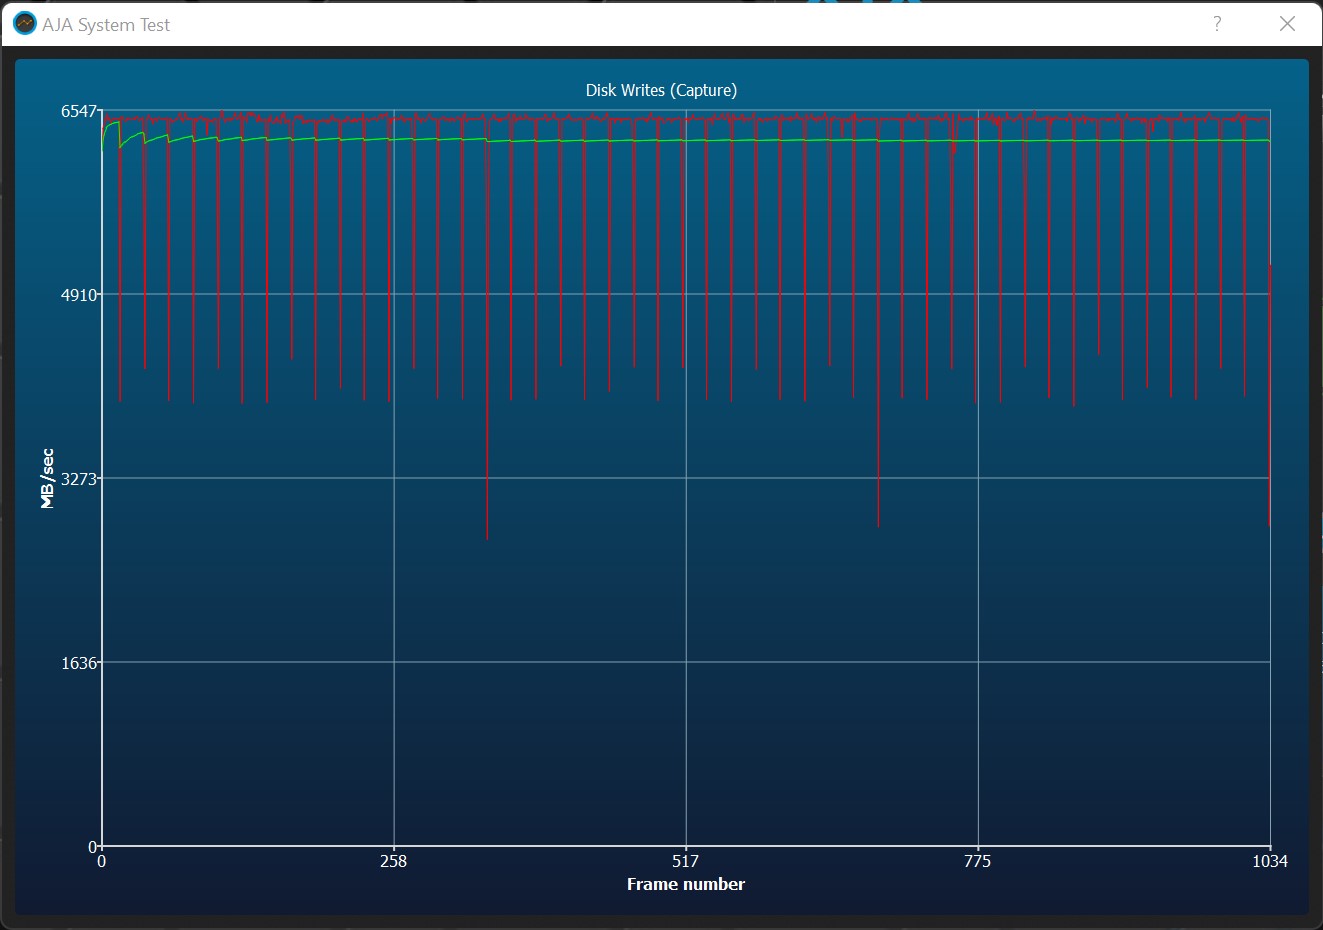
The older SSD at least leads in the minimum rate, but remains a tad slower in both the peak performance and the average.
| MSI SPATIUM M480 2 TB NVMe PLAY | MSI SPATIUM M480 2 TB NVMe |
|
| Resolution: | 4K RED HD | |
| File Size: | 64 GB | |
| Codec : | 16bit RGBA | |
| Video file: | Movie | |
| Number of frames | 1035 | |
| Write rate | 98 frames/second | 98 frames/second |
| Write rate | 6271 MB/second | 6206 MB/second |
| Minimum rate | 2730 MB/Sec | 3188 MB/Sec |
| Maximum rate | 6547 MB/Sec | 6447 MB/Sec |
Reading is also quite fast, although you don’t reach the theoretically possible speed here either. But almost. And the new Play variant is superior to the older SSD in all aspects:
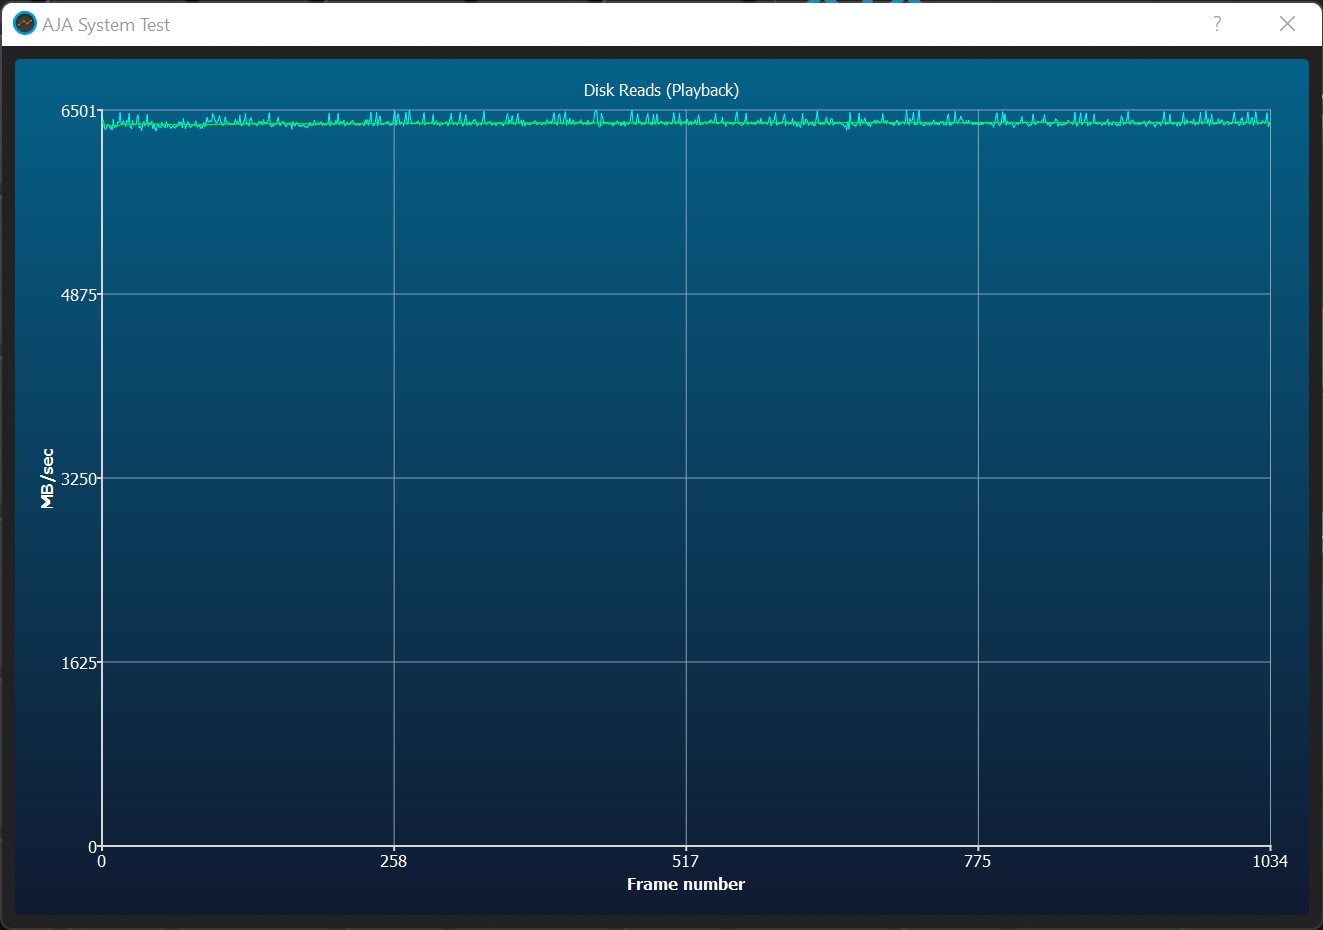
| MSI SPATIUM M480 2 TB NVMe PLAY | MSI SPATIUM M480 2 TB NVMe PLAY | |
| Number of frames | 1035 | |
| Write rate | 100 frames/second | 97 frames/second |
| Write rate | 6390 MB/second | 6185 MB/second |
| Minimum rate | 6319 MB/Sec | 5987 MB/Sec |
| Maximum rate | 6501 MB/Sec | 6317 MB/Sec |
We see that the comments made on the previous page about the dynamic pSLC cache and the behavior with the larger file blocks are completely true. Smaller file movements would be even faster if you leave out the overhead of the file system.


24 Antworten
Kommentar
Lade neue Kommentare
Urgestein
Urgestein
Urgestein
Moderator
Urgestein
Urgestein
Mitglied
Urgestein
Urgestein
Mitglied
Urgestein
Mitglied
Mitglied
Mitglied
Urgestein
Mitglied
Urgestein
Urgestein
Mitglied
Alle Kommentare lesen unter igor´sLAB Community →