


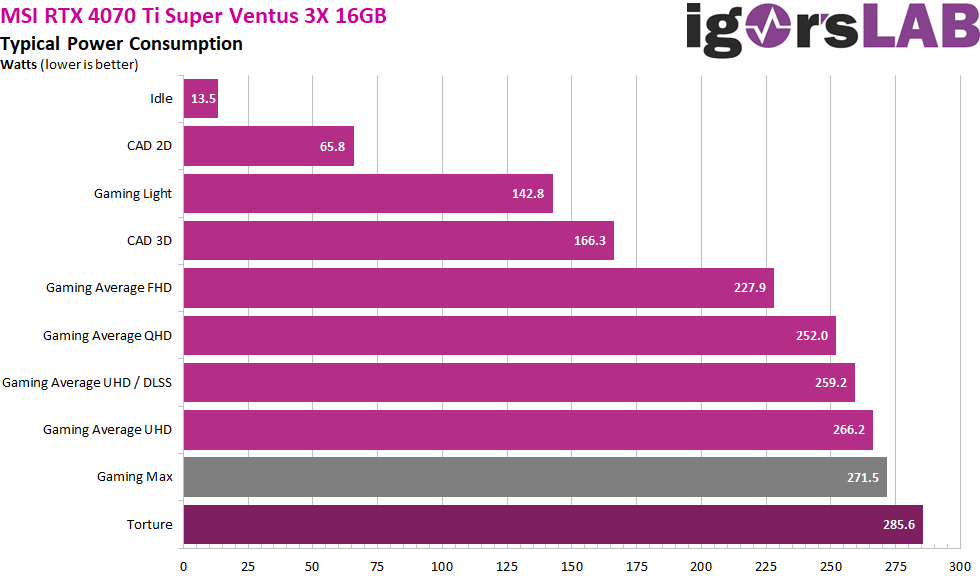
Power consumption in factory settings as a summary
The almost 14 watts in idle mode (12 and 3.3 volts) are ok. With a second monitor and a different resolution, however, this quickly becomes 38 watts and more. Incidentally, we can see very clearly that the full TBP of 285 watts is rarely exhausted and only the torture loop or a single game exceeds the limit or even reaches it at all. Normally, it is always less.
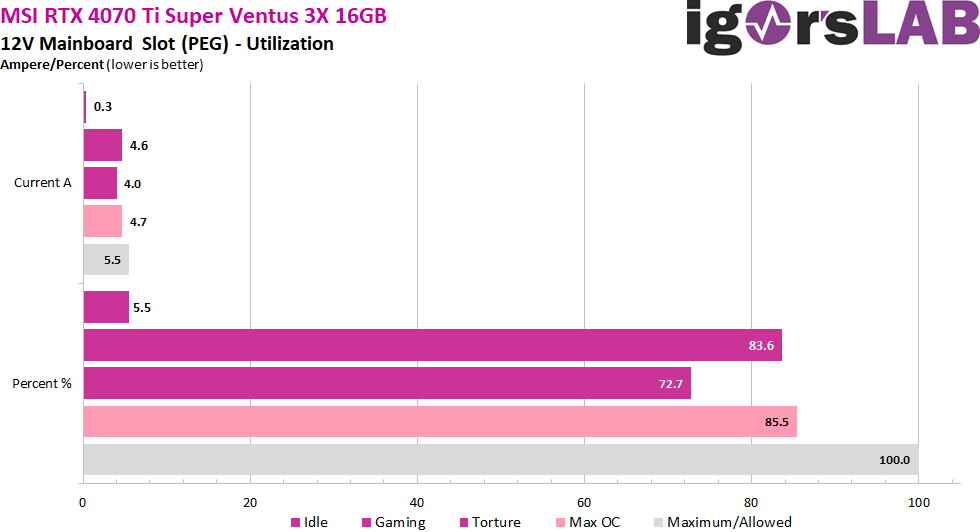
Load distribution between the PCIe slot and the PCIe sockets
The card uses the PCIe slot quite heavily, especially when gaming. However, the flowing currents are at least reasonably below the maximum permitted 5.5 amperes.

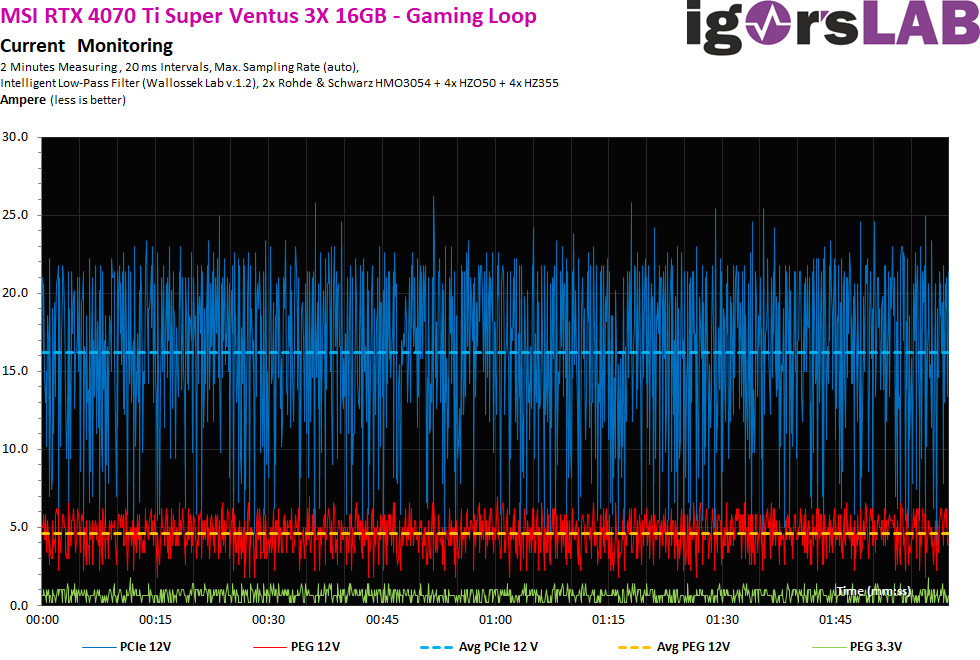
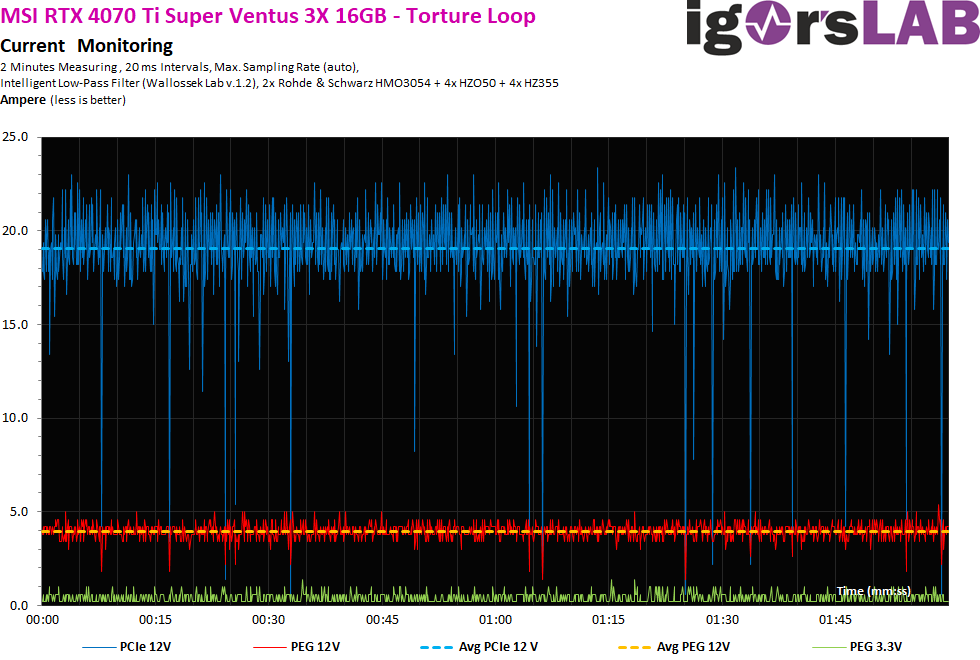
Rough 20 ms intervals
Let’s first take a look at the flowing currents. Measurements were taken at rough 20 ms intervals, i.e. around 50 times per second, in order to simulate the load on the supervisor chip of the power supply units (switch-off). We can see that even short load peaks are capped at 27 A at the latest, but a real limitation looks different. This is not a small amount and also something that shows us the control frenzy of Boost.
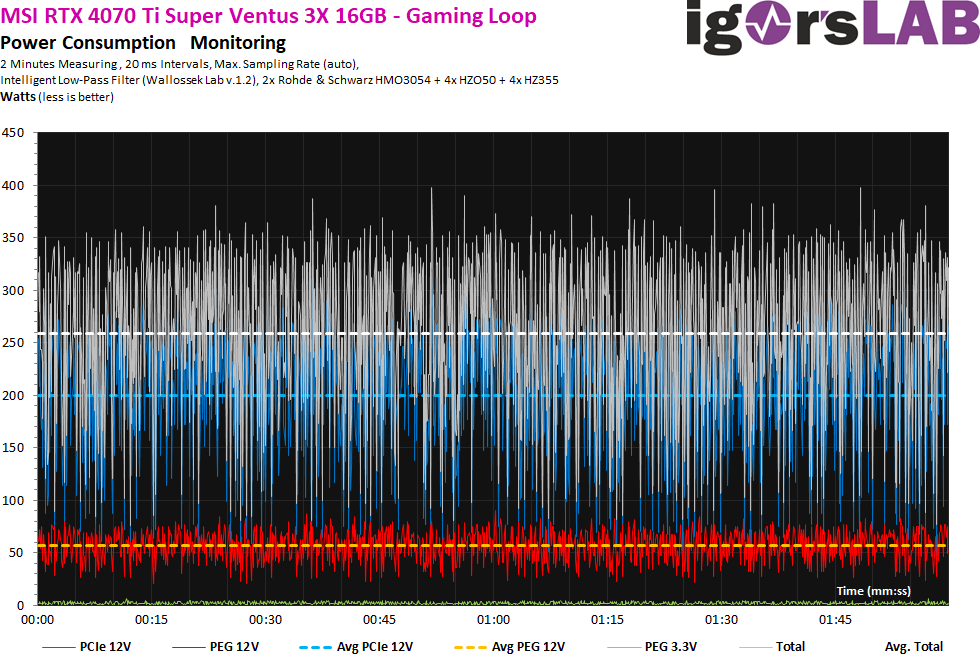
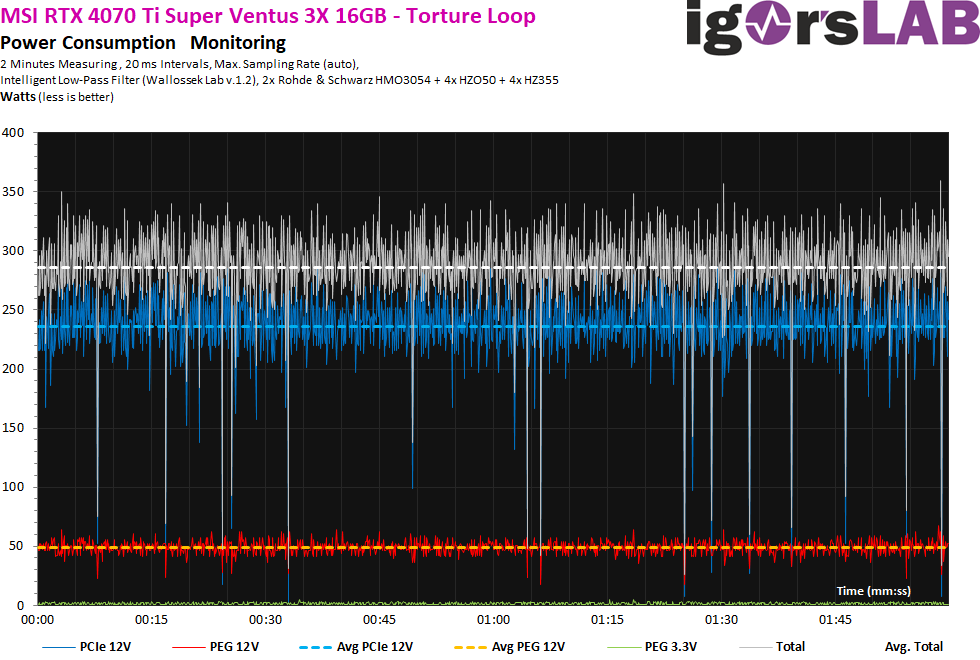
Nevertheless, we still need to take a look at the voltages, or the product of voltage and current flow. I have already written that I have measured different power supply connections here, even if all connections meet again somehow on the graphics card board. What we can now see here as much clearer fluctuations and peaks is due to the partially slightly overvoltage power supply and therefore to the voltage and not the currents. This is due to technical reasons, but is not a problem. However, we can also see that the few peaks at just under or slightly over 400 watts are not solely due to the flowing current (graphics card), but are actually the result of the power supply! This is also due to the topology and, above all, the rather puny input filter with only one coil per rail.
The Torture test is hardly any different. The super variant now regulates somewhat more hectically.
If you now add the voltage again, you can see a stronger ripple, which in turn results from the somewhat jittery operating voltage. However, to the power supply’s credit, it must also be said that this affects all current products from all manufacturers and can hardly be avoided.
- 1 - Introduction, technical data and technology
- 2 - Test system and measuring equipment
- 3 - Teardown: PCB, components and cooler
- 4 - Teardown: material analysis
- 5 - Gaming Performance FHD (1920 x 1080)
- 6 - Gaming-Performance WQHD (2560 x 1440)
- 7 - Gaming Performance Ultra-HD (3840 x 2160)
- 8 - Gaming Performance DLSS vs. FSR
- 9 - Gaming performance with Frame Generation
- 10 - Latencies
- 11 - Workstation graphics and rendering
- 12 - Details: Power consumption and load distribution
- 13 - Load peaks, capping and power supply recommendation
- 14 - Temperatures, clock rates and infrared analysis
- 15 - Fan curves and noise level
- 16 - Summary and conclusion


91 Antworten
Kommentar
Lade neue Kommentare
Veteran
1
Urgestein
Mitglied
1
1
Urgestein
Urgestein
Veteran
Urgestein
Veteran
Urgestein
1
Mitglied
Urgestein
1
Alle Kommentare lesen unter igor´sLAB Community →