


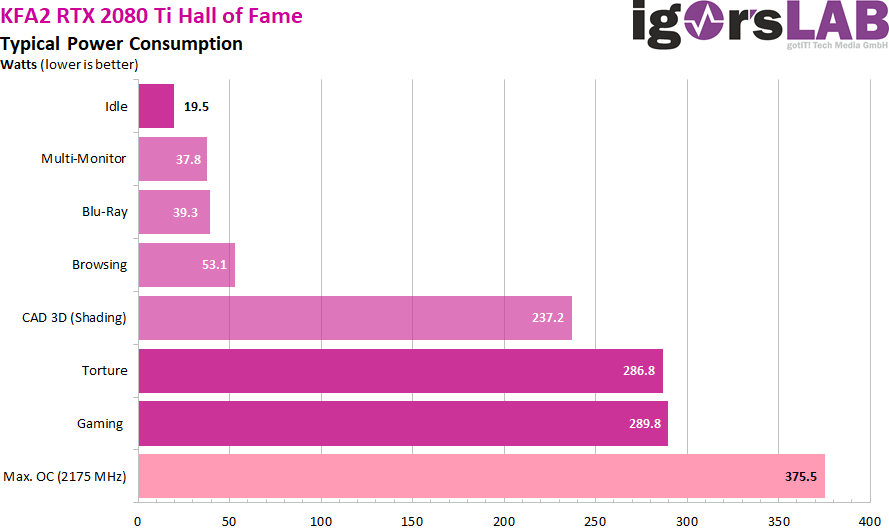
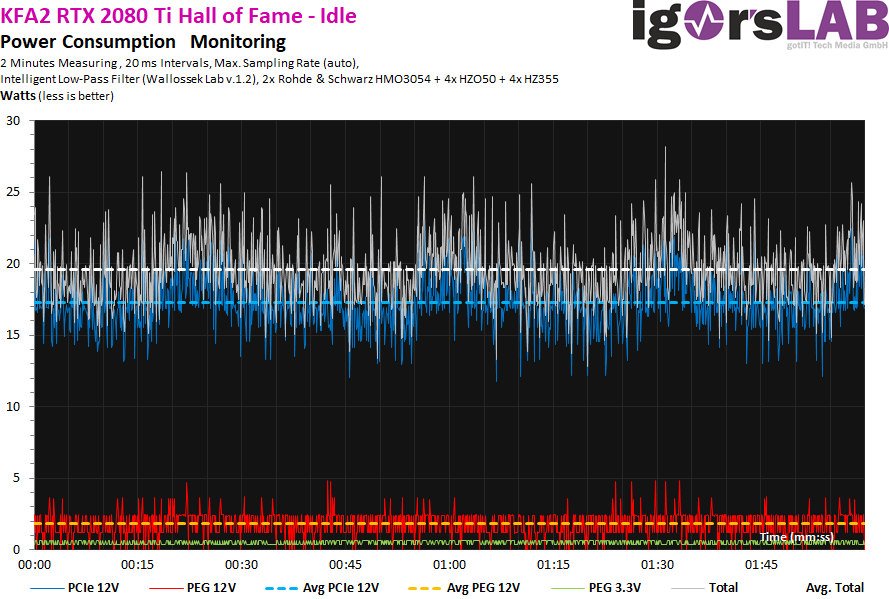
Power consumption and loads
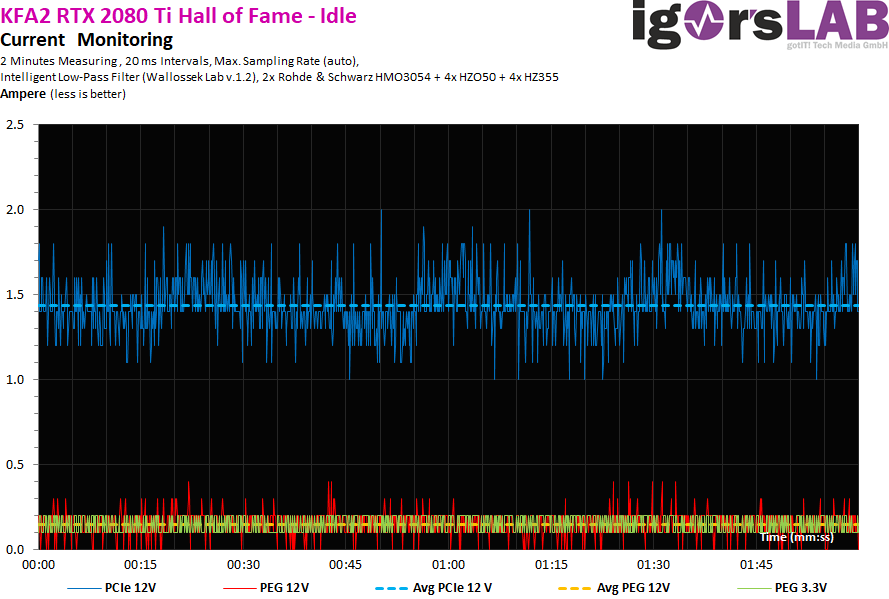
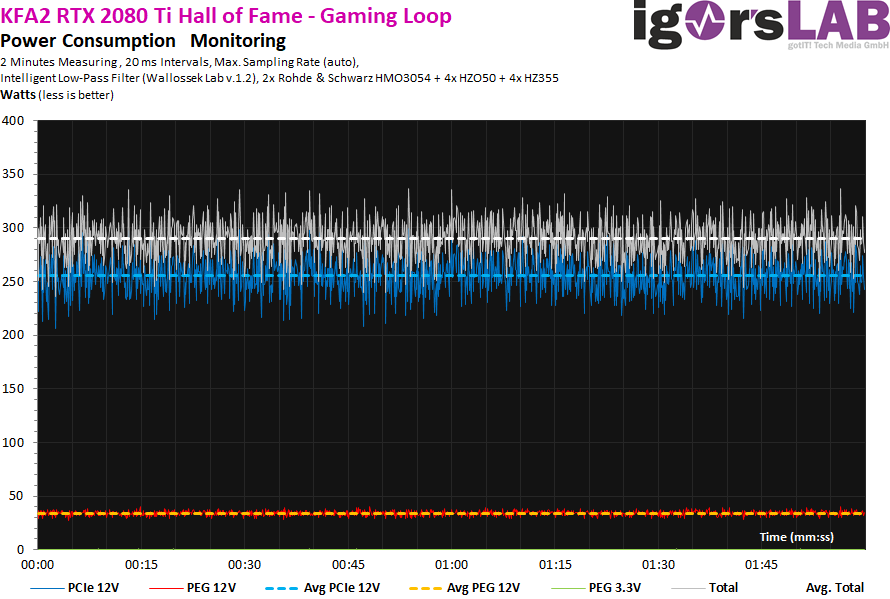
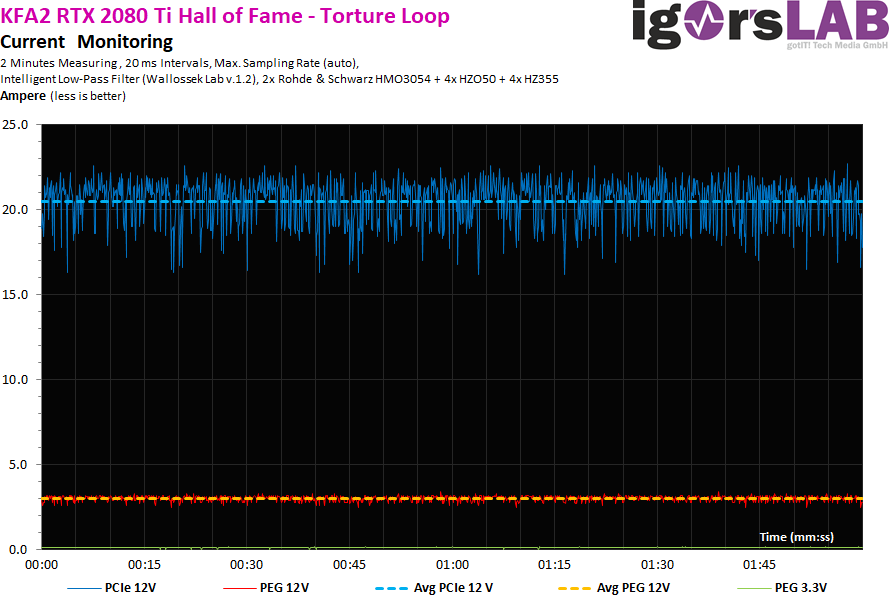
The power consumption of this card is with almost 20 watts in the idle clearly above the usual, but the blame should be found here with the OLED display including the ARM controller and the LED. For the gaming loop with just under 290 watts and in the Torture loop with just under 287 watts, the map is even below the set power target of 300 watts. The maximum power limit of 450 watts is also significantly undercut at just under 378 watts, which suggests a very high chip quality.
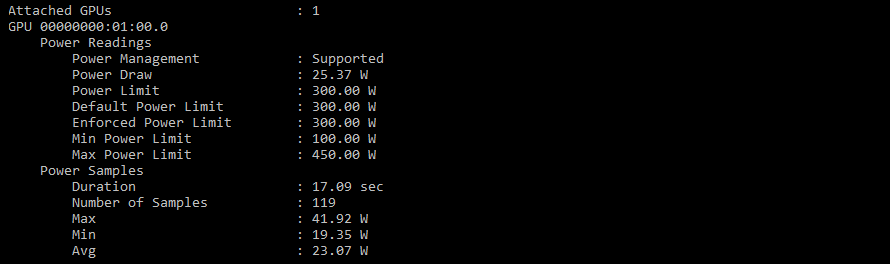
Here is also a short excerpt from what KFA2 actually gave this card in the firmware of limits:
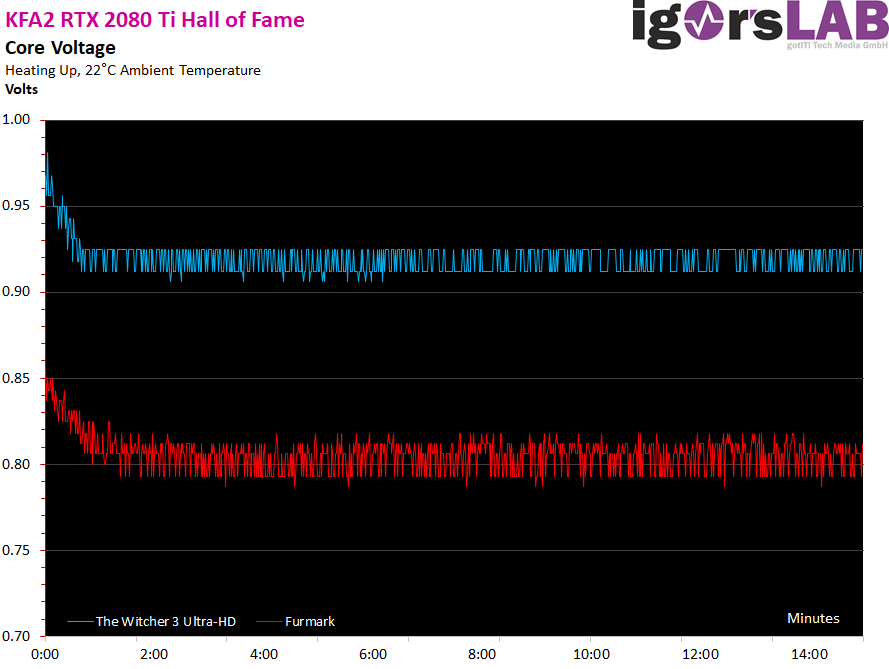
The voltages are very low ex works, another indicator of good chip quality. This proves once again why with 40 watts less you can actually achieve the same performance as with the MSI Lightning Z.
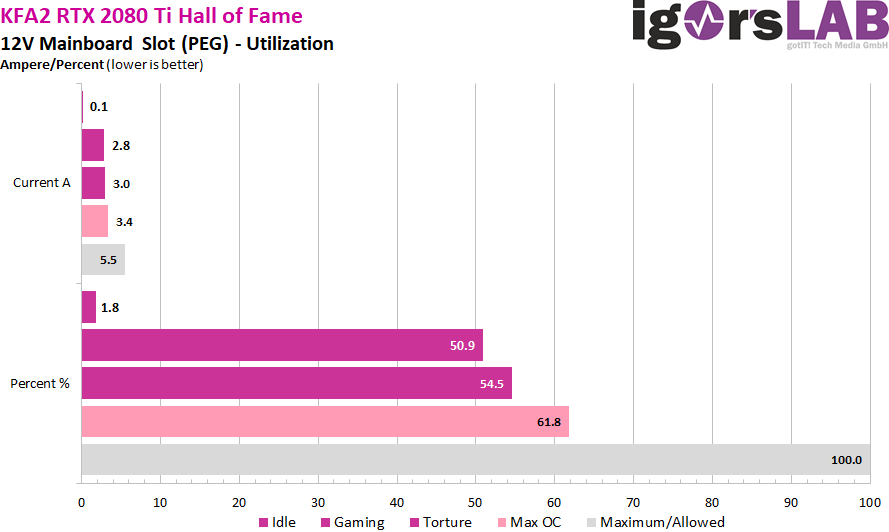
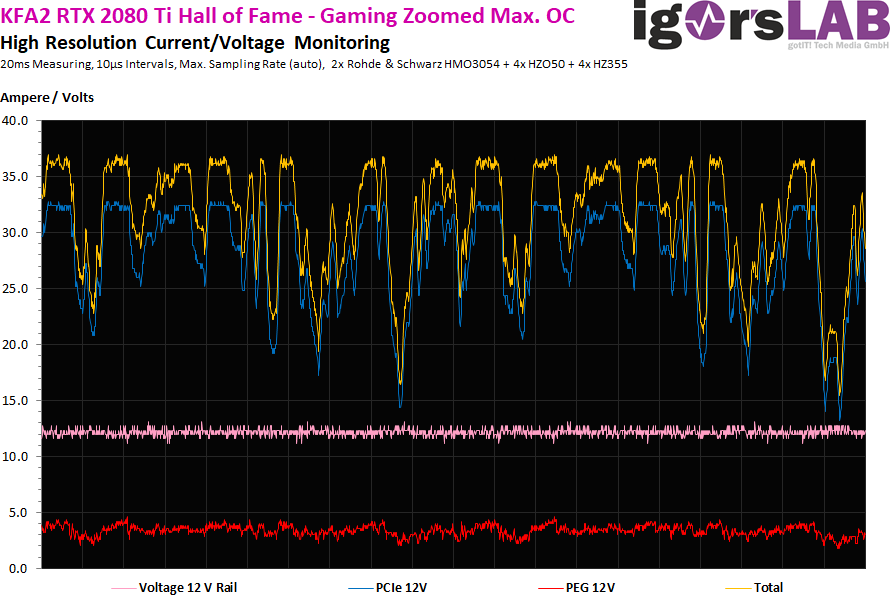
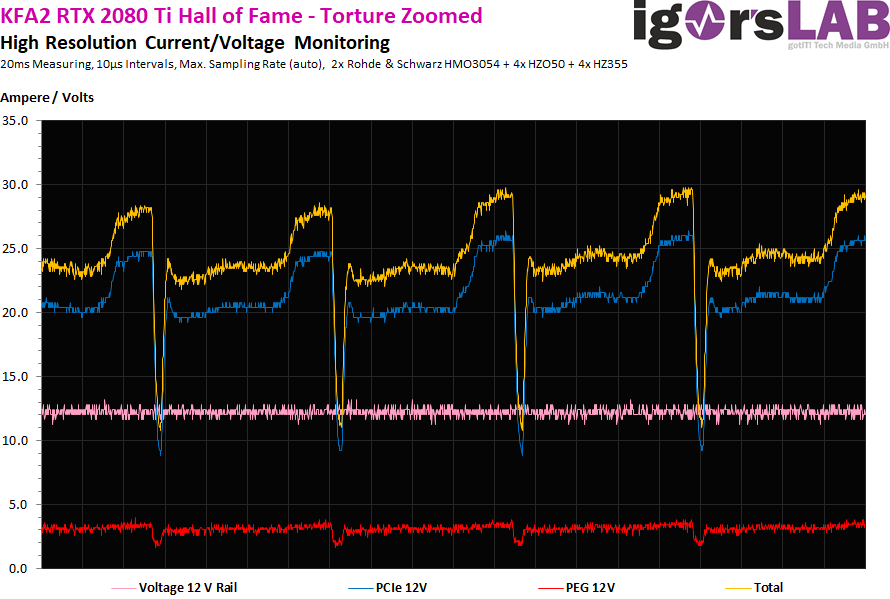
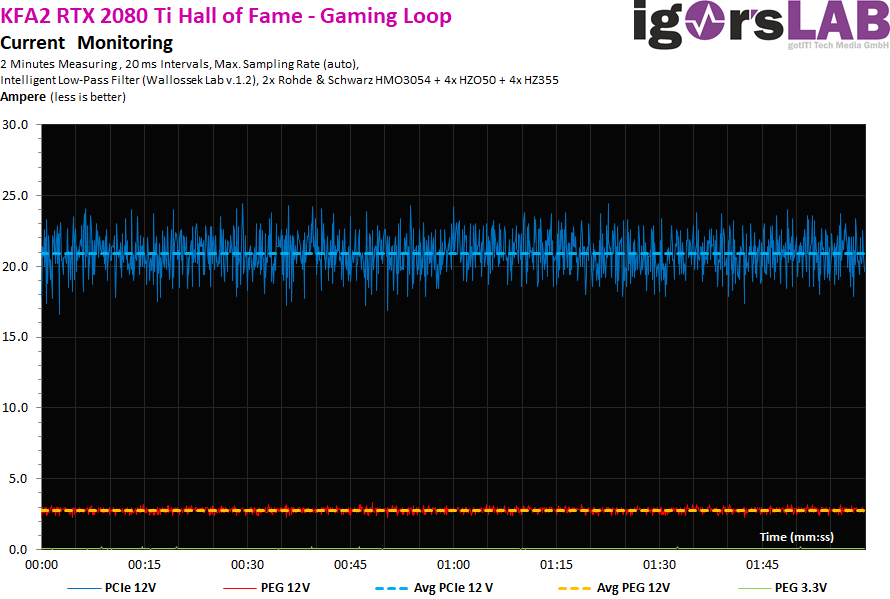
The load distribution on the rails is interesting, because the maximum 5.5 amperes of the motherboard slot are never exceeded. We also see very nicely the load distribution on the rails, whereby the chosen balancing should not stand in the way of the extreme OC.
Power supply design and peak loads/currents
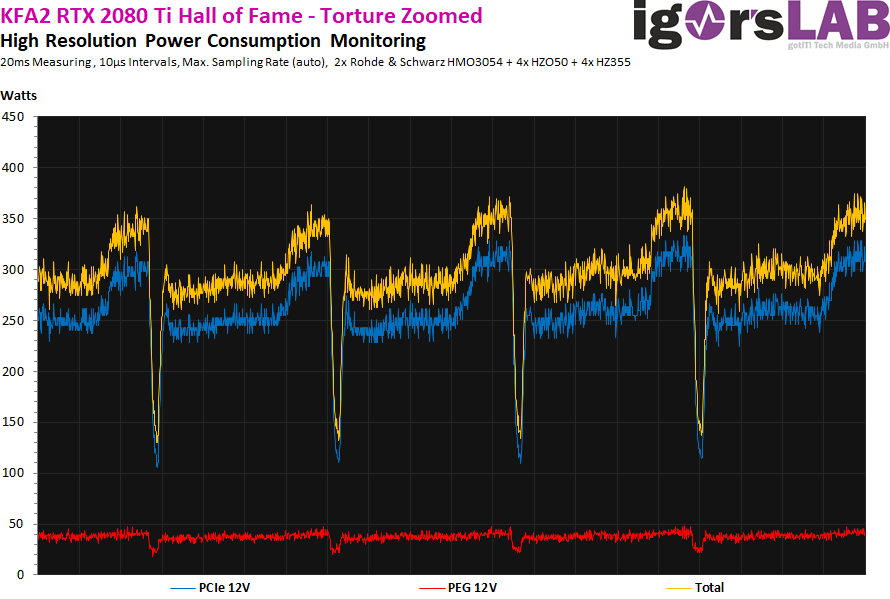
As I have already demonstrated in detail in my basic article "The fight of graphics card against power supply – power consumption and load peaks demystified", there are also temporarily higher loads in the millisecond range, which are unfavorable in case of unfavorable designed or improperly equipped power supplies can already lead to unexplained shutdowns. The TBP (Typical Board Power) measured by the graphics card manufacturer or the reviewers does not really help for a stable design of the system.
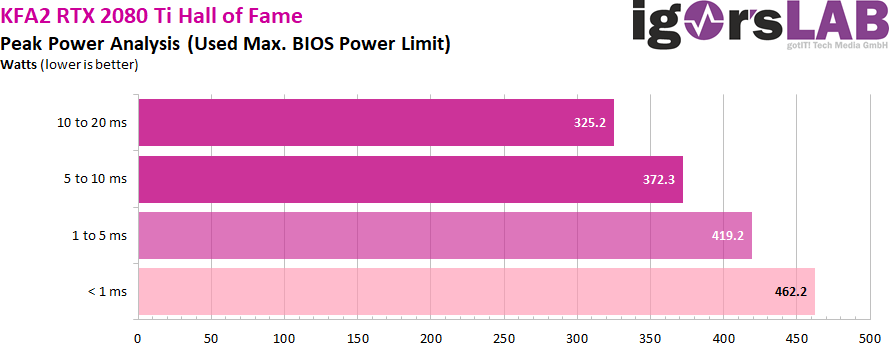
Peaks with intervals between 1 and 10 ms can lead to shutdowns with very fast-reacting protective circuits (OPP, OCP), especially for multi-rail power supplies, although the average power consumption is still in the norm. For this card/ I would therefore calculate with the normal OC with more than 400 watts, with voltage increase then with a maximum of 500 watts, in order to have enough reserves in case of cases. A short excerpt with high resolution now shows us the 20 ms measurements (10 S intervals), how I run them automatically for valuation:
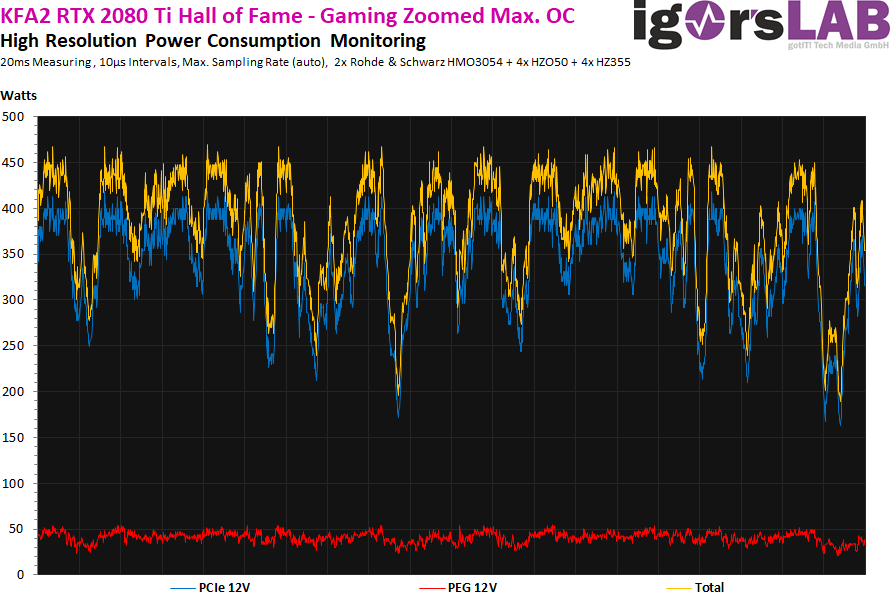
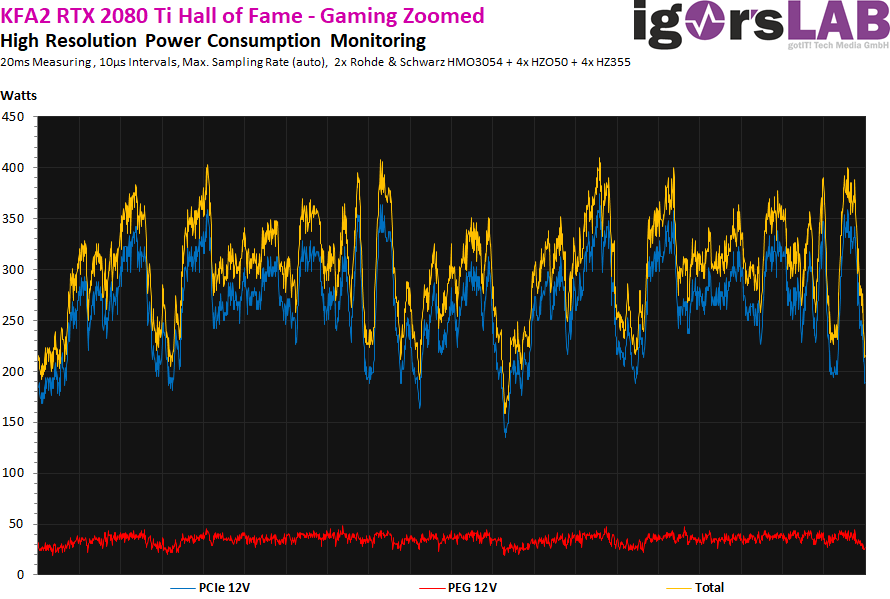
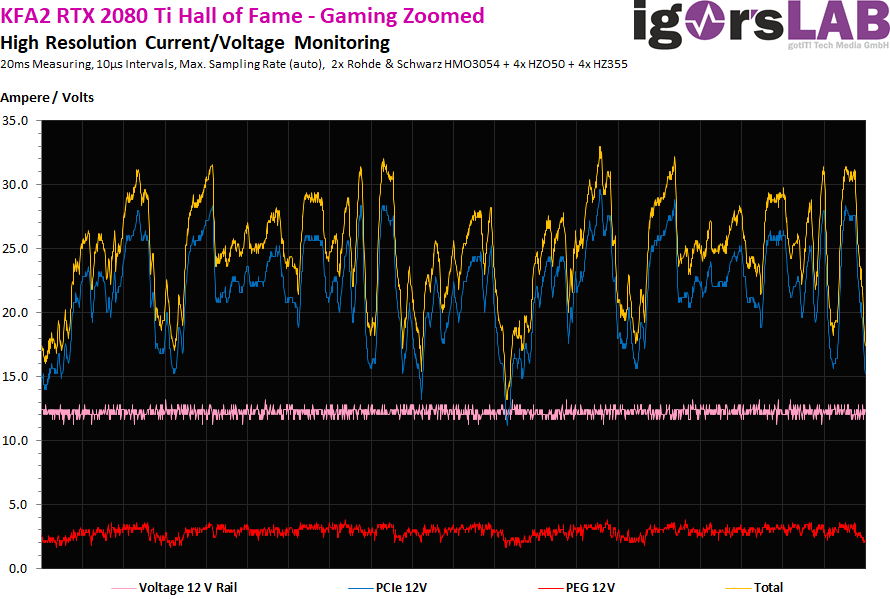
Detailed recording of average power consumption and flowing currents
As usual, I now also set aside the power consumption and the flowing currents as detailed graphics of my oscillograph measurements. A service that hardly anyone else offers and which shows how the maps "tick" in detail:


Kommentieren