


We already know since my launch article “Intel Core i9-11900K, Core i7-11700K, Core i5-11600K and Core i9-10900K against Zen3 – Last man standing in silicon” that Intel’s 11th generation doesn’t act particularly squeamish at the power supply. But also not detailed enough, because there was one thing I couldn’t measure in the short time: the interactions between CPU/motherboard and power supply in the short load peak range, which couldn’t be more insidious in terms of sudden system shutdowns!
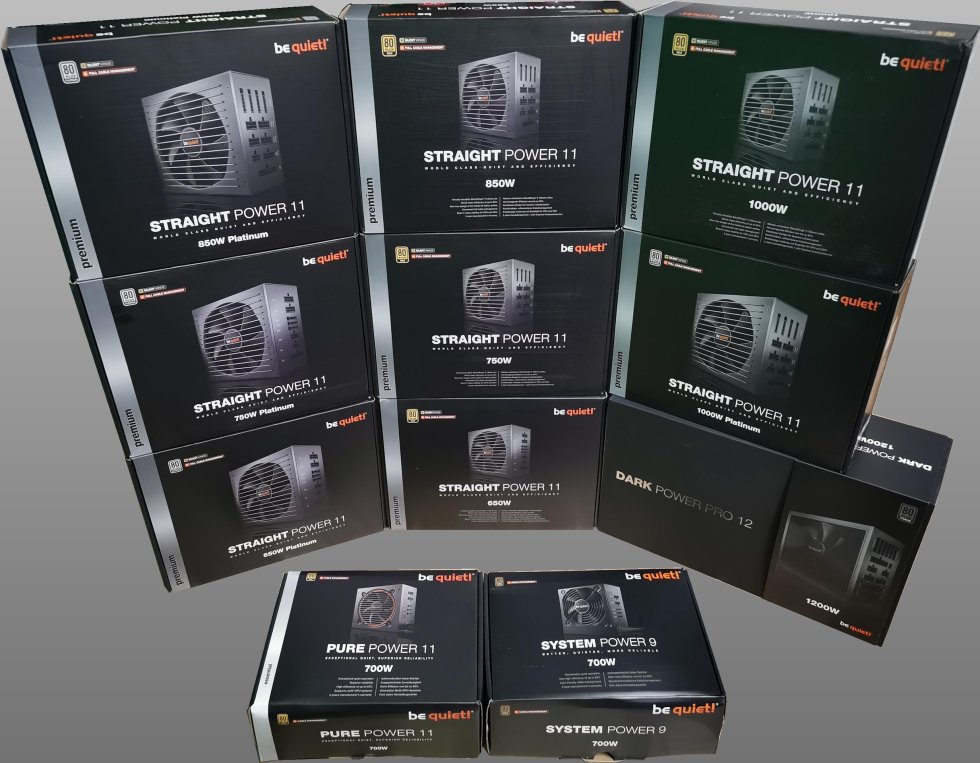
In another article “GeForce RTX 3090, RTX 3080 and RTX 3070 with Core i9-10900K against 11x be quiet System Power 9, Pure Power 11, Straight Power 11 and Dark Power Pro 12” I had bet on the Intel Core i9-10900K, the direct predecessor model, to test the limits here. I don’t need to repeat that now with the i9-11900K, because that would be boring. But since be quiet! i had “forgotten” the whole pile of power supplies here, so I can experiment again from the full and also test much meaner scenarios.
The test task, the test system and the load scenarios
This time I measure at the power supply leads in my two test scenarios exactly what is actually called up at the power supply. And that can be quite a lot. But is the Intel Core i9-11900K really as dangerous as its current reputation, or do we have to differentiate more strongly between “it can happen if” and “it always happens”? That’s exactly the question I’m going to explore today, and I’ve spent no small number of hours checking out the scenarios so as not to risk any snap judgments. I have tabulated the equipment for this again below.
But what do I expect from the power supplies today? I’m focusing on the Core i9-11900K as the maximum threat of what can happen to a PSU on current consumer CPUs. The specifications for the limits and the associated power consumption including cooling are a thing in itself, which of course range from CPU performance to efficiency and thus significantly influence a test. You can certainly run RKL-S more efficiently than Intel itself wants, but that’s not the issue today. I therefore test with the presets for the boxed cooler (125 watts PL1, 251 watts PL2, dew = 56 seconds) and those for the “tower cooler” (behind them hide a brutal 288 watts for PL1 and PL2 without dew).

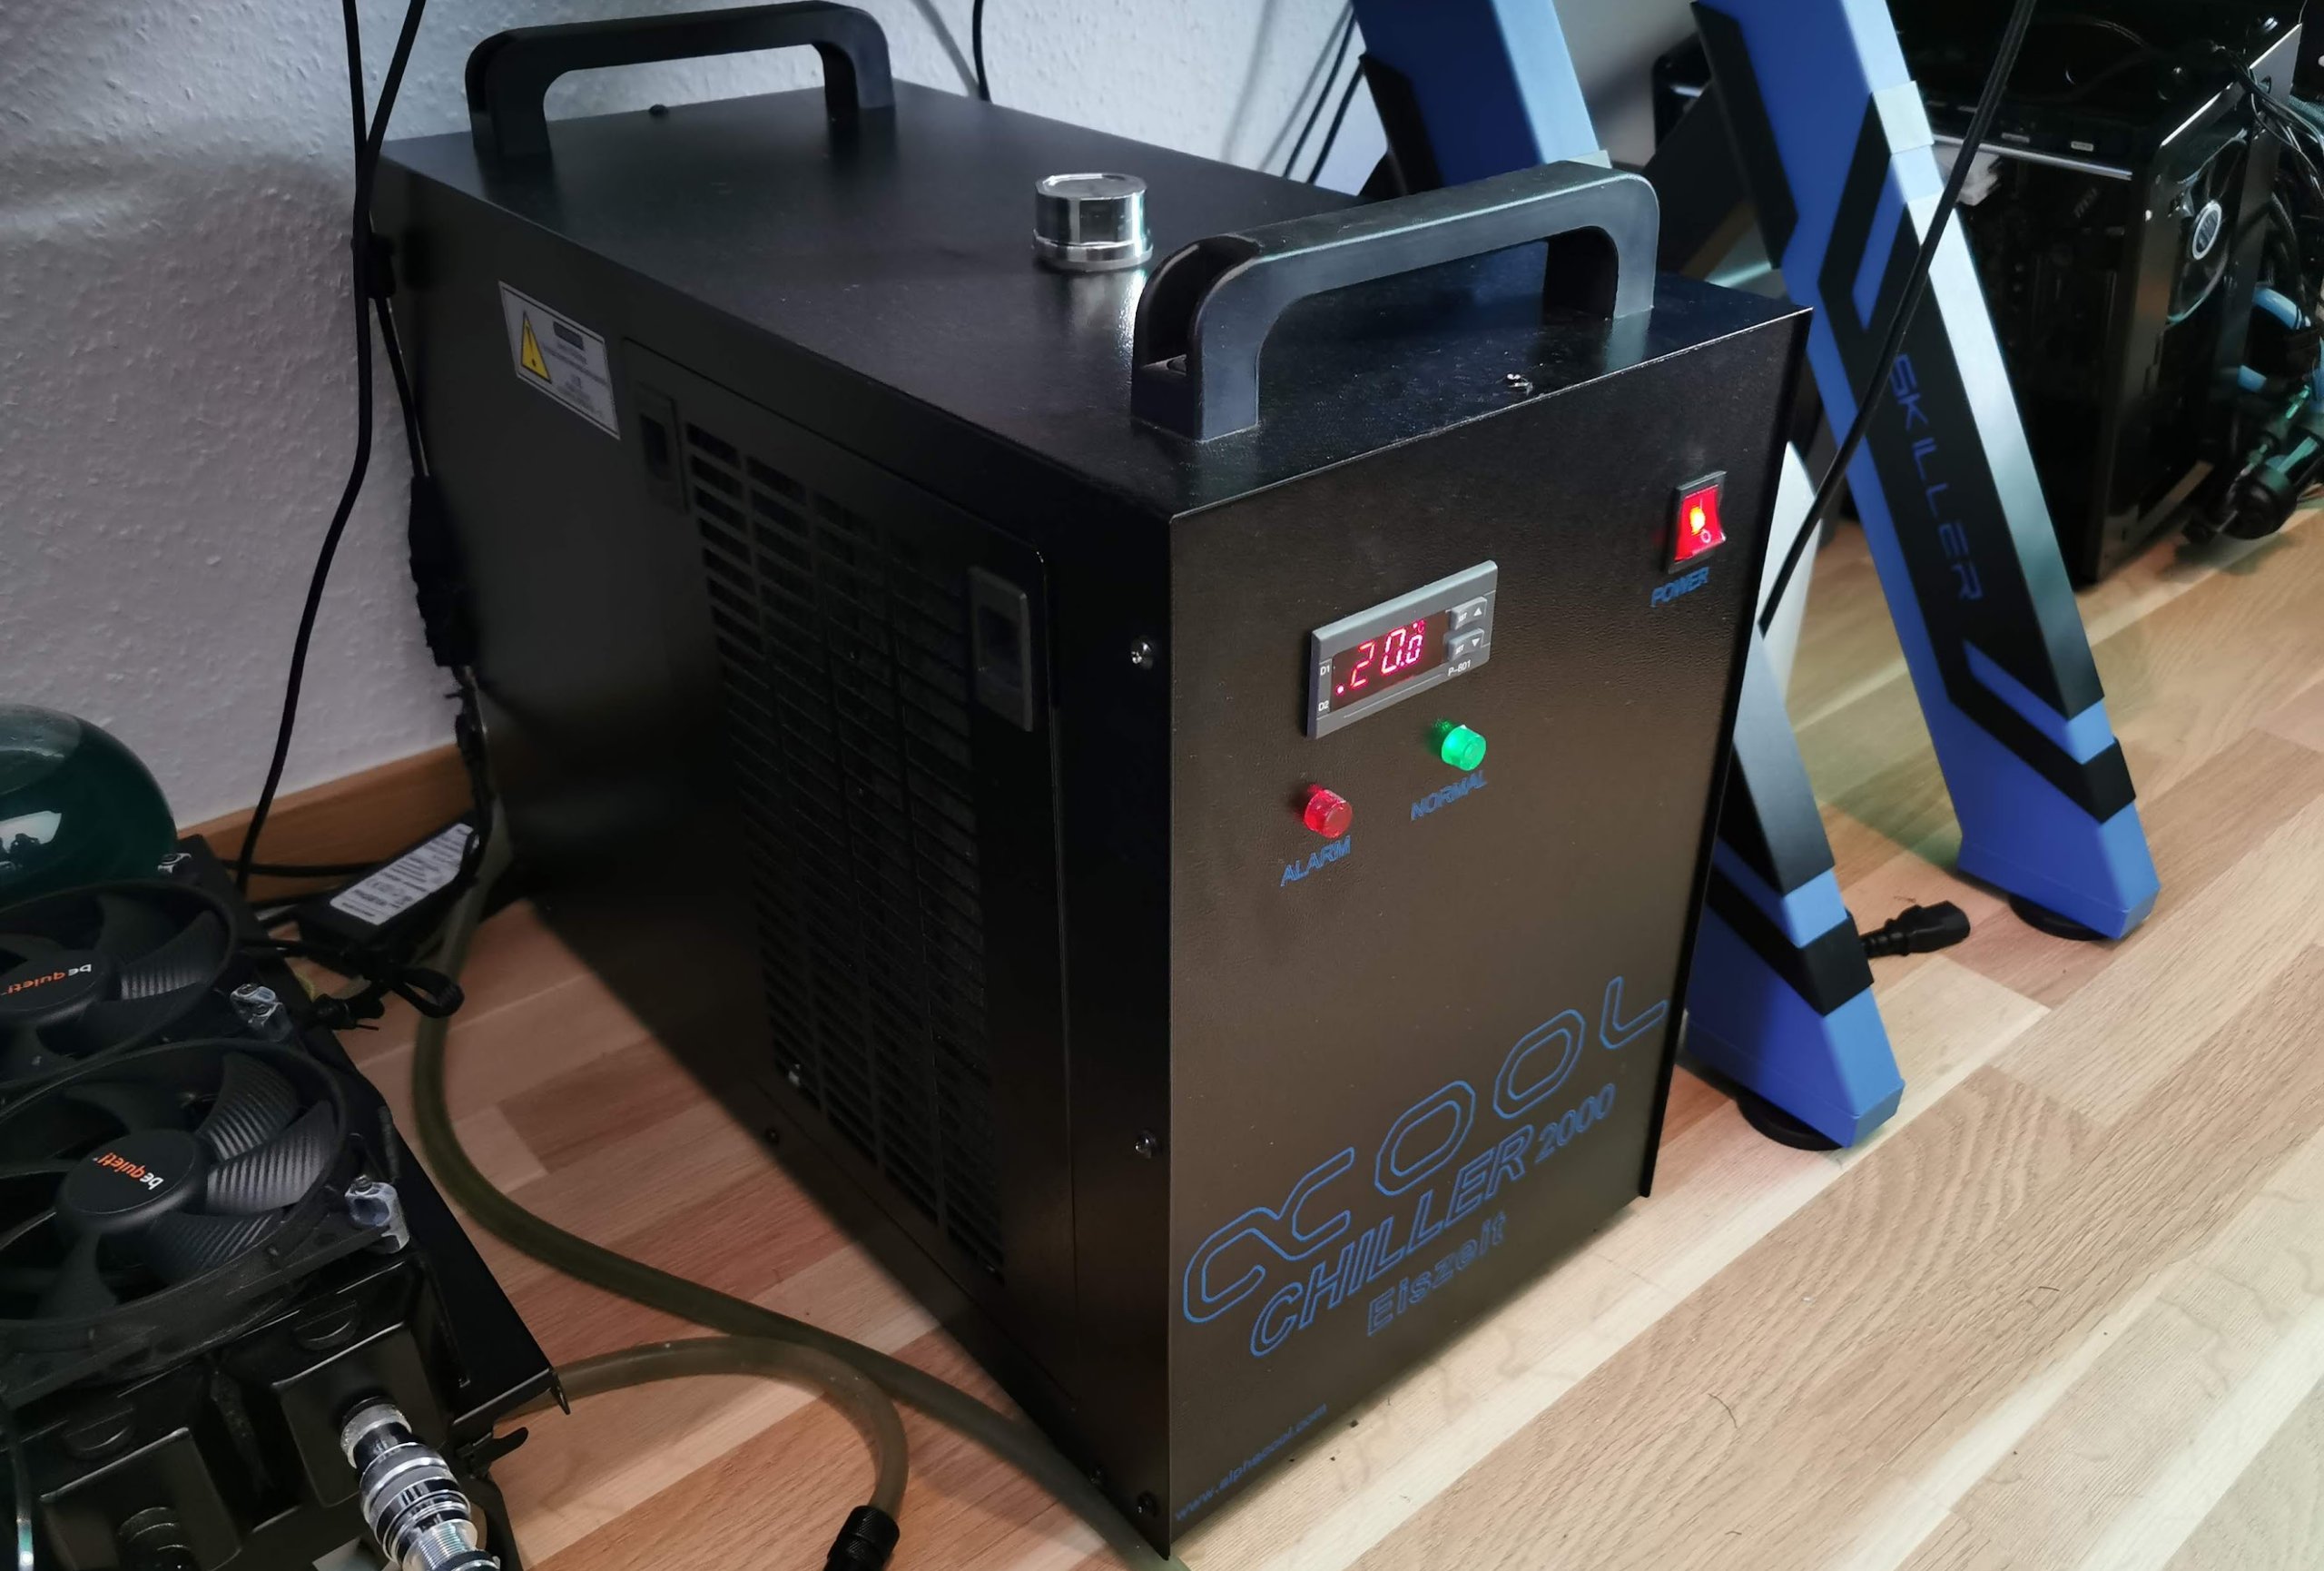
Since these settings and the downplaying in the BIOS with “Tower Air Cooler” are definitely more than politely understated, one can also assume that quite a few users will jump over this stick. But how much are 288 watts in the BIOS in the hard reality and what are the consequences for an appropriate power supply sizing? And because it gets hotter than even a 360 AiO compact water cooler could handle (I really want to see the tower cooler sometime), the chiller has to fix it again. So I will also test the default setting (Intel Default) against this setting.
I generate the load once with Cinebench R23, where I am also interested in the pure load of all CPU cores and the consequences. After that I use Control (DX12) without DLSS as a very power-hungry game to explore the interplay with CPU and graphics card. This will be in 720p with full CPU load, as well as Ultra HD with full graphics load. First of all, a factory overclocked MSI Radeon RX 6900XT Gaming X Trio is used, which can draw up to 350 watts (BIOS setting), but of course easily exceeds this in the load peaks.
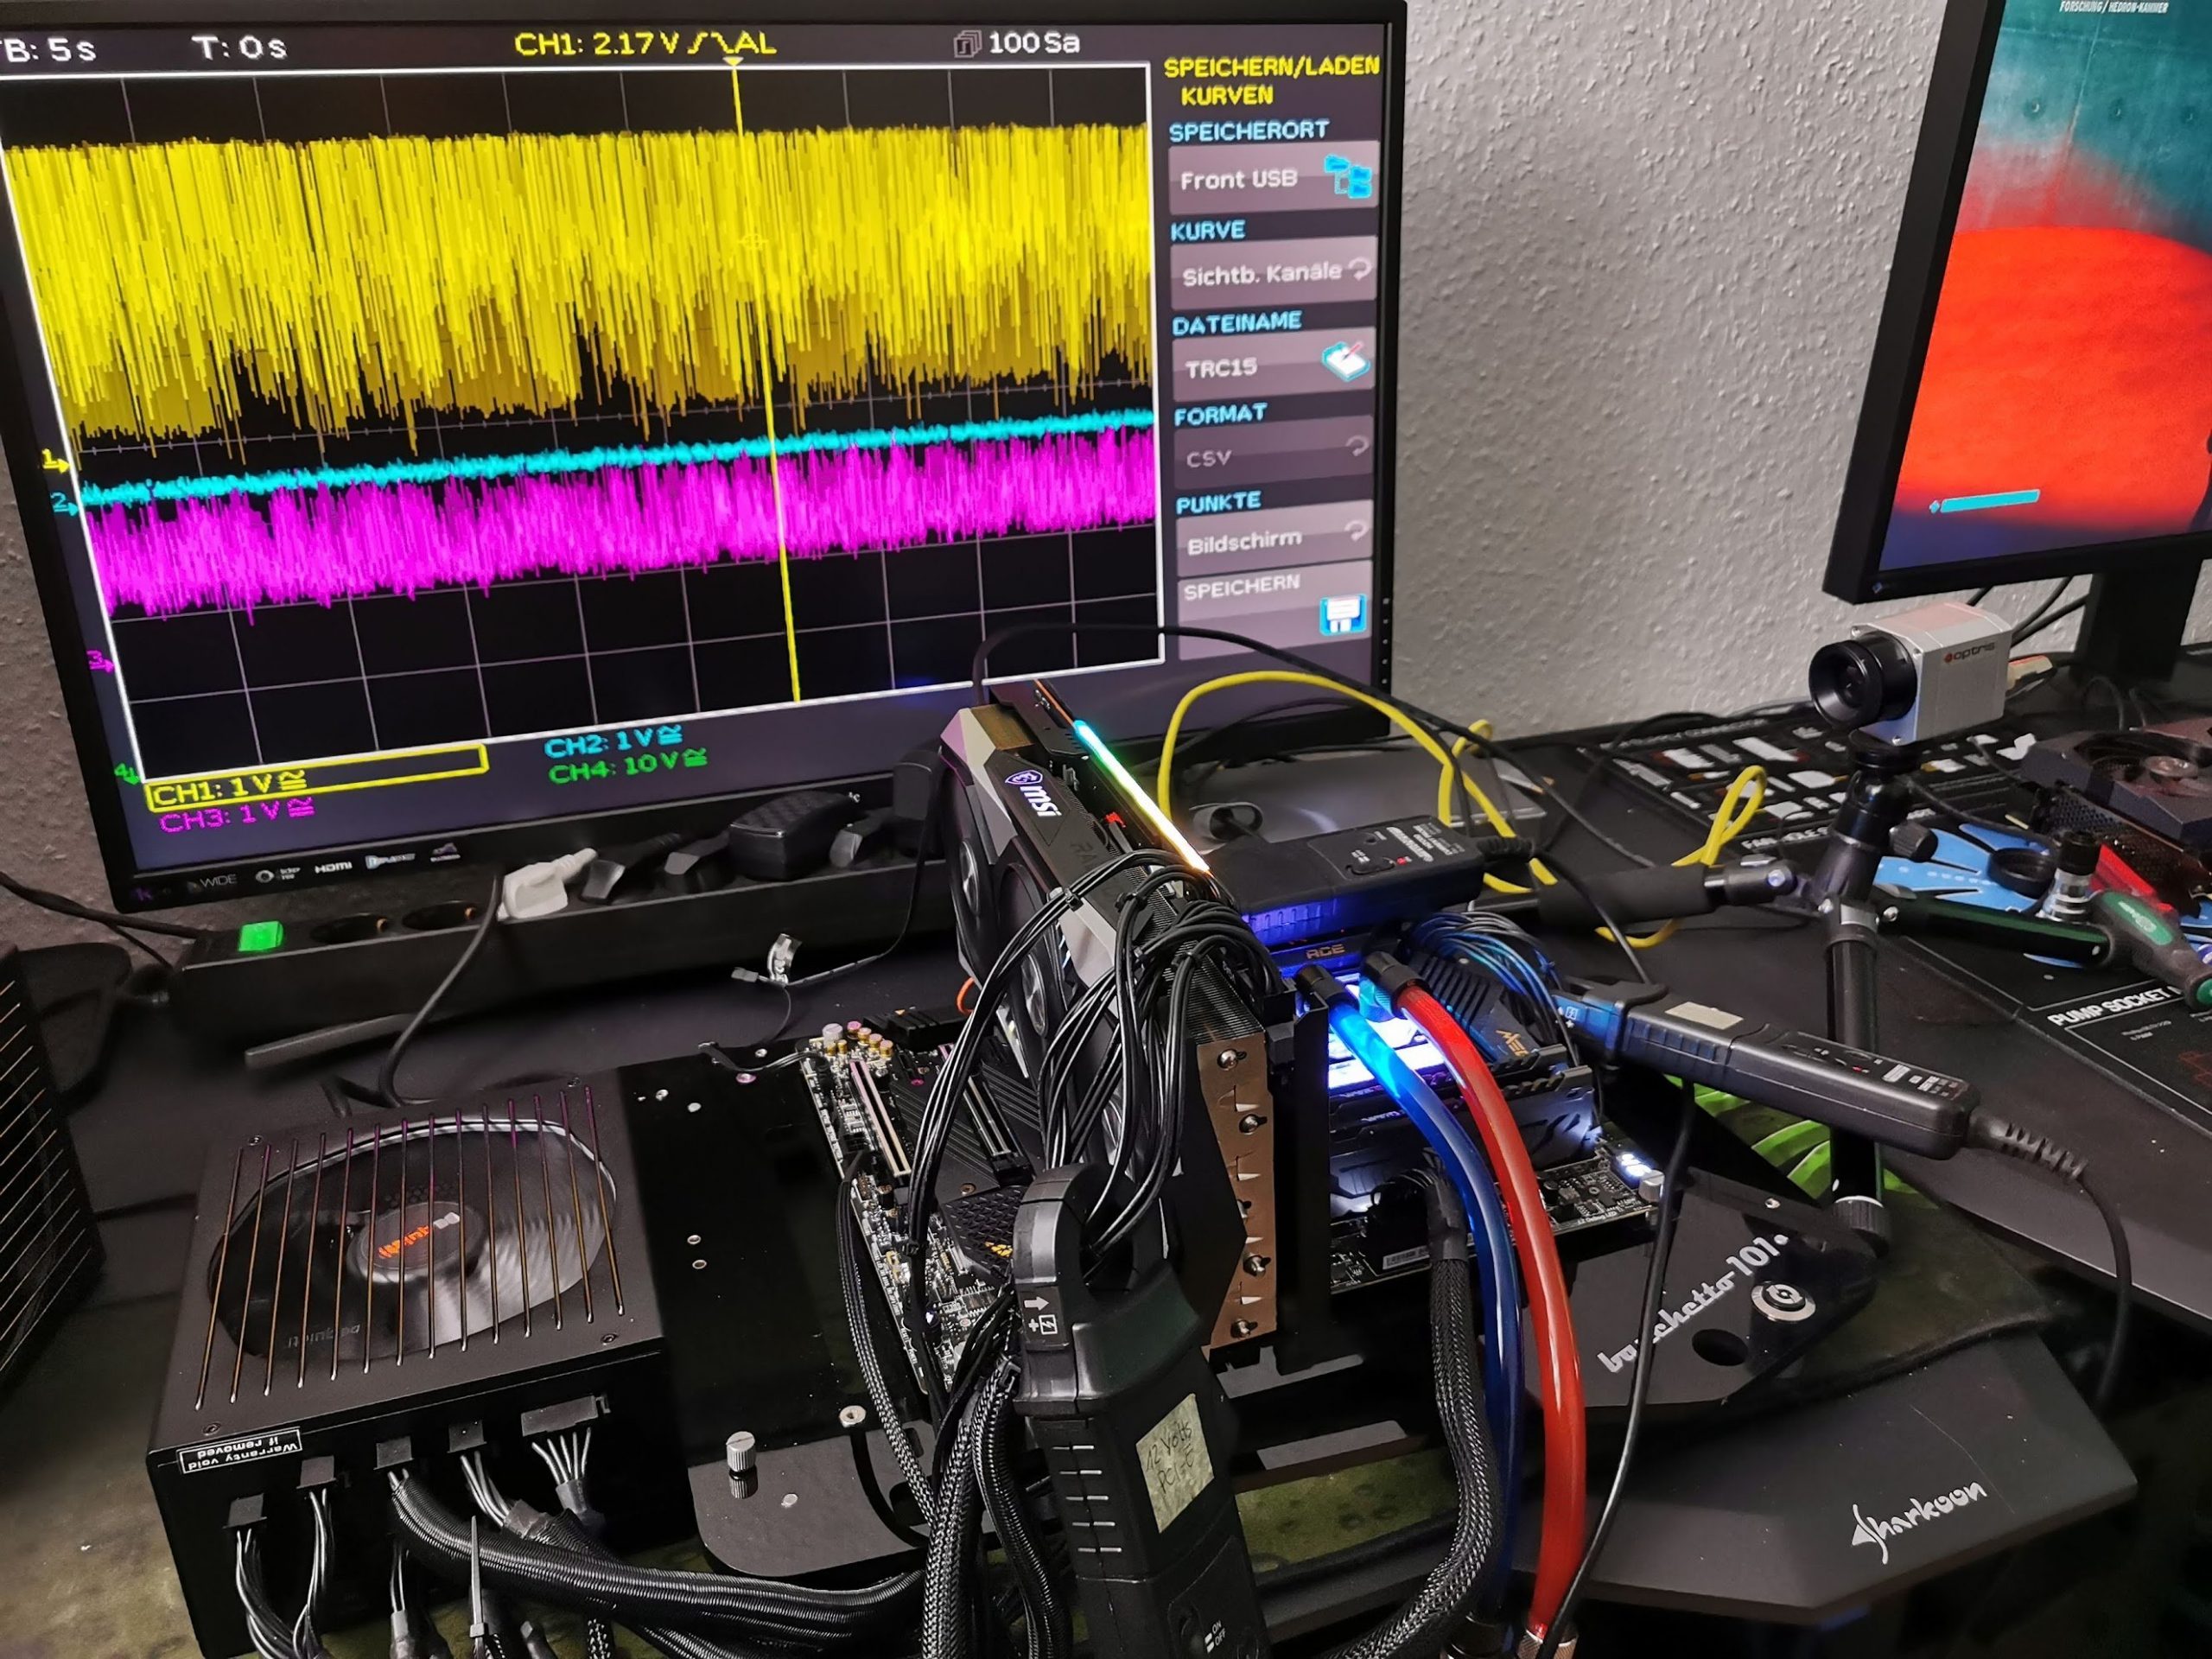
And because it’s not enough, I’m going for another run with an MSI GeForce RTX 3090 Suprim, whose board power is set at 420 watts and… well, we’ve seen this before. It is clearly more in the peaks and also sends the RX 6900XT easily into the dark corner for crying. So we can see that it’s more of a practical consideration today, where nonsensical load scenarios are left out, because nobody plays Furmark and Prime95 anyway and the characteristics of the resulting peaks are completely different.
Thus armed, I started to measure and was initially surprised that despite the supposedly large wattage numbers almost all power supplies played along. As such, I can spoil it right now (tactically clumsy, I know) that the very big bang will be absent from my test patterns, except for…. But the devil is in the details (as well as the max setting from older tests) and wants to be boldly and intricately beaten out. So it remains exciting until the end! Proverbial, even, so don’t worry….
Overall, the power consumption of the Intel system can be estimated as follows, regardless of the graphics card used with all components including all connected peripherals and all voltage converter losses:
| Components |
Z590 Power Consumption |
| Gaming |
56 Watts |
| Gaming OC | 60 Watts |
| Torture |
68 Watts |
| Torture OC / PL |
73 Watts |
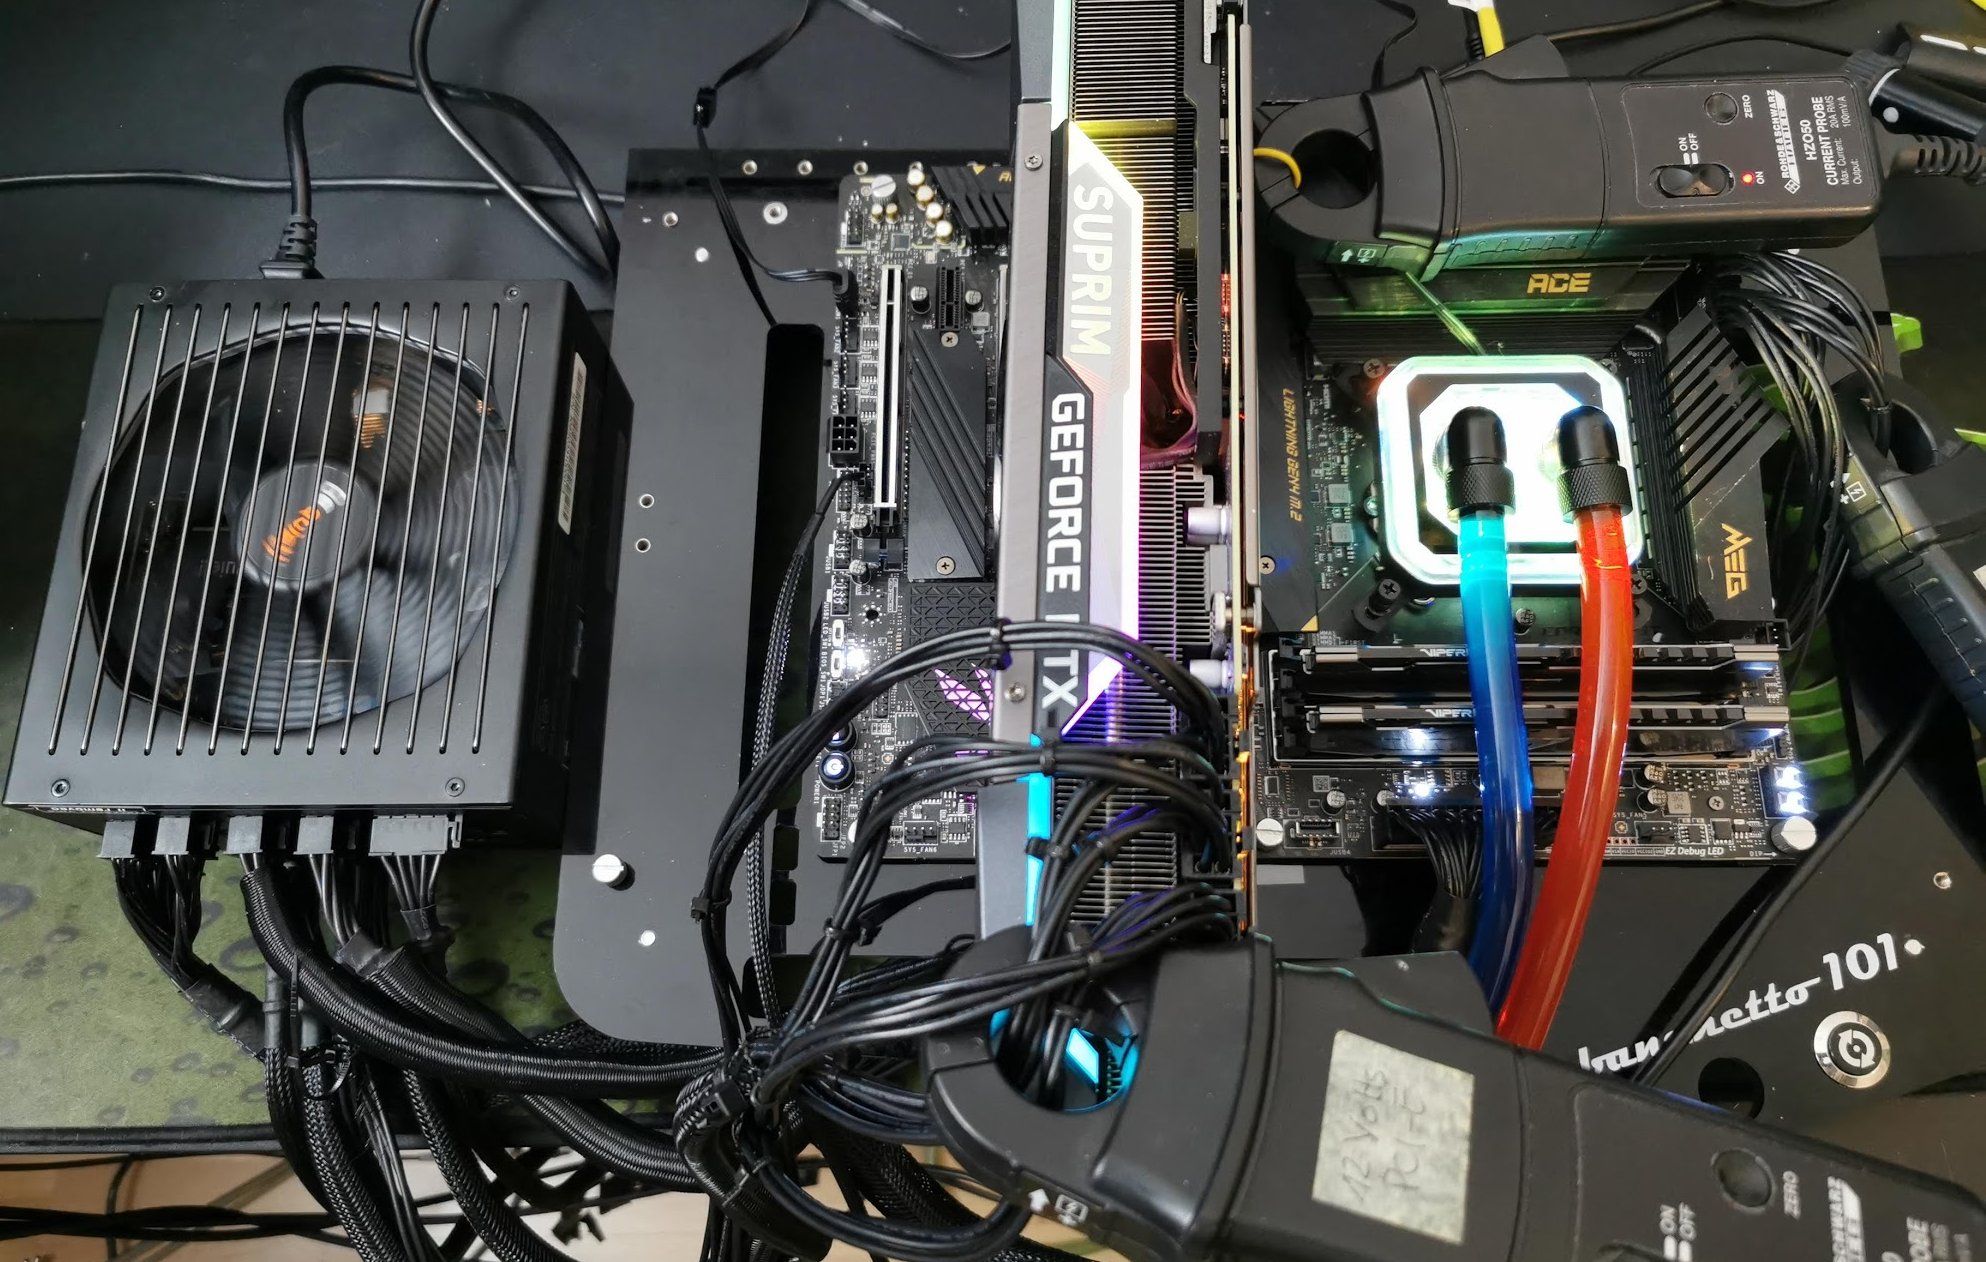
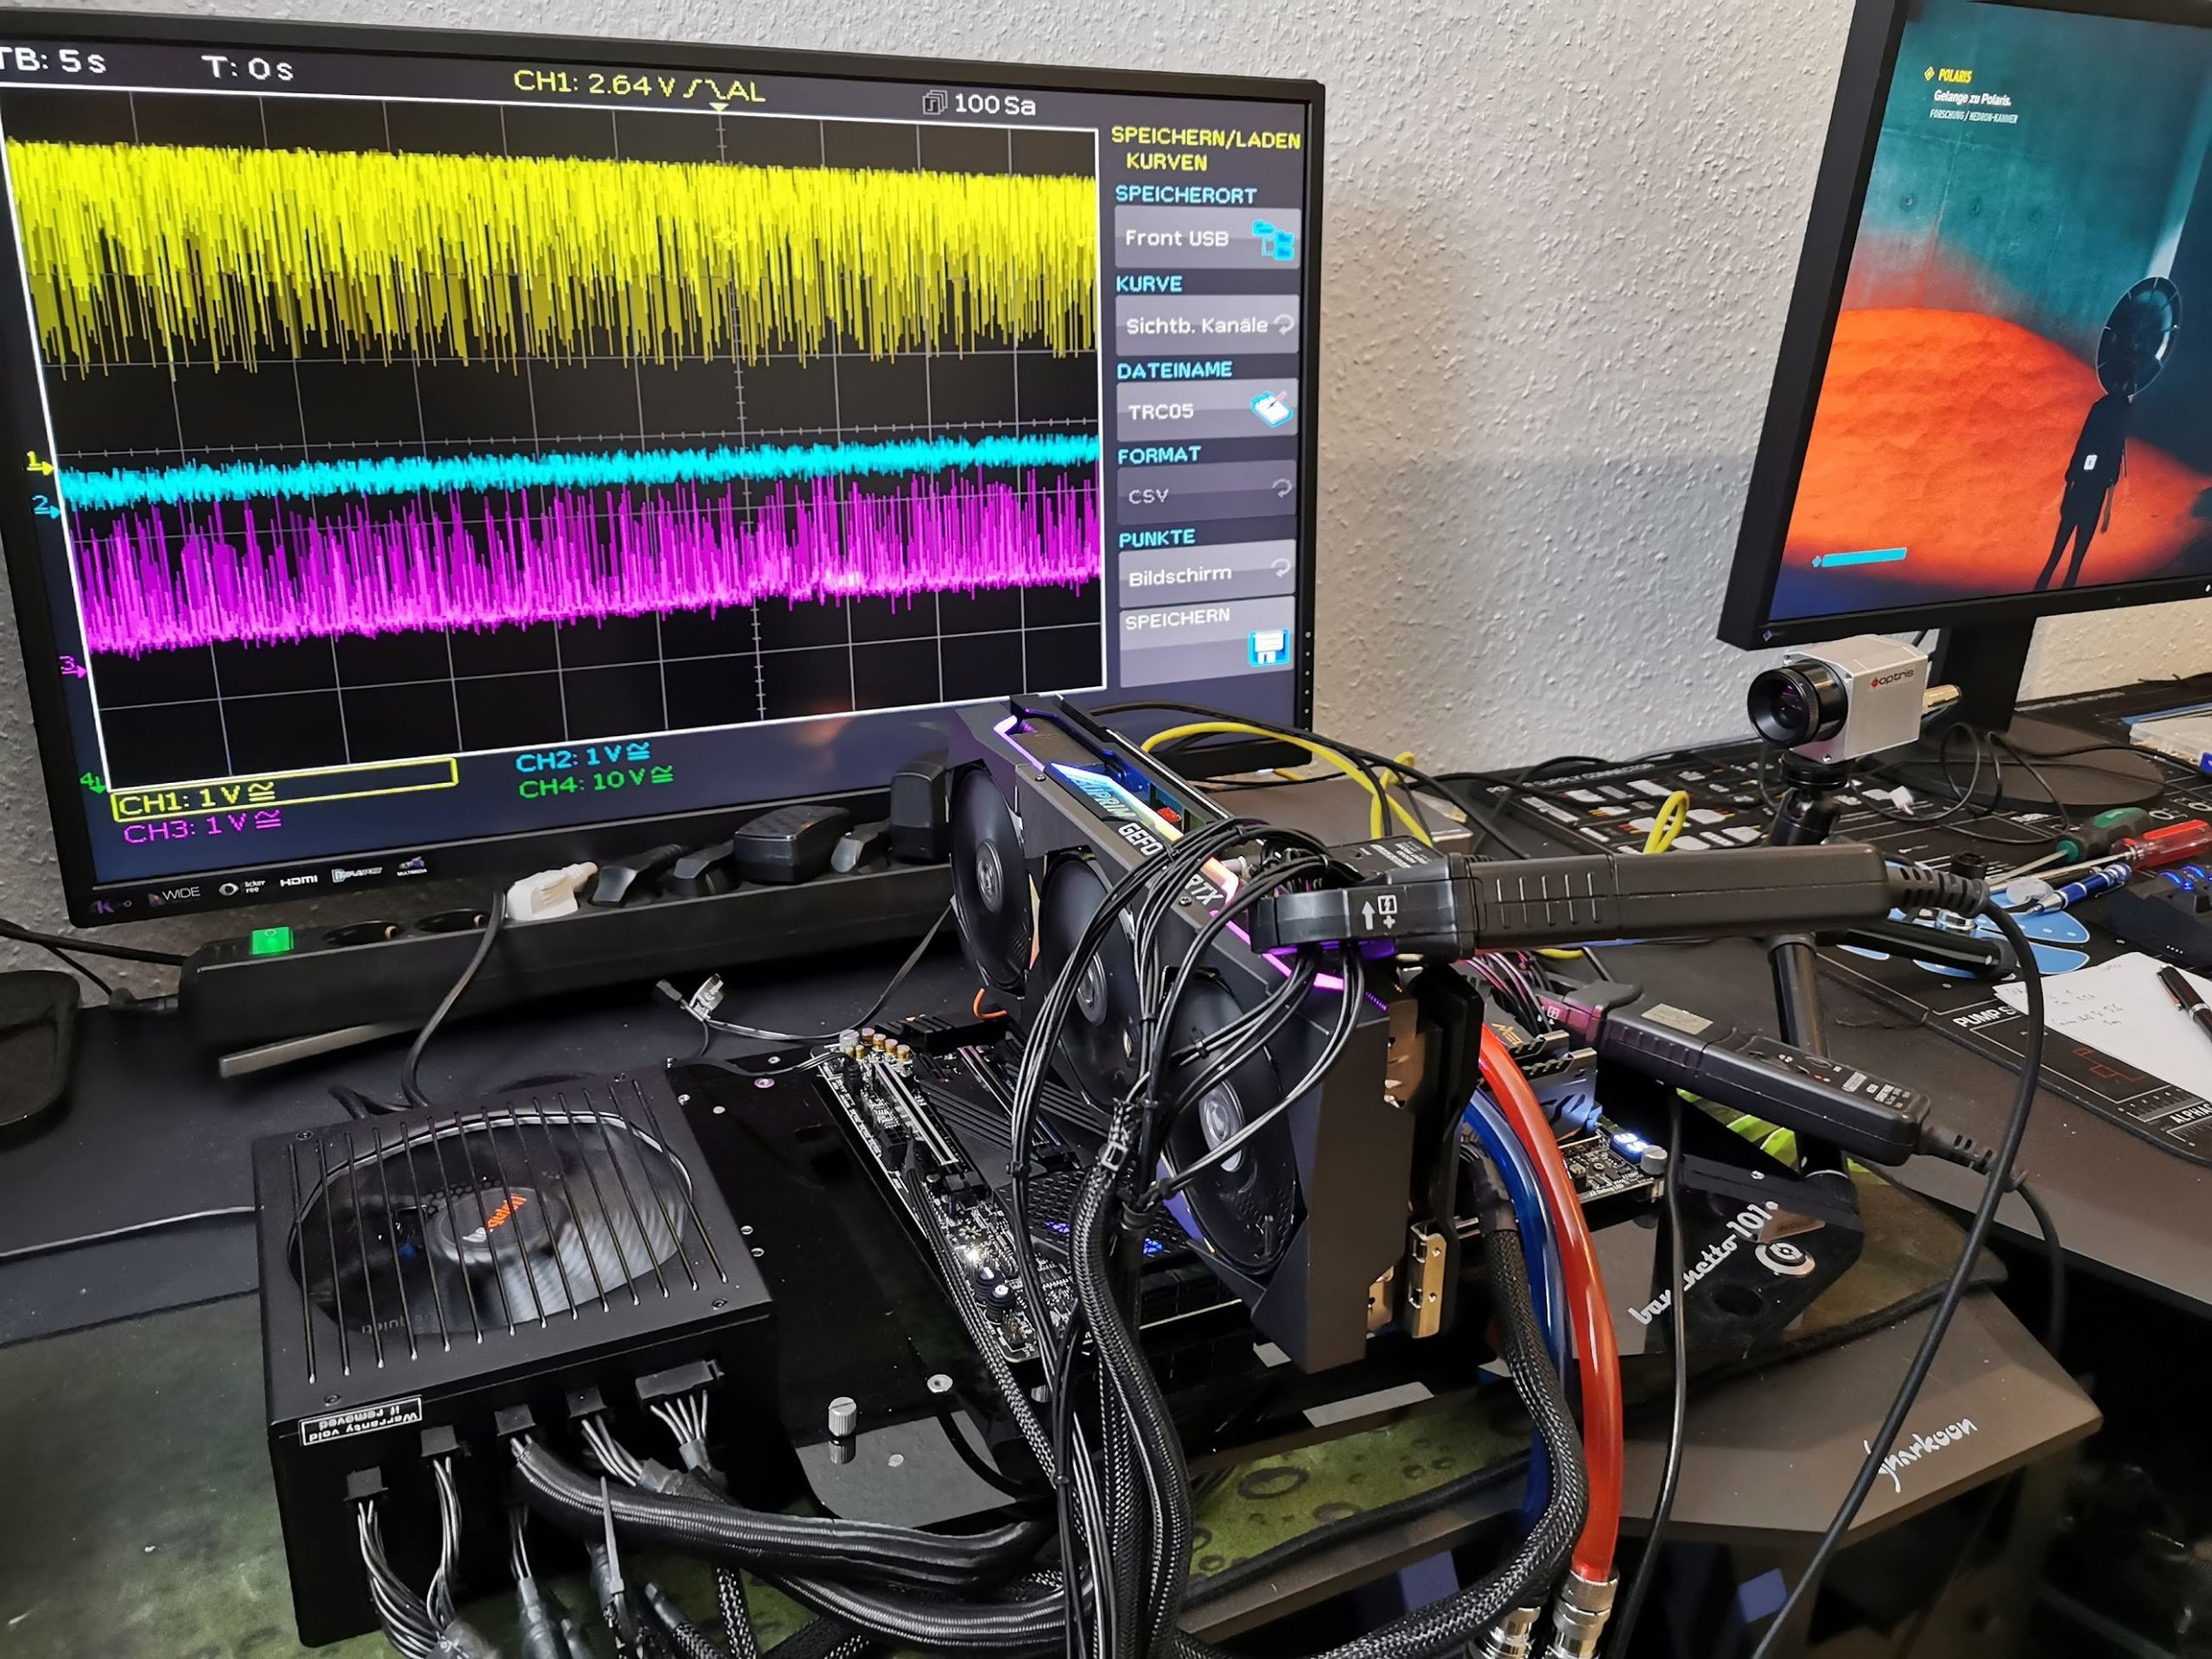
The software used relies on my own interpreter and evaluation software as well as a very comprehensive and flexible Excel sheet for the calculation of the power consumption curves and the values provided by the oscillographs. Because normal, rather slow shunt measurements won’t get you anywhere. I have quickly summarized the individual components of the test system in a table:
| Test System and Equipment |
|
|---|---|
| Hardware: |
Intel Core i9-11900 K MSI MEG Z590 AC E 2x 16 GB Patriot Viper DDR4 4000 @DDR4 3733 (Gear 1) 1x 1 TB Corsair MP600 1x Seagate FastSSD Portable USB-C Be Quiet! Dark Power Pro 12 1200 Watt |
| Cooling: |
Alphacool Ice Age 2000 Chiller Alphacool Ice Block XPX Pro |
| Case: |
Microcool Banchetto 101 |
| Monitor: | BenQ PD3220U |
| Power Consumption: |
Oscilloscope-based system: Non-contact direct current measurement on PCIe slot (riser card) Non-contact direct current measurement at the external PCIe power supply Direct voltage measurement at the respective connectors and at the power supply unit 2x Rohde & Schwarz HMO 3054, 500 MHz multichannel oscilloscope with memory function 4x Rohde & Schwarz HZO50, current clamp adapter (1 mA to 30 A, 100 KHz, DC) 4x Rohde & Schwarz HZ355, probe (10:1, 500 MHz) 1x Rohde & Schwarz HMC 8012, HiRes digital multimeter with memory function |
| Thermal Imager: |
1x Optris PI640 + 2x Xi400 Thermal Imagers Pix Connect Software Type K Class 1 thermal sensors (up to 4 channels) |
| Acoustics: |
NTI Audio M2211 (with calibration file) Steinberg UR12 (with phantom power for the microphones) Creative X7, Smaart v.7 Own anechoic chamber, 3.5 x 1.8 x 2.2 m (LxDxH) Axial measurements, perpendicular to the centre of the sound source(s), measuring distance 50 cm Noise emission in dBA (slow) as RTA measurement Frequency spectrum as graphic |
| OS: | Windows 10 Pro (all updates) |


36 Antworten
Kommentar
Lade neue Kommentare
Urgestein
Mitglied
Veteran
Mitglied
Urgestein
Mitglied
1
1
1
Mitglied
Urgestein
Veteran
Urgestein
Urgestein
Urgestein
Urgestein
Urgestein
1
Mitglied
Alle Kommentare lesen unter igor´sLAB Community →