


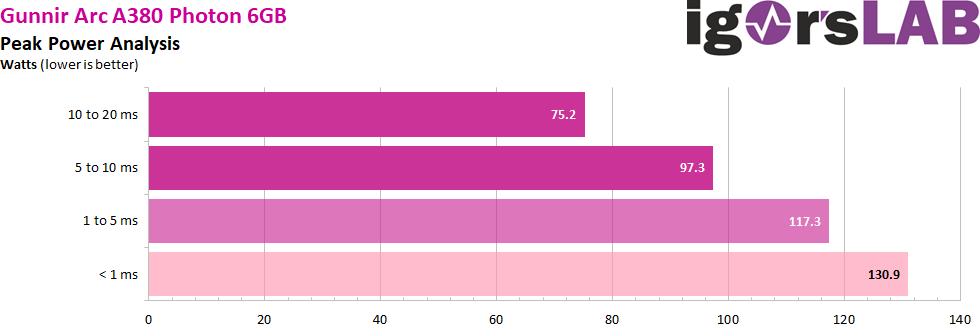
Load peaks(transients) and power supply recommendation
As I have already demonstrated in detail in my basic article “Graphics Card’s Battle against Power Supply – Power Consumption and Peak Power Demystified | igorsLAB”, higher loads in the millisecond range do exist for short periods of time, which can lead to inexplicable shutdowns if the power supply units are not properly designed or equipped. The TBP (Typical Board Power) measured by the graphics card manufacturer or the reviewers is not really helpful for a stable system design. Peaks with intervals between 1 and 10 ms can lead to shutdowns in very fast-response protection circuits (OPP, OCP), especially in multi-rail power supplies, although the average power consumption is still within the norm.
For the card’s peaks, I would calculate with at least 120 to 130 watts proportionate to the system’s total power consumption on the secondary side to have enough reserves for the worst case scenario. If the Voltage Offset is used to its full extent, peaks of at least 150 watts would have to be taken into account in the relevant range.
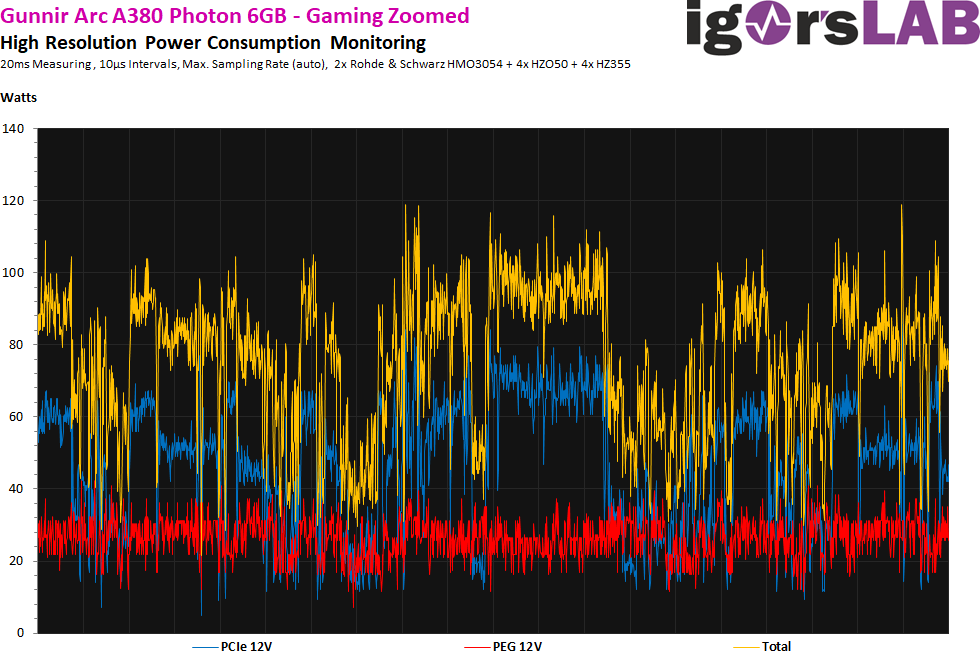
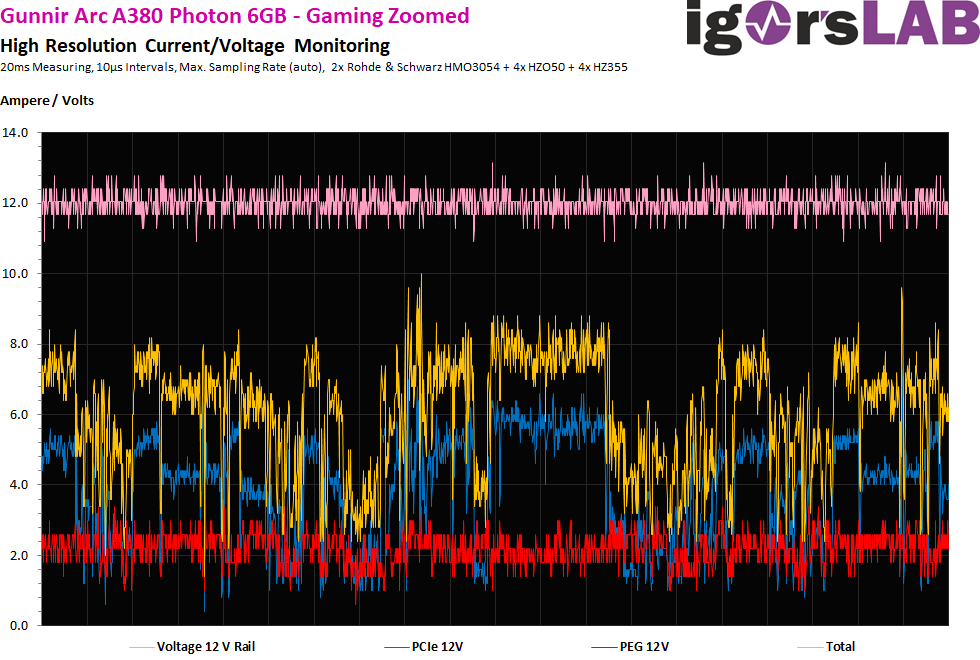
Transients as detail graphics in different resolutions during gaming and stress testing
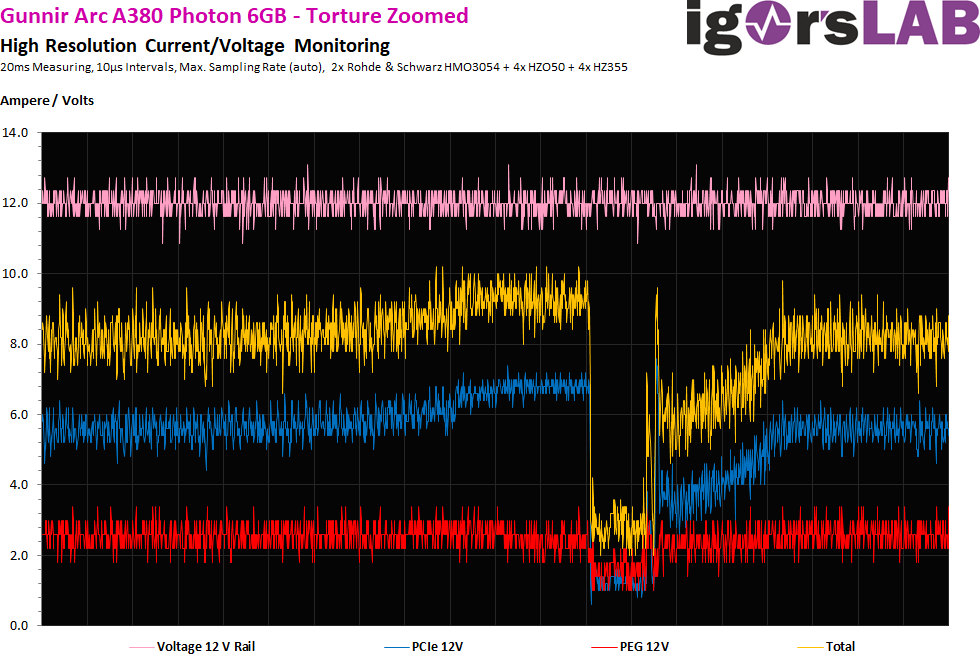
A short excerpt with higher resolution now shows us the even higher-resolution 20-ms measurements (10 μS intervals), as I run them automatically to determine the value. First, let’s start with gaming again:
during the stress test, the downregulation by the telemetry can be seen well in the small intervals.
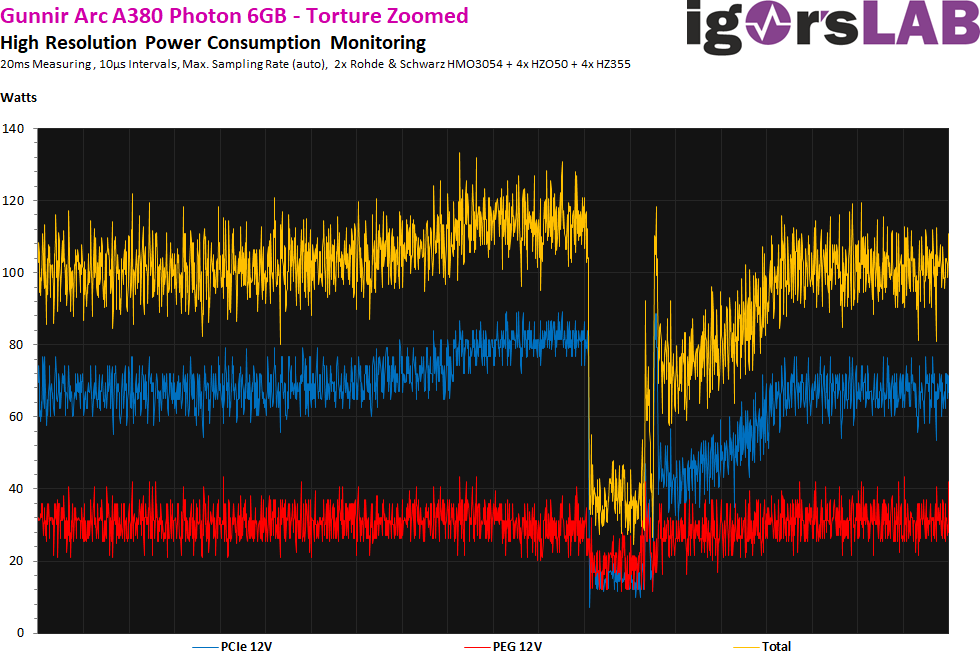
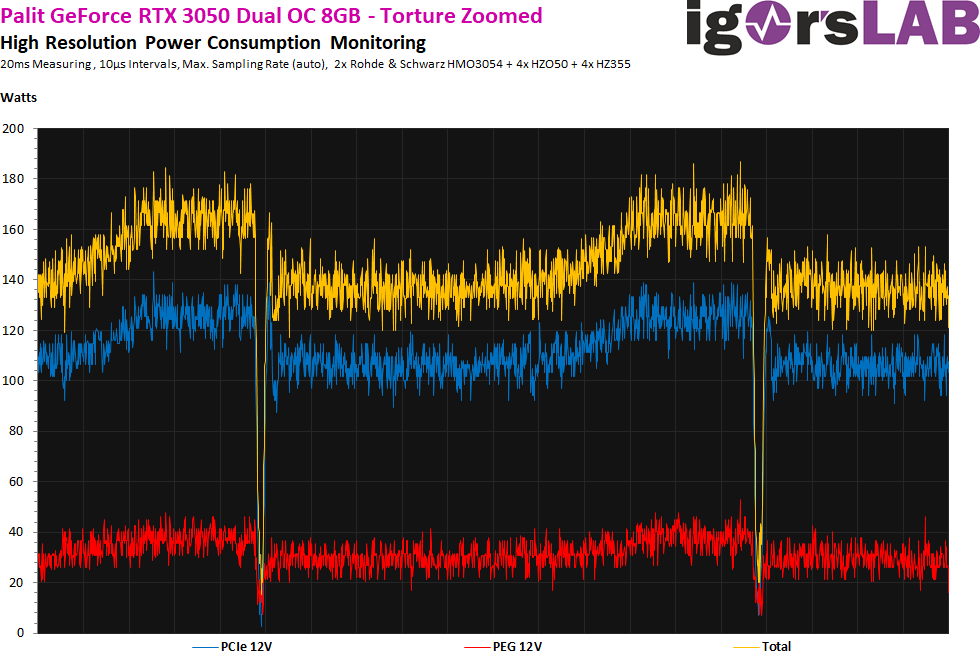
And for comparison, take a current NVIDIA card as an example (the model doesn’t matter there), where you can see that it is regulated much more often and the valleys are also much shorter and differently shaped.
the_ad_group id=”7834″]
- 1 - Introduction, an important foreword, specs und details
- 2 - Unboxing, hi-res pictures and features
- 3 - Teardown: PCB and cooler
- 4 - Telemetry, overclocking, bottleneck and micro stuttering
- 5 - FPS - Frames Per Second
- 6 - FPS - Curves
- 7 - Percentiles - Curves
- 8 - Frame Times - Percentage shares as a bar chart
- 9 - Frame Times - Curves
- 10 - Variances - Percentage shares as a bar chart
- 11 - AutoCAD 2021 and Inventor Pro 2021
- 12 - 3ds Max, Catia, Creo, Energy
- 13 - Maya, Medical, Siemens NC, SW 2017
- 14 - Power consumption as an overall consideration
- 15 - Load peaks and power supply recommendation
- 16 - Power consumption individually for all games
- 17 - Efficiency individually for all games
- 18 - Clock rate, temperatures, fan speed and noise
- 19 - Summary and conclusion


97 Antworten
Kommentar
Lade neue Kommentare
Urgestein
Urgestein
1
Urgestein
Moderator
Mitglied
Veteran
1
Mitglied
Mitglied
Urgestein
1
Urgestein
Urgestein
Mitglied
Veteran
Urgestein
1
Alle Kommentare lesen unter igor´sLAB Community →