


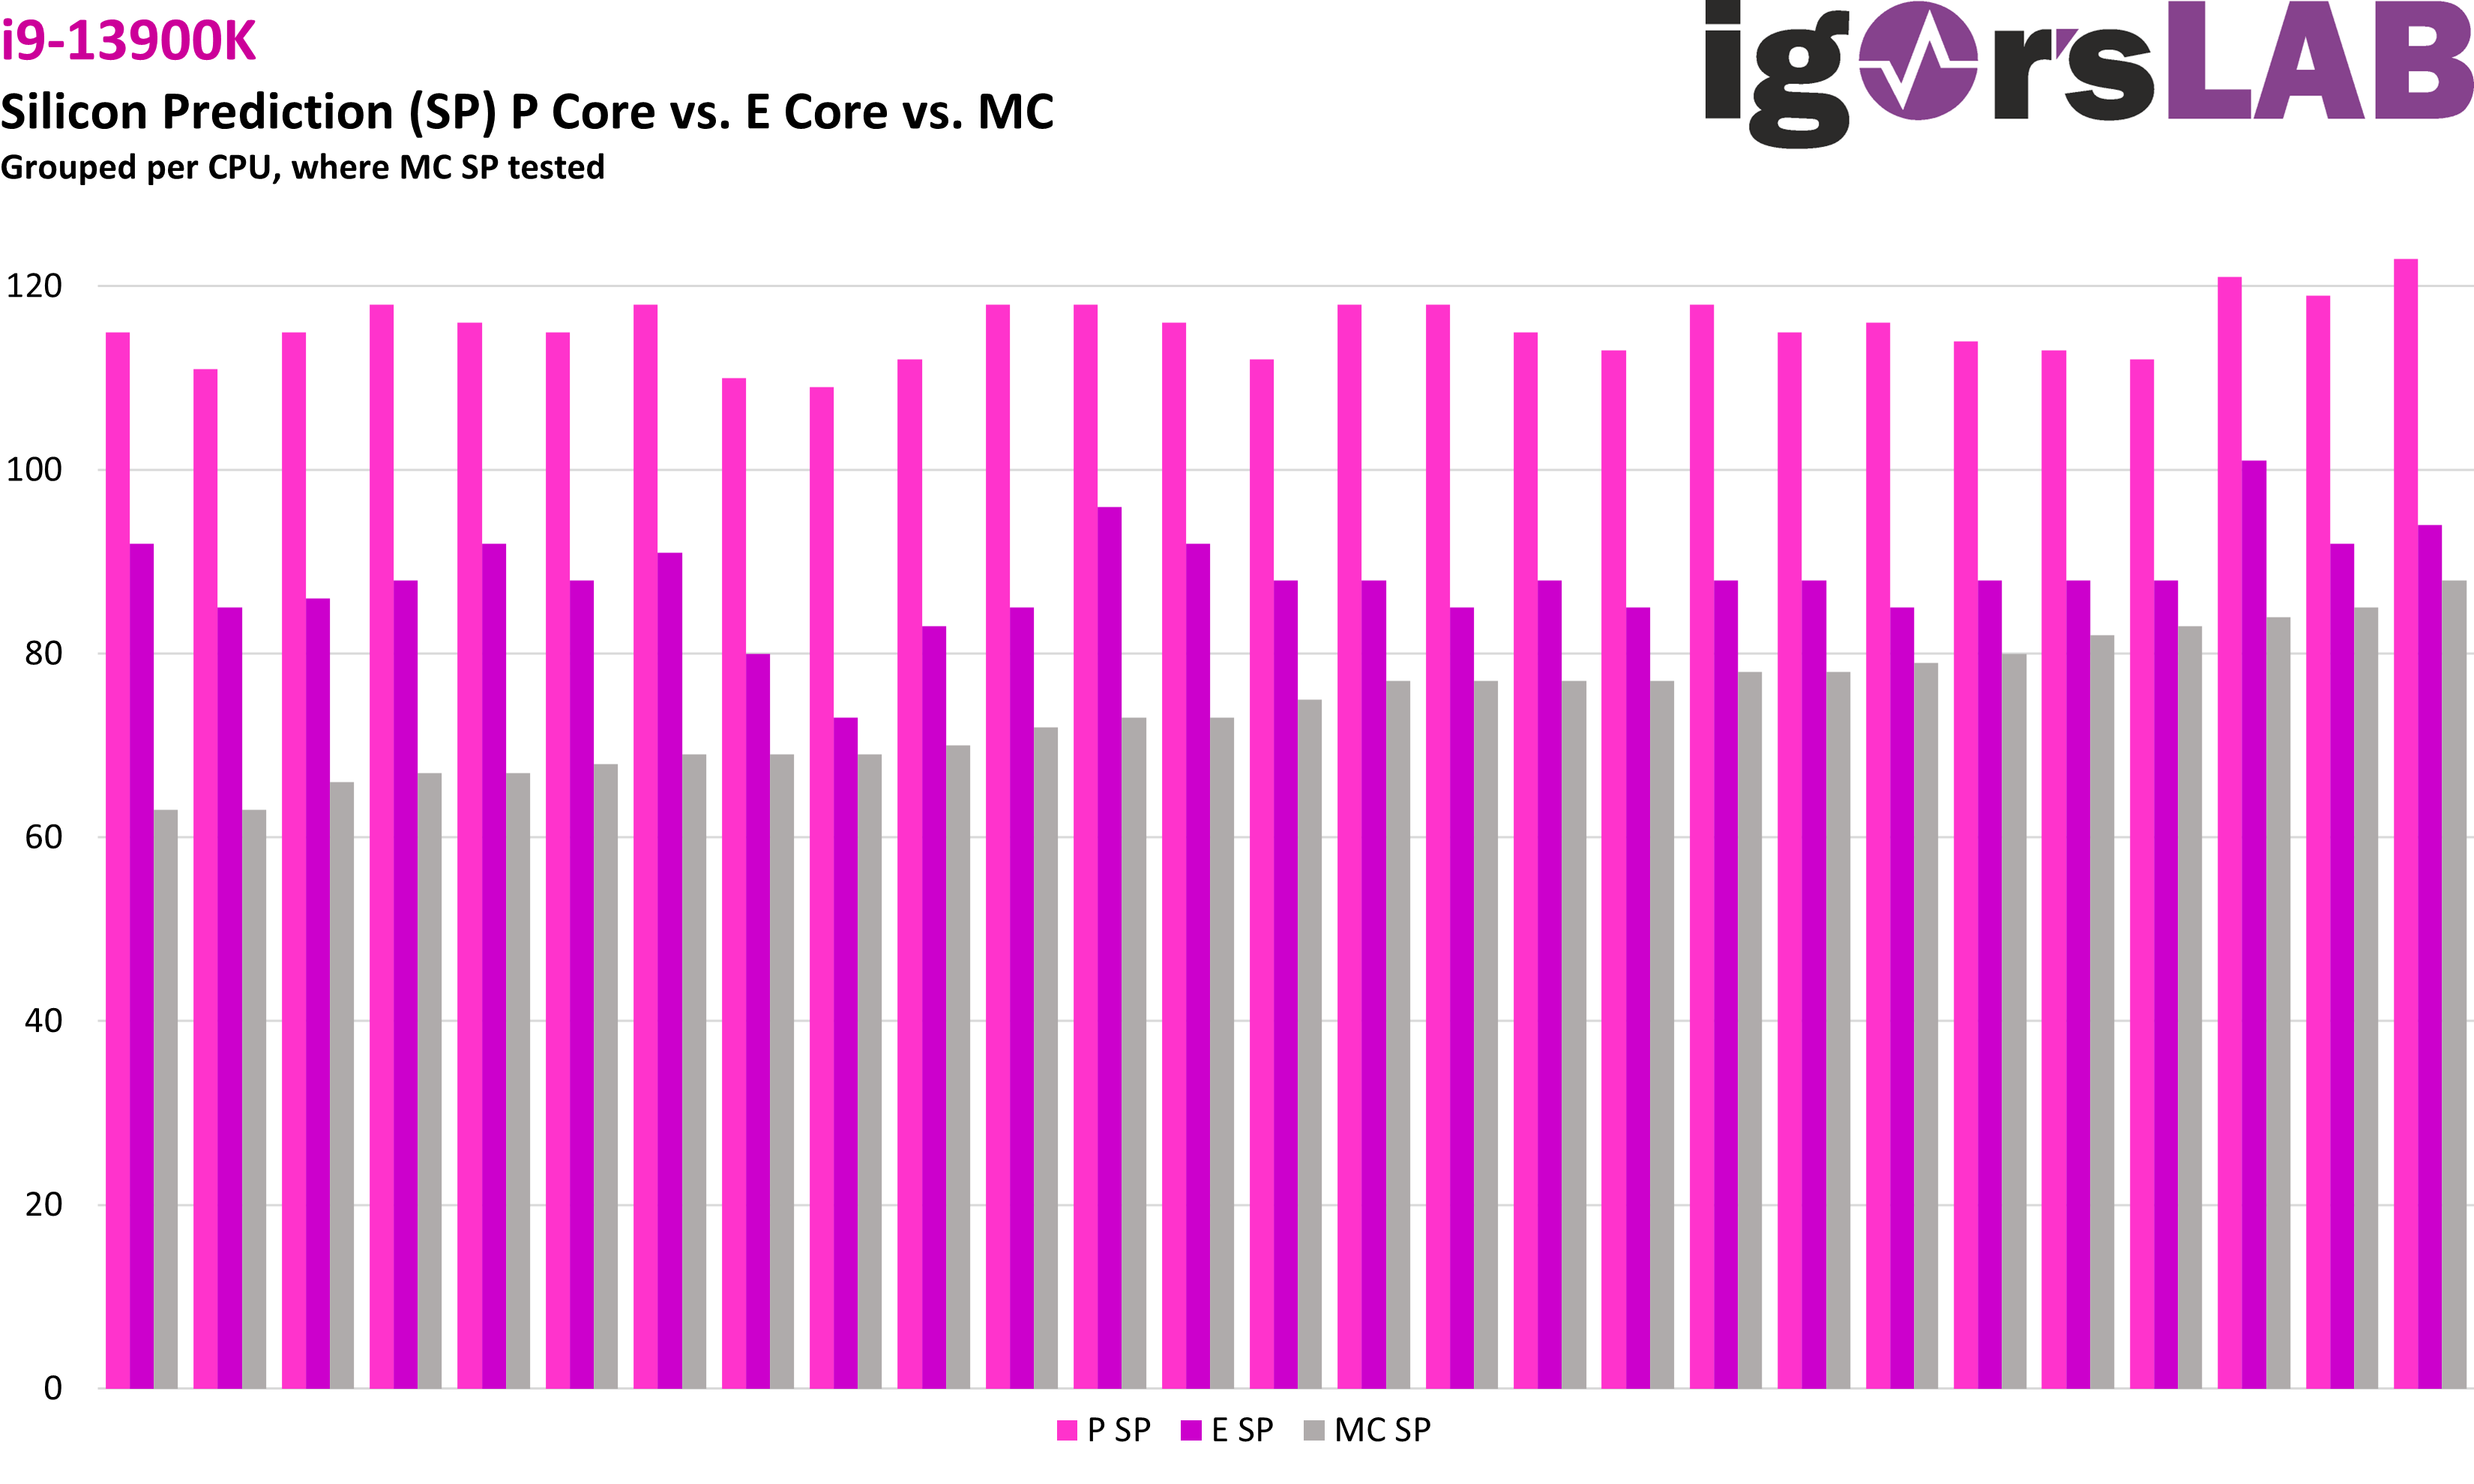
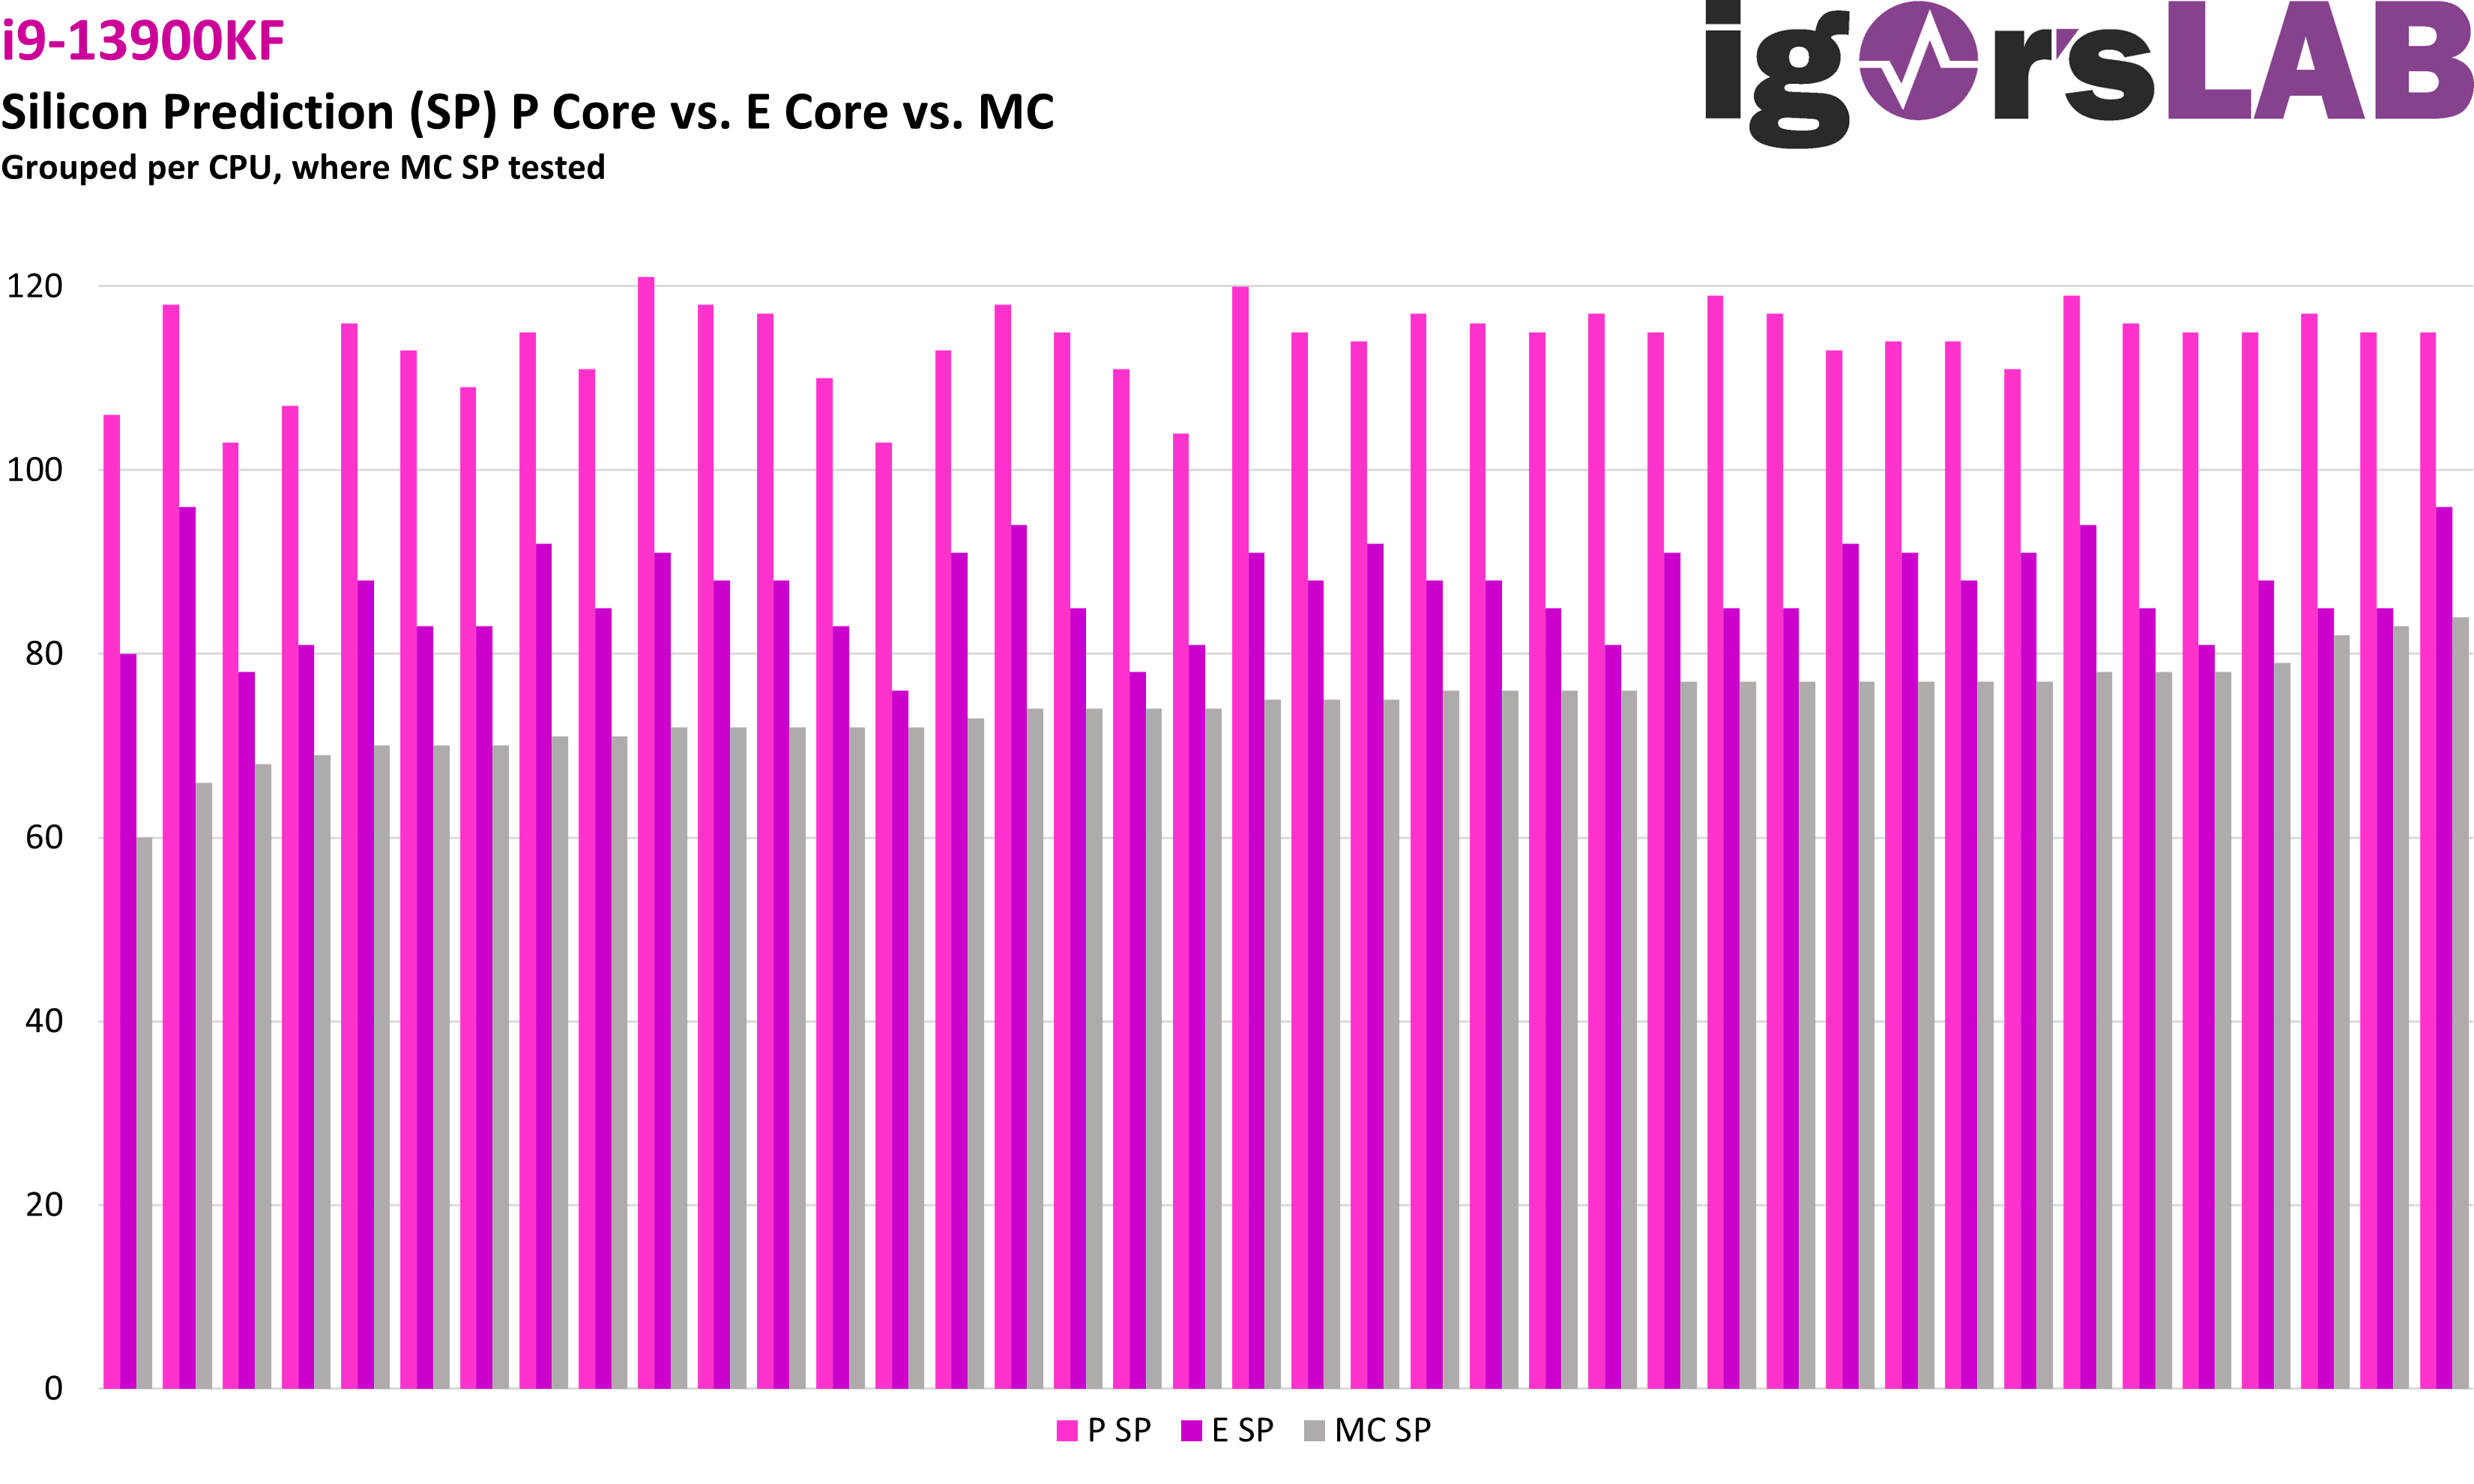
Now, admittedly, it gets a little confusing. You can see all the chips for which we have determined the MC SP value (more on this on the next page), with the respective P and E SP value. Thus, in this plot, dependencies between the different SP values should be apparent. However, there seems to be none. On the 13900K, the CPU with the highest MC SP also has the highest P SP, but on the 13900KF, the best MC SP is only in the midfield for the other values. Conversely, there also appears to be no correlation between the E SP and the MC SP.


31 Antworten
Kommentar
Lade neue Kommentare
Urgestein
Veteran
Mitglied
Urgestein
Mitglied
Veteran
1
Urgestein
Moderator
Mitglied
Urgestein
Urgestein
Urgestein
Mitglied
Urgestein
Urgestein
Mitglied
Urgestein
Urgestein
Alle Kommentare lesen unter igor´sLAB Community →