


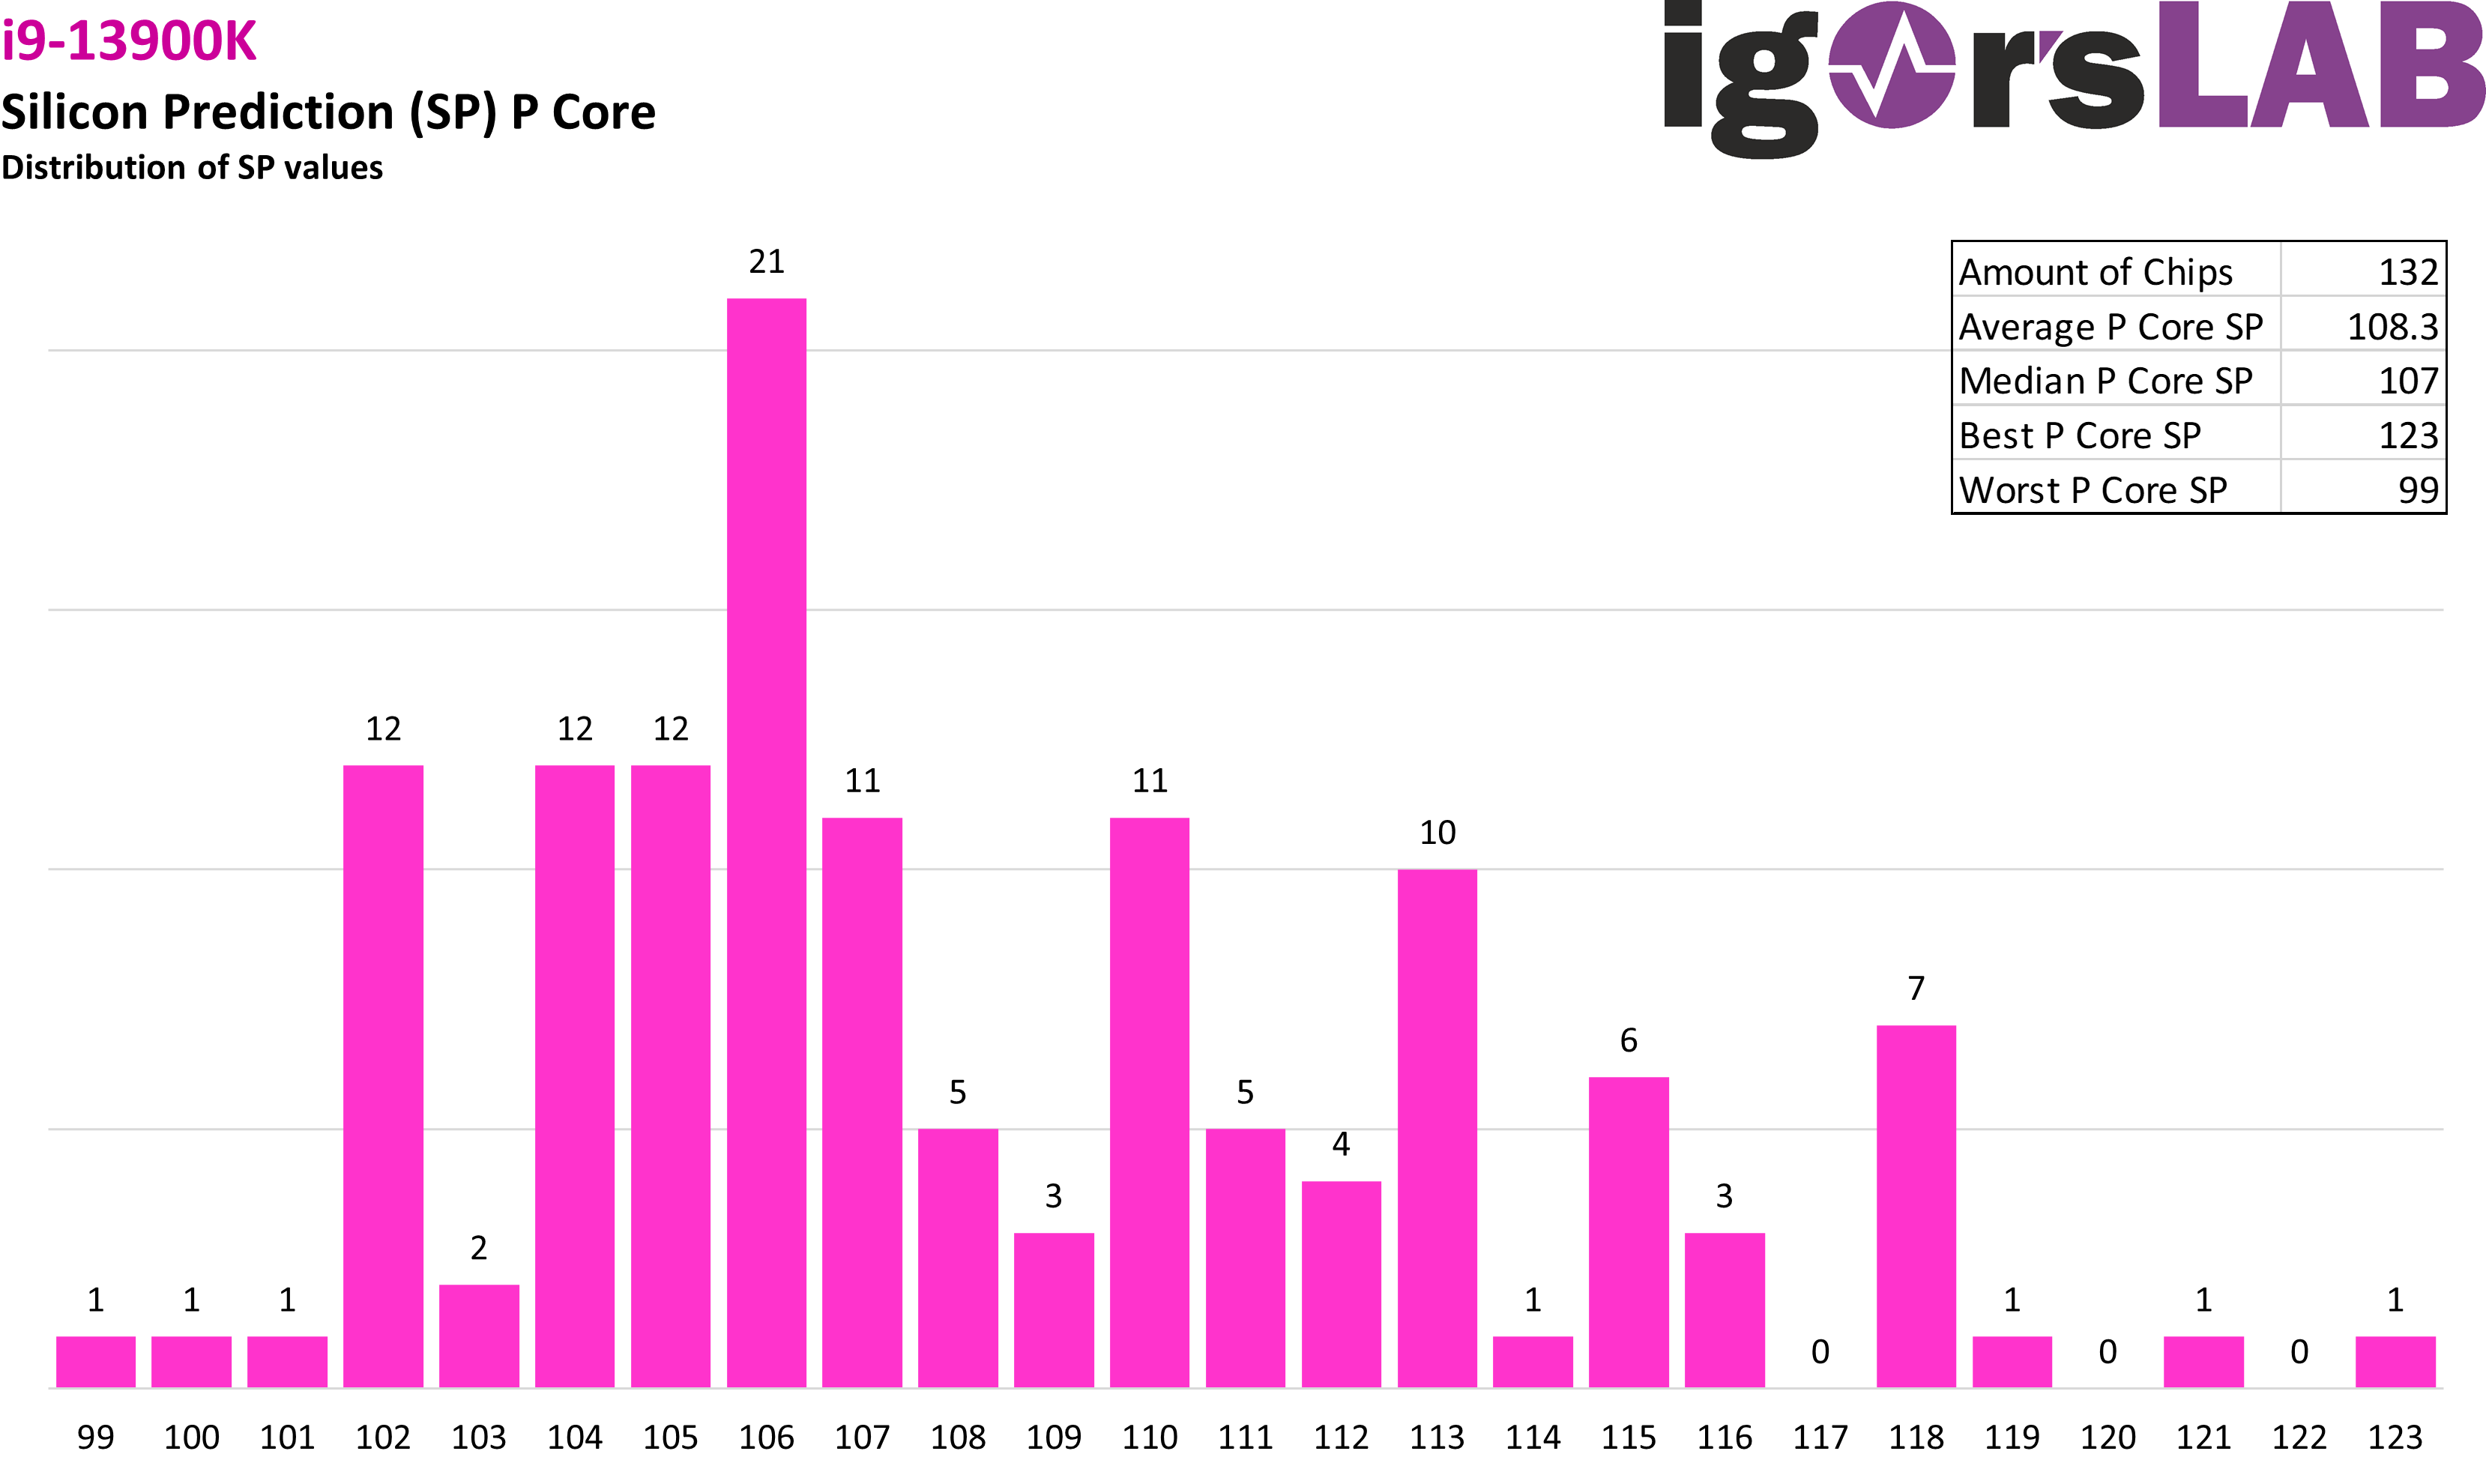
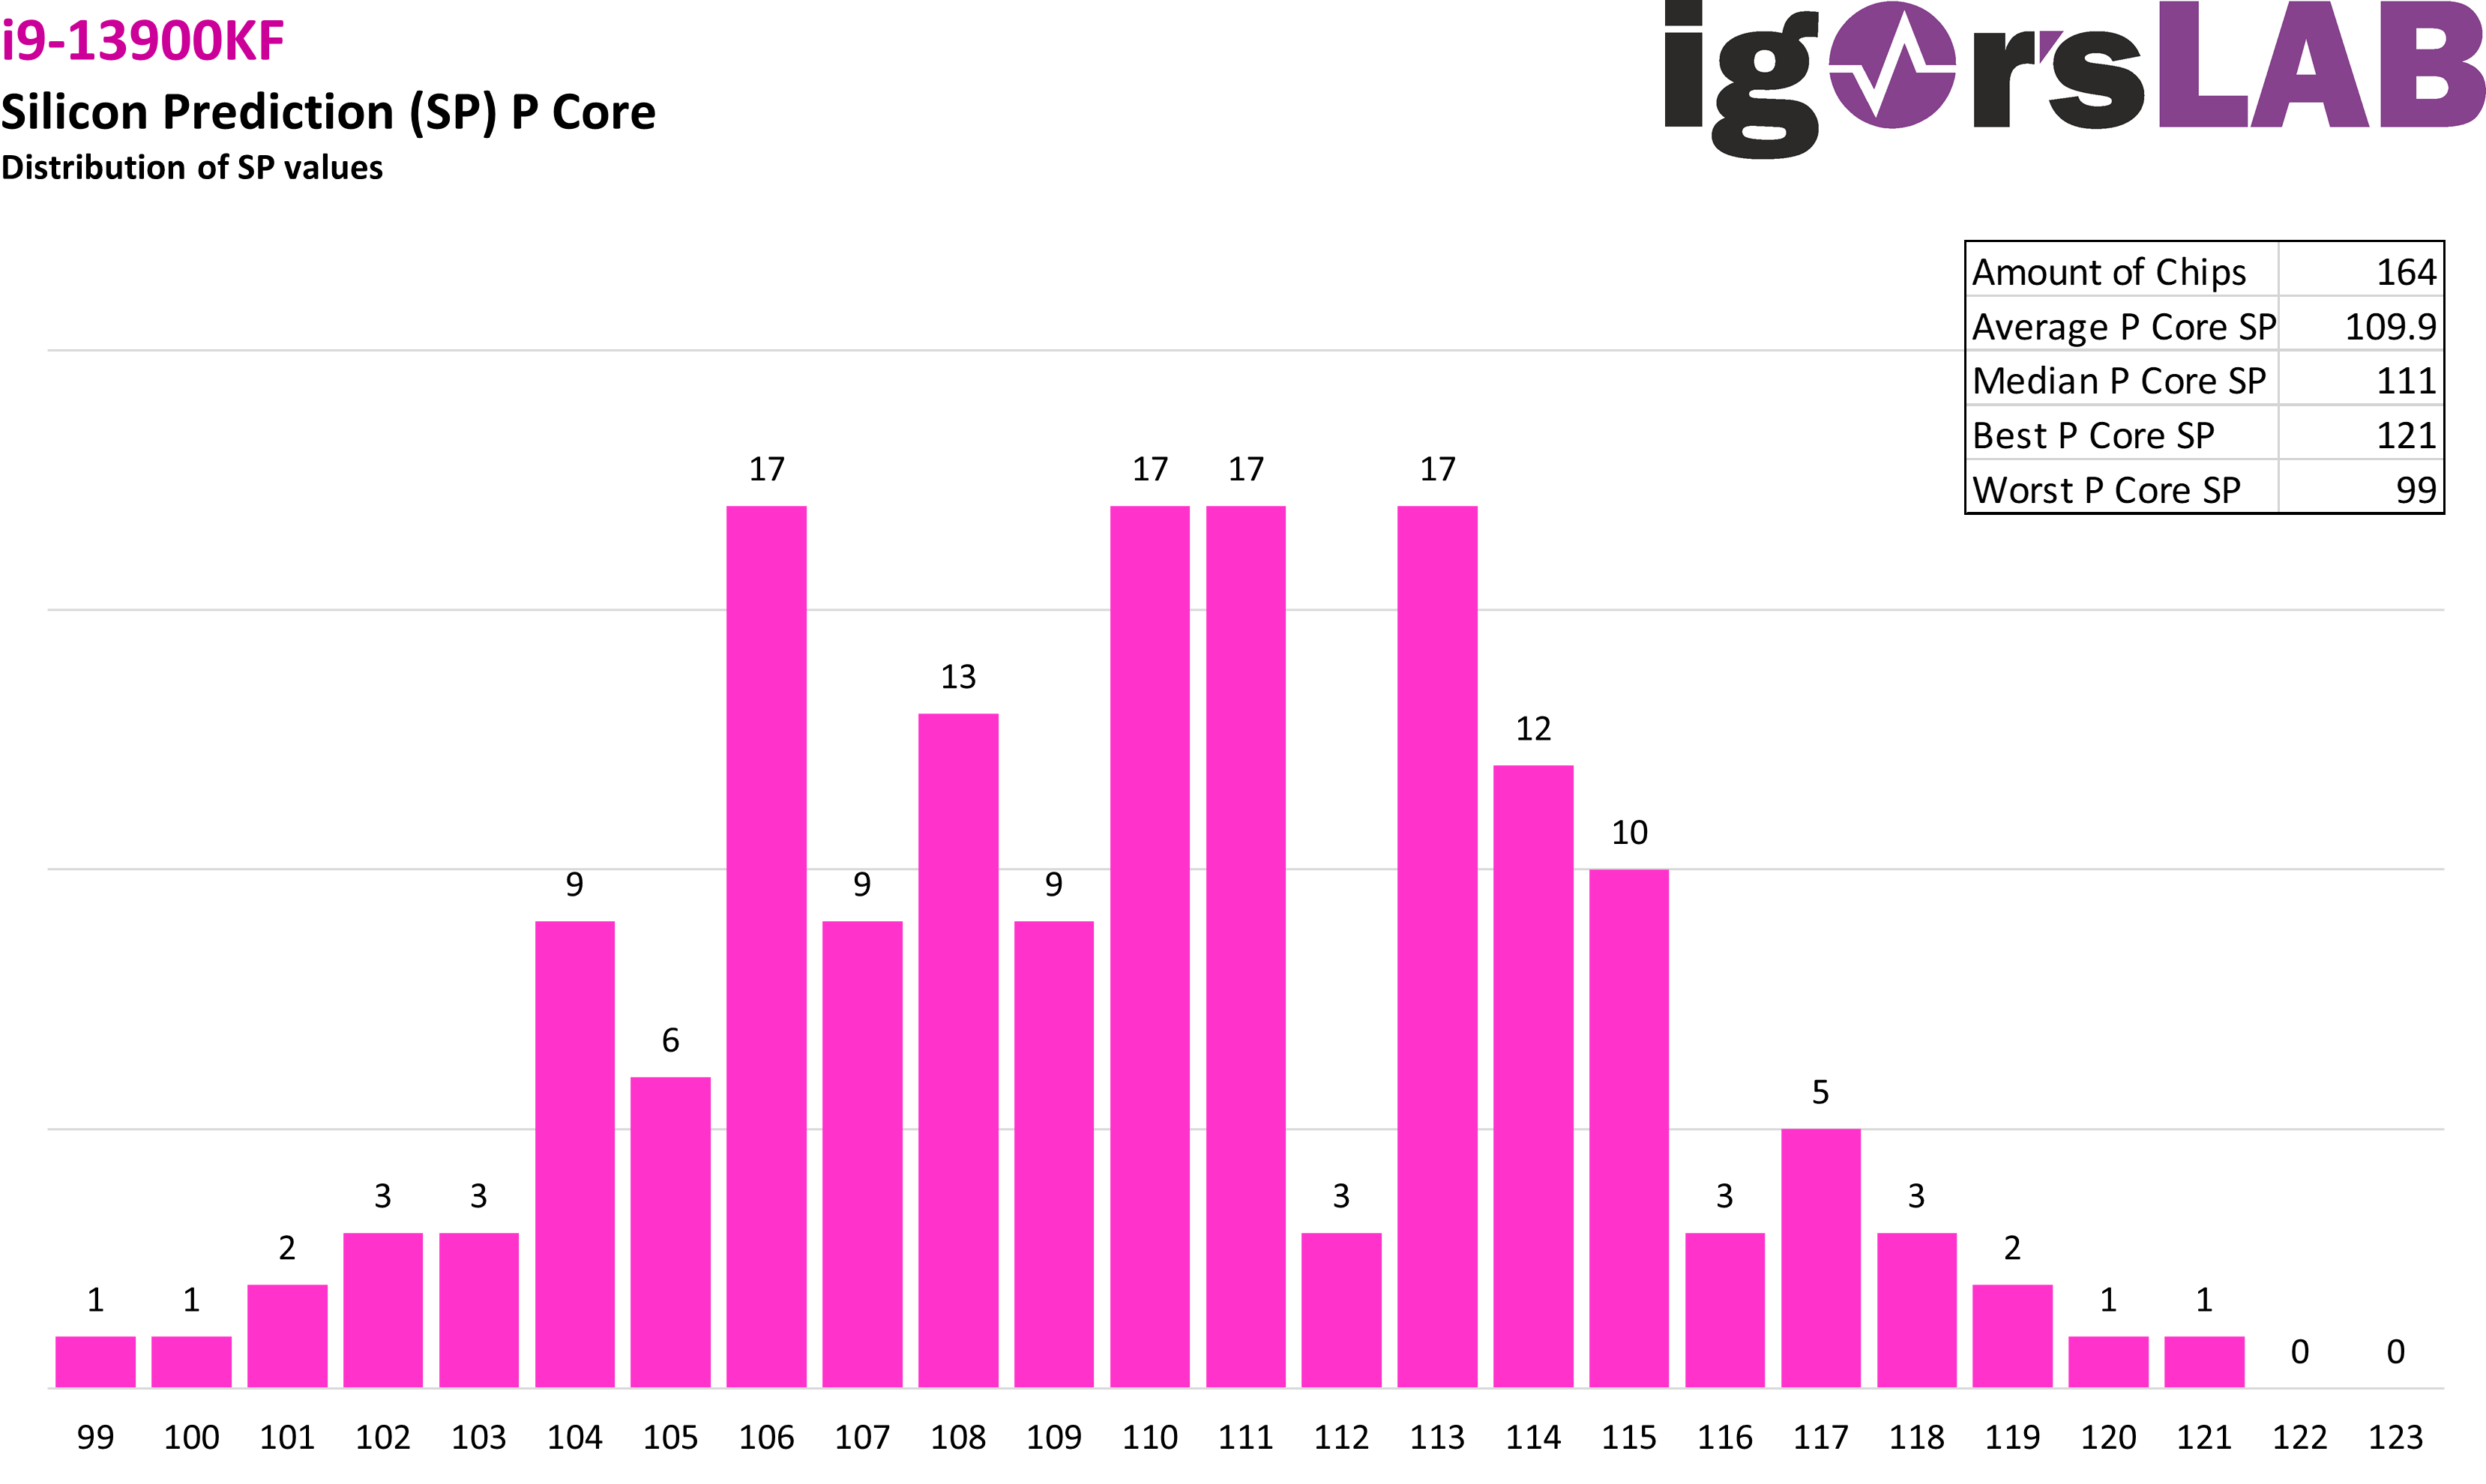
The total SP value is ultimately only a function of the individual SP values for P and E cores, so a CPU with worse P cores but better E cores can theoretically achieve the same total SP. Here you can see the individual SP values for the P cores per CPU. This again shows the different distribution between the two SKUs. Although the graph is filled from the minimum value of 99 for both types, the data for the 13900KF ends earlier again, while there is an even higher outlier for the 13900K. But these are only individual CPUs, which cannot really be considered as generally representative for the distribution. The average behaves almost analogously to the overall SP with a delta of 1.6 points with an advantage for the 13900KF SKU.


31 Antworten
Kommentar
Lade neue Kommentare
Urgestein
Veteran
Mitglied
Urgestein
Mitglied
Veteran
1
Urgestein
Moderator
Mitglied
Urgestein
Urgestein
Urgestein
Mitglied
Urgestein
Urgestein
Mitglied
Urgestein
Urgestein
Alle Kommentare lesen unter igor´sLAB Community →