


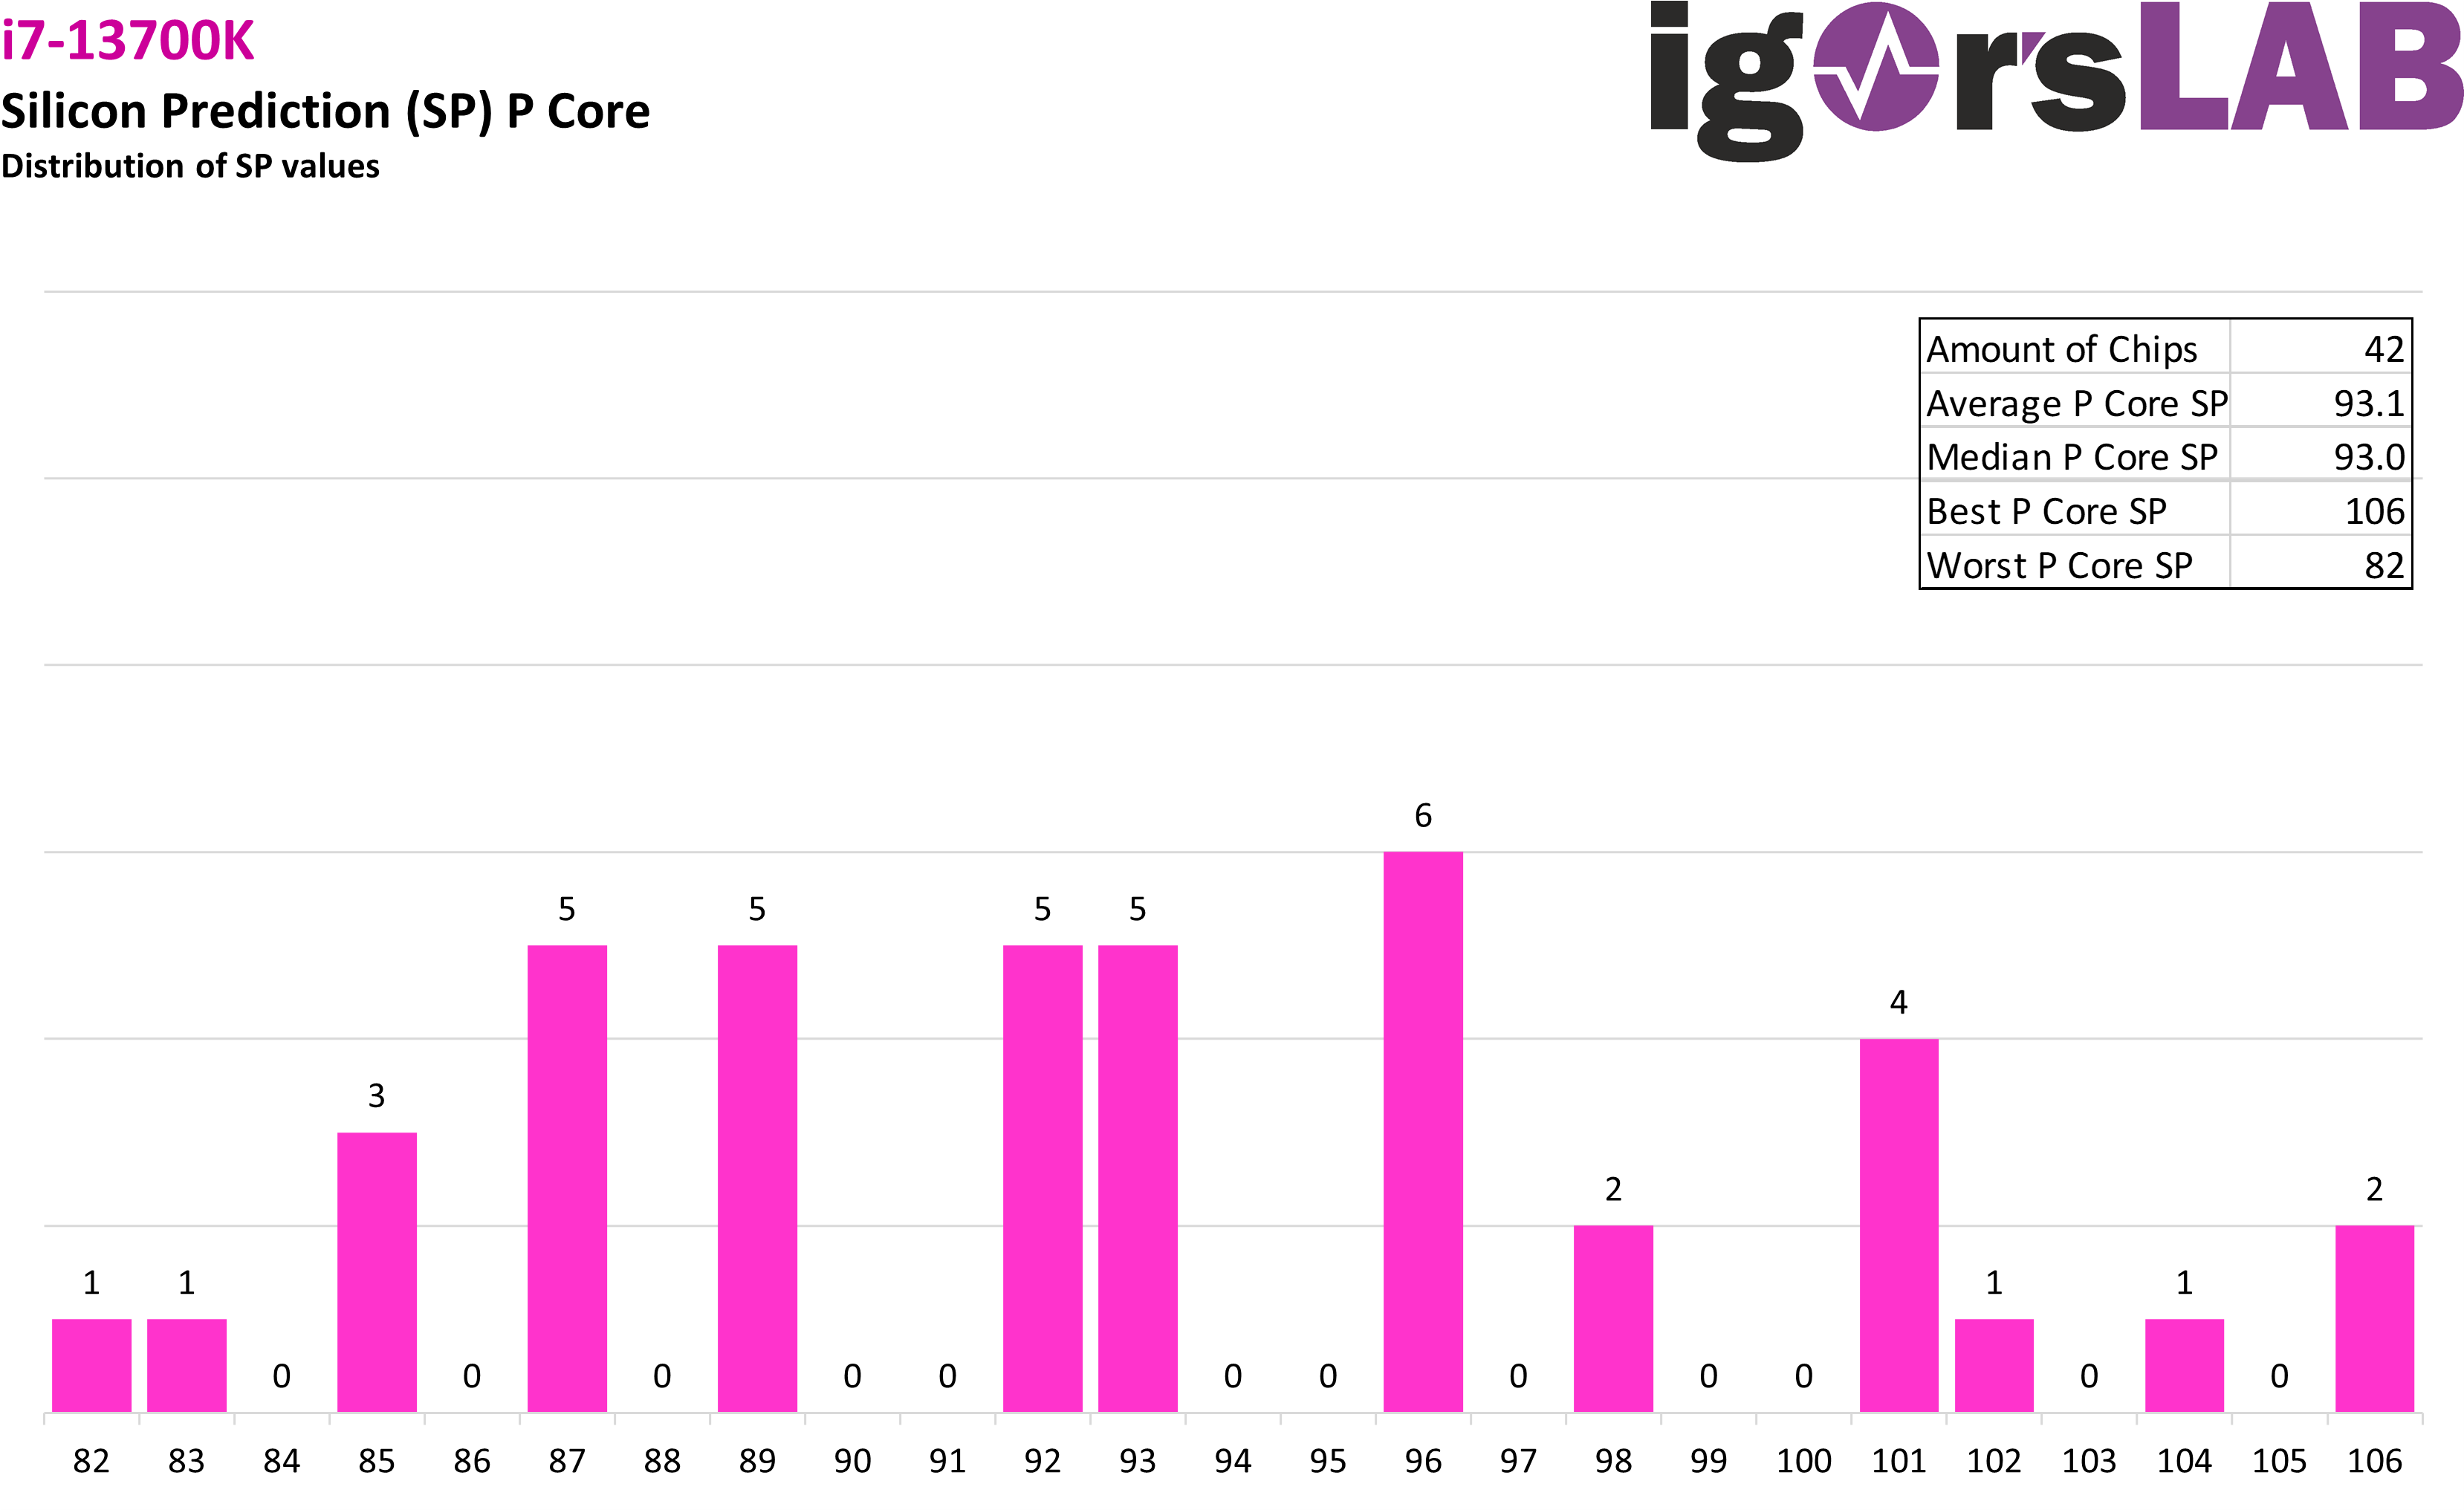
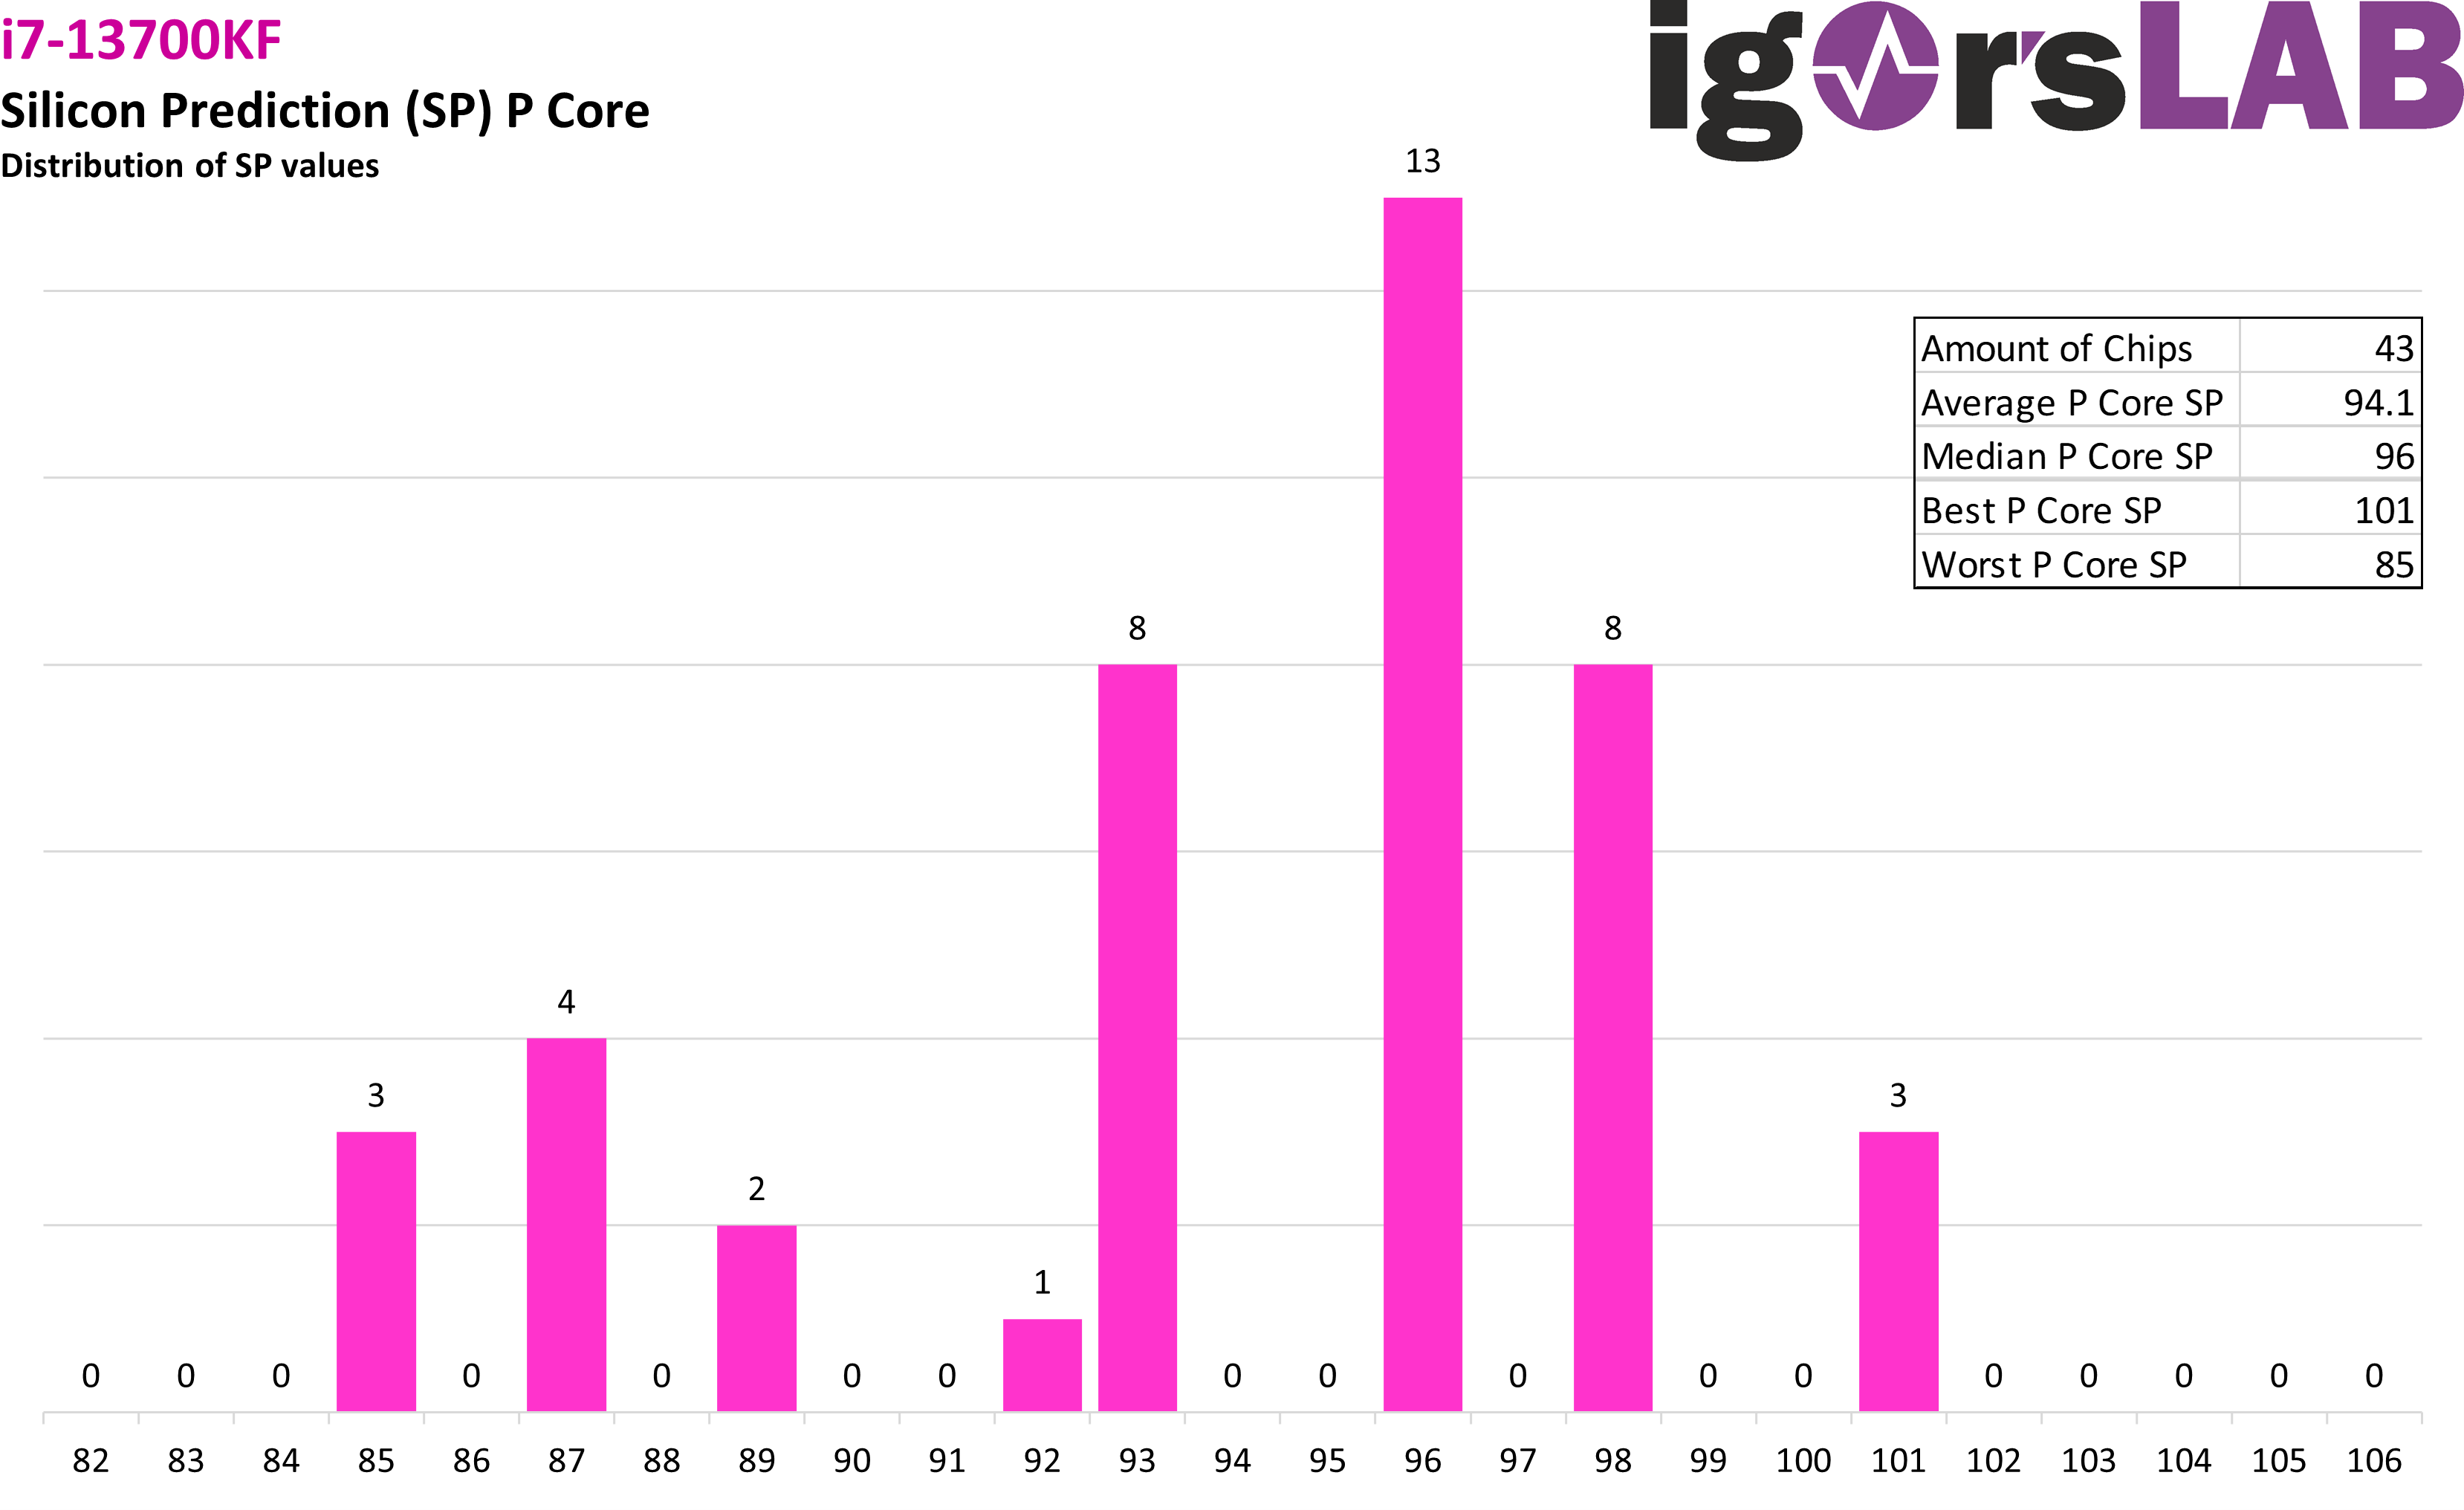
If we look only at the SP of the P kernels, we can again see the different shape of the accumulation curve here. Also, analogous to the overall SP, the trend can be seen here that the average SP is higher for CF, but CF has higher outliers upward, with up to a P-core SP of 106.


6 Antworten
Kommentar
Lade neue Kommentare
Urgestein
Veteran
Mitglied
Mitglied
Mitglied
Mitglied
Alle Kommentare lesen unter igor´sLAB Community →