


Temperature gradients and boost clock in detail
The GPU remains relatively cool, which on the one hand benefits the boost clock rates, but on the other hand is unfortunately also bought expensively. But I'll get to that in a while. So let's first consider the beat and temperature. Temperatures rise a little faster in the closed housing and fall at the end of the day. 2°C higher. This is not a broken leg. Unlike Nvidia's Boost, where whole boost steps are completely lost as the temperature rises, the Radeon VII clocks completely differently.
If we look at the course of time over the warming, one quickly markets that the map in an open structure, fully heated, between approx. 1500 and 1740 MHz. By the way, the jumps become visibly bigger and more frequent as the temperature rises. In the closed structure you can also see that the clock jumps also seem to be dependent on the speed of the warming and it even goes down sporadically up to 1367 MHz!
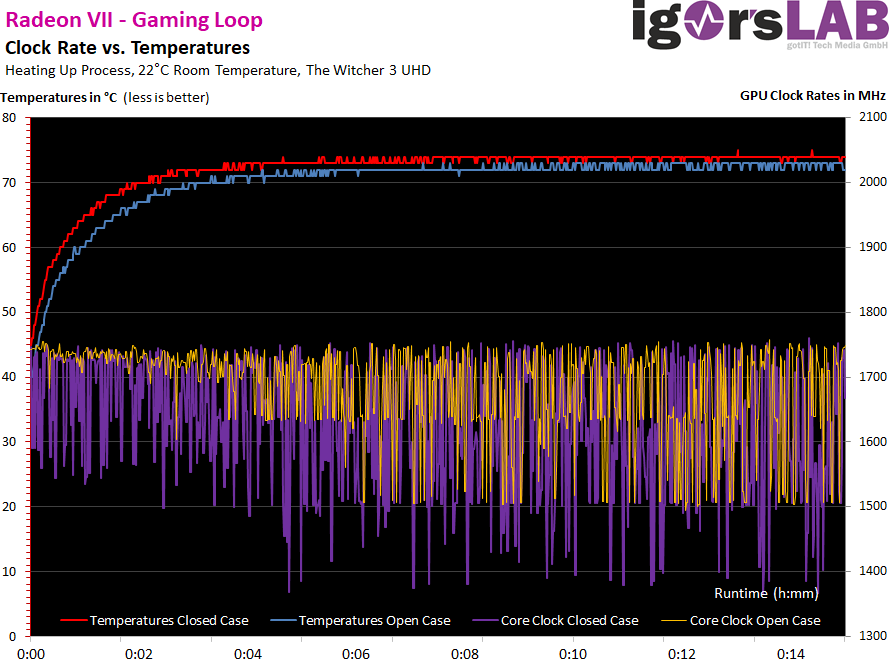
Since the fan speeds (we'll see right now) and the temperatures are in a very strict limit, the arbitrator tries from the beginning, especially through clock changes, to keep the system in balance. This behavior is very different from the solution for the Radeon RX Vega and the Geforce cards. I haven't seen such strong clock fluctuations on any map so far!
So there is actually no really fixed boost clock for the Radeon VII, so you have to distinguish between peak, minimum and average value. What a program like Wattman and 3DMark display are the pure maximum values, but their practical relevance should be strongly questioned. In order to be able to make reliable statements about the boost clock, one should use a duration of several seconds and form an average value from it. Everything else is just for the Gallery of Vanities.
And now the whole thing again in sober numbers in table form:
| Initial AMD Radeon VII |
Final value AMD Radeon VII |
Final value GeForce RTX 2080 FE |
|
|---|---|---|---|
| Open Benchtable | |||
| GPU Temperatures |
34 °C | 73 °C |
75°C |
| GPU clock | 1758 MHz | 1498 to 1741 MHz (alternating) |
1815 MHz |
| Ambient temperature | 22 °C | 22 °C | 22°C |
| Closed Case | |||
| GPU Temperatures |
36 °C | 75 °C |
75°C |
| GPU clock | 1755 MHz | 1367 to 1747 MHz (highly alternating) |
1800 MHz |
| Air temperature in the housing | 23°C | 46°C | 43°C |
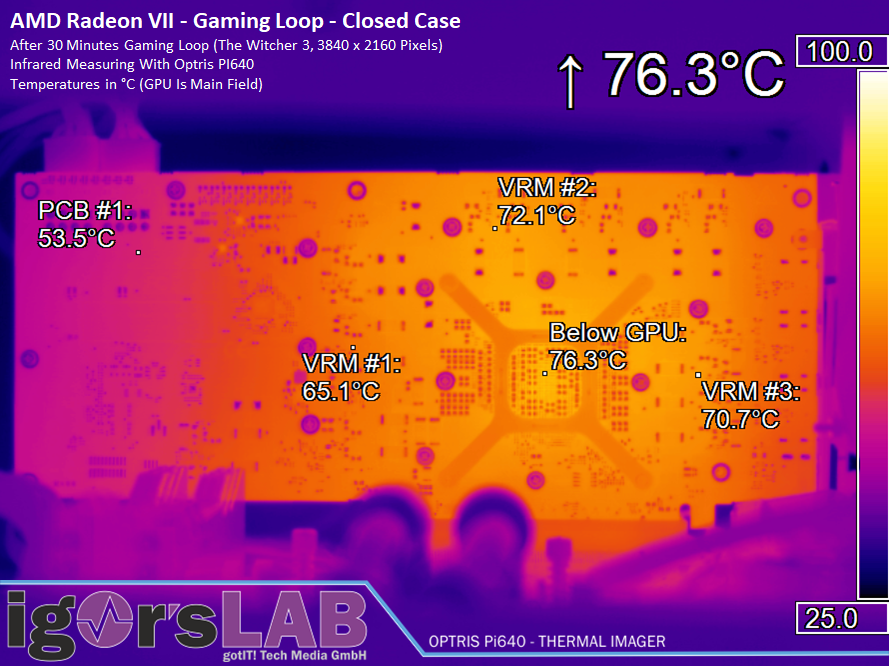
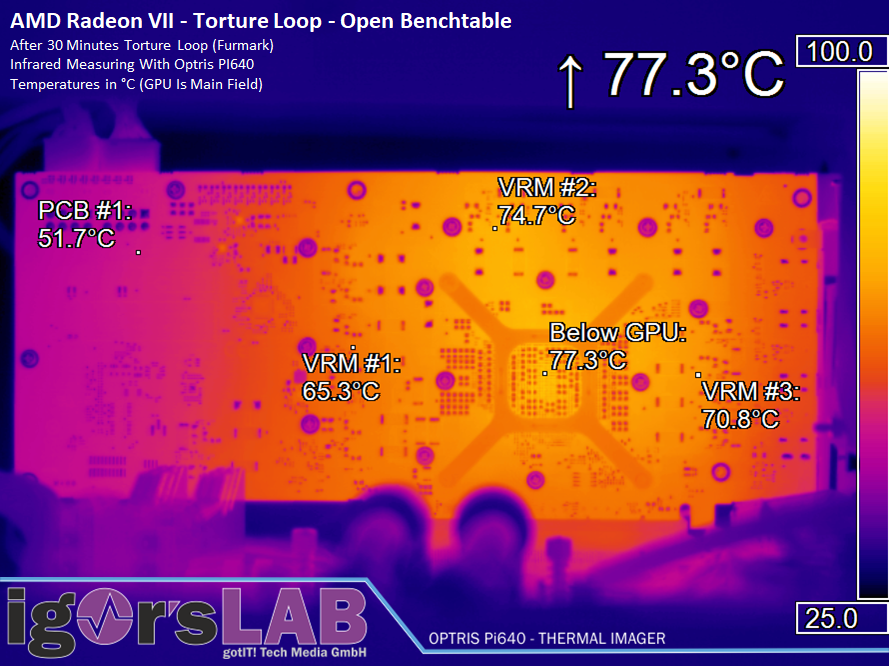
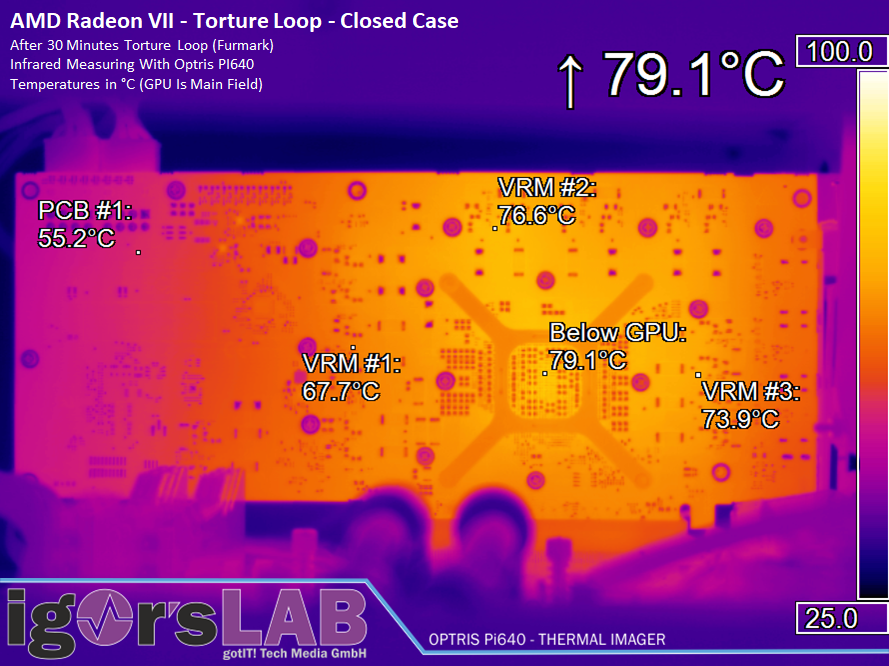
Board Analysis: Infrared Images
The board was brushed with special paint before the measurement and the system was calibrated via 4 unique reference points with thermal sensors. Due to the homogeneous coating, the emission level of the surface is at 0.975 measured, the degree of transmission of the very thin special film for the closed construction has been determined for the relevant measuring range under laboratory conditions and evaluated of the bolometer values. The angle of the measurement is exactly 90 degrees. measurements with an emission level of 1 on an untreated board and, if necessary, even at sharper angles would be completely worthless and would also yield far too low results.
The following infrared images for the gaming and torture loops in open construction and in closed housing are very meaningful. Unlike Wattman, where logging the data was problematic to impossible, my camera is completely incorruptible and, above all, reliable.
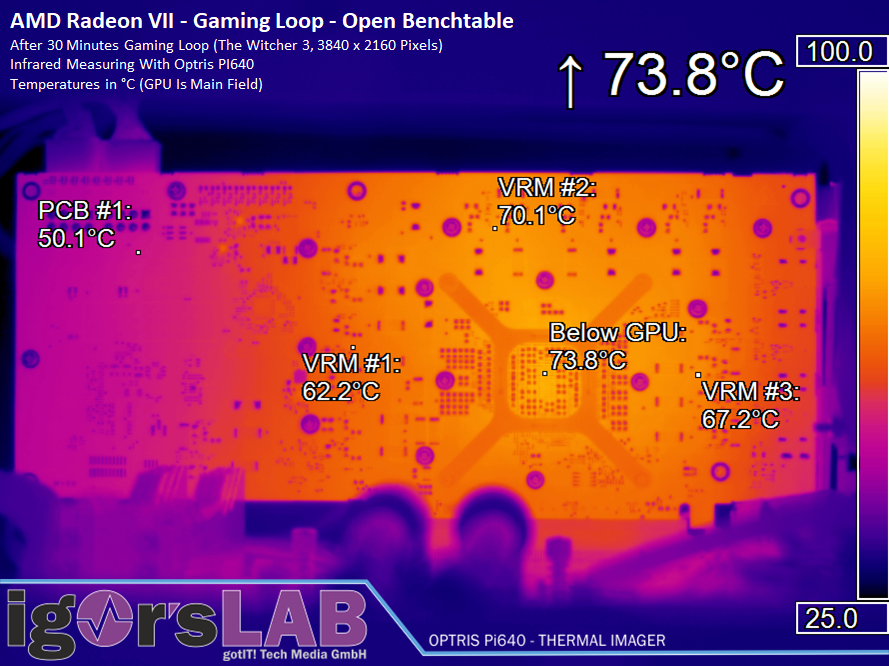
The differences in the gaming loop between the open and closed setup are visible, but are with in the expected range of 2-3 degrees.
The Torture-Loop notices the up to 20 watts higher power consumption of course, because exactly this value is also dissipated as waste heat. It is interesting that the temperature below the package is higher than the value that Wattman communicates as GPU temperature. Measurement errors are definitely excluded.
This image is reinforced once again in the closed housing and at 79°C the hottest spot almost scratches at the 80°C mark. Unfortunately, we could not log the stress test with Wattman, because the program returned us completely pointless values and in many measurements after only a few lines simply suspended the logging. But at least we have the values of the camera.
In summary, however, it can be said that the cooler does its job well in the delivery state. We see and hear how loudly he does it on the next page.
- 1 - Einführung und Daten
- 2 - Vega20 - Was ist neu?
- 3 - Tear Down: Platinen-Analyse und Kühlerdesign
- 4 - Anwendungsbenchmarks
- 5 - Ashes of the Singularity: Escalation
- 6 - Battlefield V
- 7 - Destiny 2
- 8 - Tom Clancy's The Division
- 9 - Far Cry 5
- 10 - Tom Clancy's Ghost Recon
- 11 - Grand Theft Auto V
- 12 - Metro Last Light (Redux)
- 13 - Rise of the Tomb Raider
- 14 - The Witcher 3
- 15 - Wolfenstein II: The New Colossus
- 16 - Leistungsaufnahme und Netzteilkalkulation im Detail
- 17 - Temperaturen und Infrarot-Analyse
- 18 - Lautstärkemessungen mit Video und Analyse des Spektrums
- 19 - Zusammenfassung und Fazit


Kommentieren