


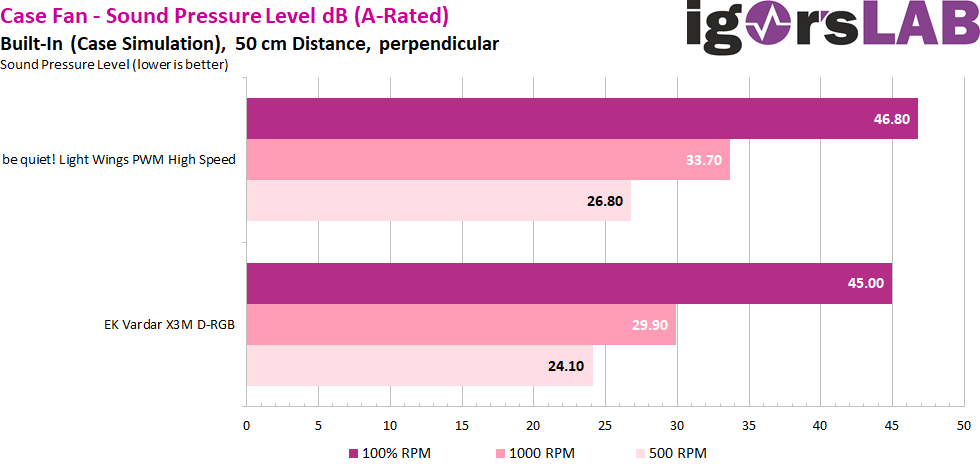
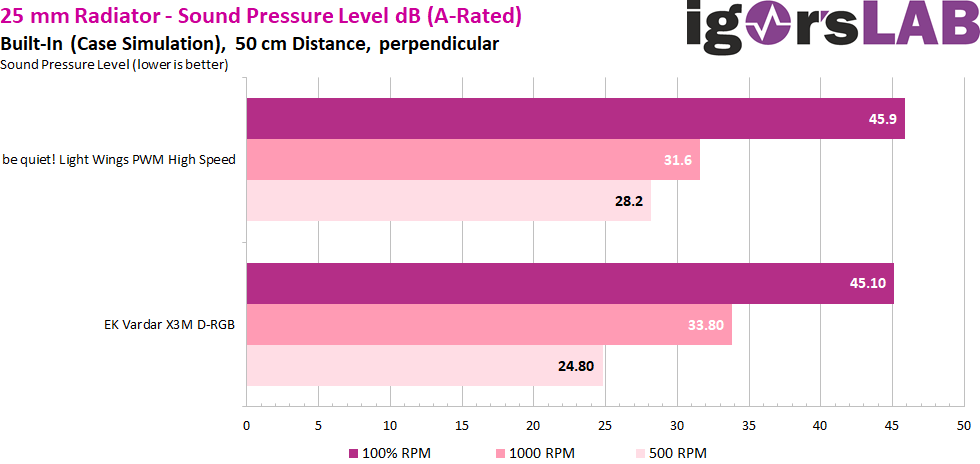
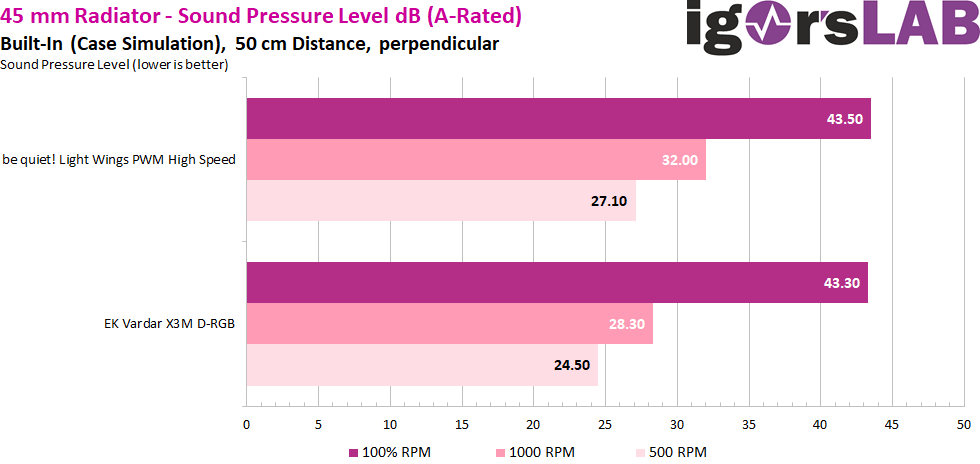
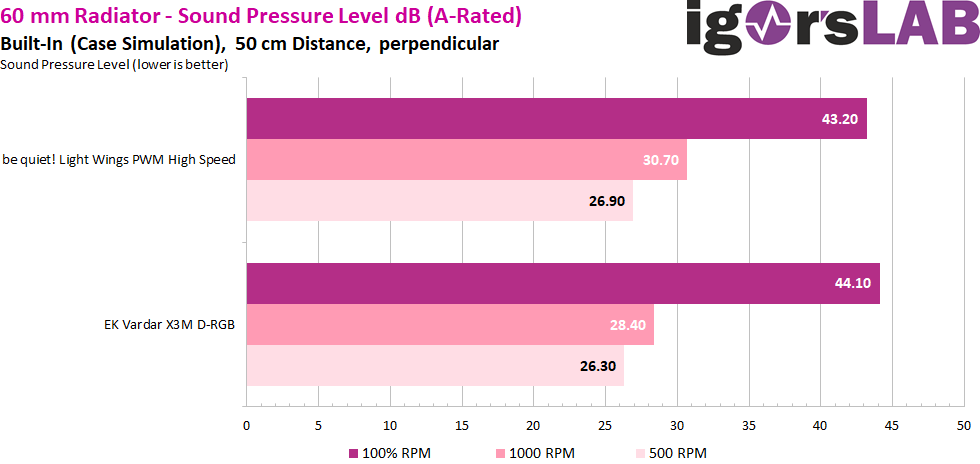
If you compare the absolute values with those of the reference, the EK fan cuts a good figure. Not only is it a little quieter, but it also manages more throughput. For this very reason we added a very complex measurement in 5 cfm steps at the end, which puts the sound pressure level as a curve over the entire speed range in relation to the volume flow. And also there you can score very well
Sound comparison (recording) at 100% speed
As just mentioned, the subjective feeling is a slightly more distinct noise from the motor and the rotor blades, which is of course also due to the different speeds. The EK fan produces slightly less motor noise, with the reference fan other than loud. On the contrary, because the acoustic impression at the measuring microphone is also somewhat deceptive here.
The recordings of the sound files, not the measurements themselves (!), were not made with the measuring microphone for logistical reasons and for one time only, but we will return to the original for all further tests. Therefore, we have to think away the noise at the EK audio files, that does not come from the fan. The measurements themselves were thus unaffected by this.
EK Vardar X3M 120 mm DRGB
Be Quiet! Light Wings 120 mm HS
Sound comparison (recording) at 1000 rpm
The sound carpet is subjectively almost the same, you can really leave it like that
EK Vardar X3M 120 mm DRGB
Be Quiet! Light Wings 120 mm HS
Total speed range (300 to 1800 rpm)
Before I will explain the frequency analysis of the recorded spectrum to you, there is already the dreaded “station search”, where we will play through the fan operation from the lowest to the highest speed. And please don’t be alarmed, we’ve amplified the whole thing a bit so you can hear it better. So don’t set your listening level too high, though – it’s not particularly extreme this time. The Arctic P14 was a completely different calibre…
If the speakers have survived the whole thing up to this point, let’s now go into more detail.
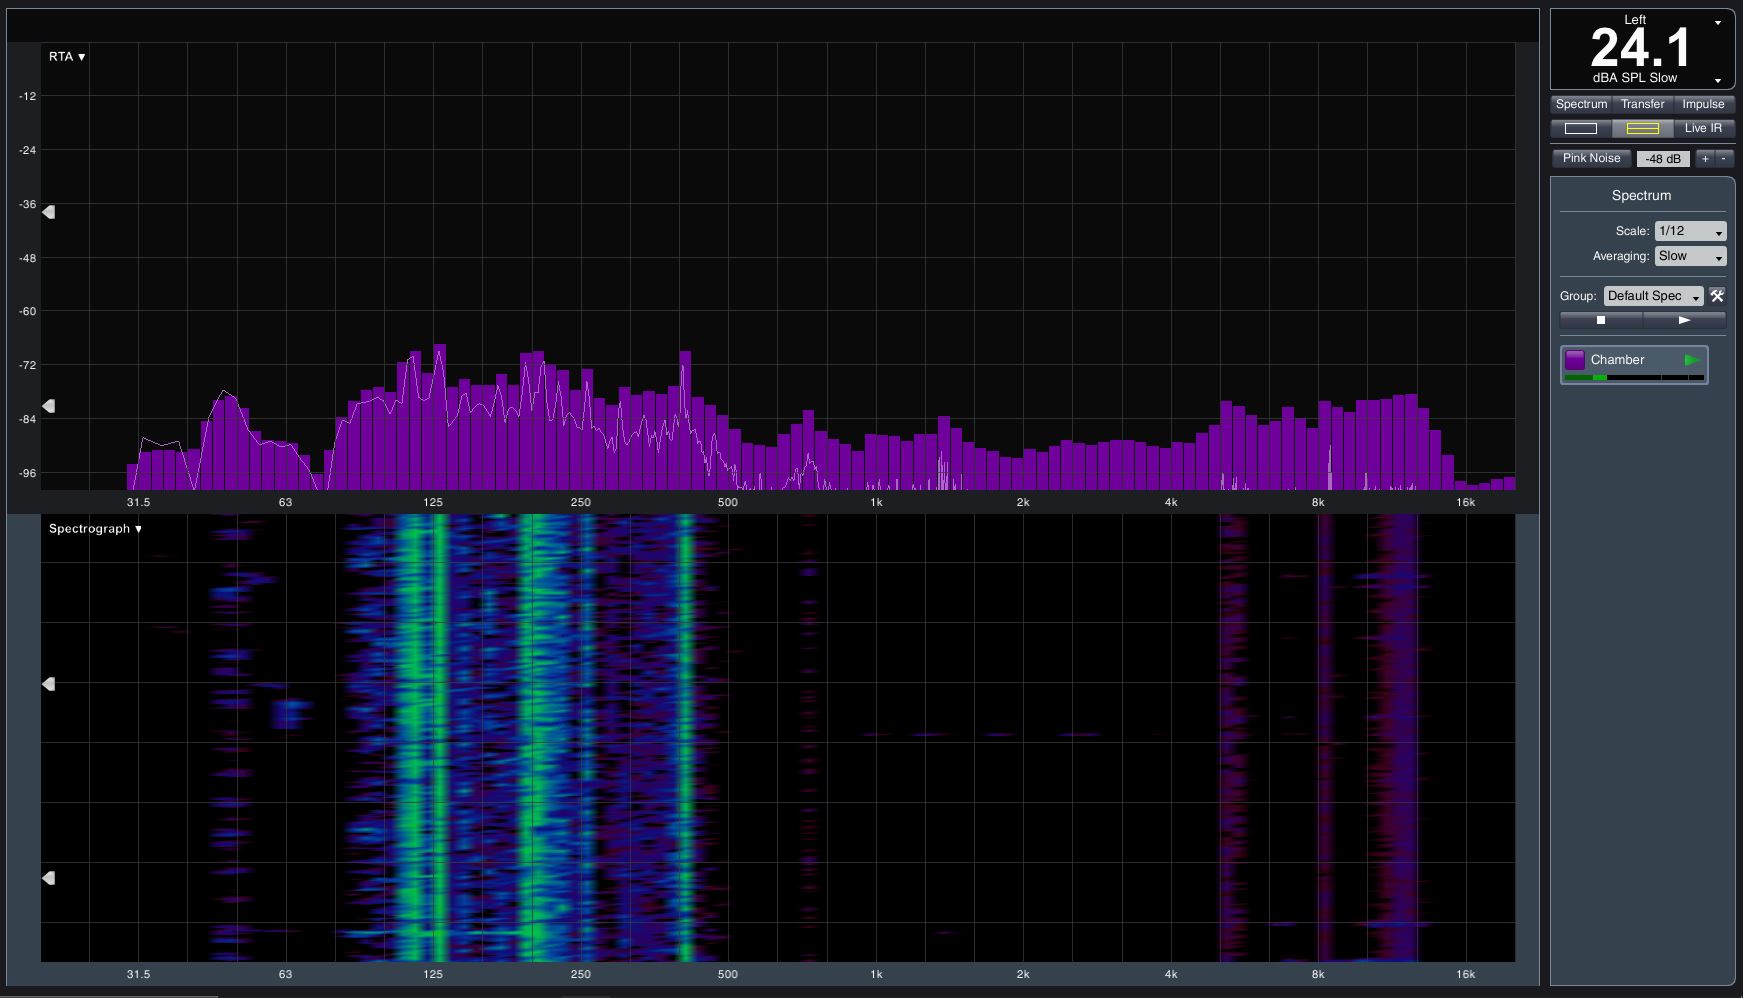
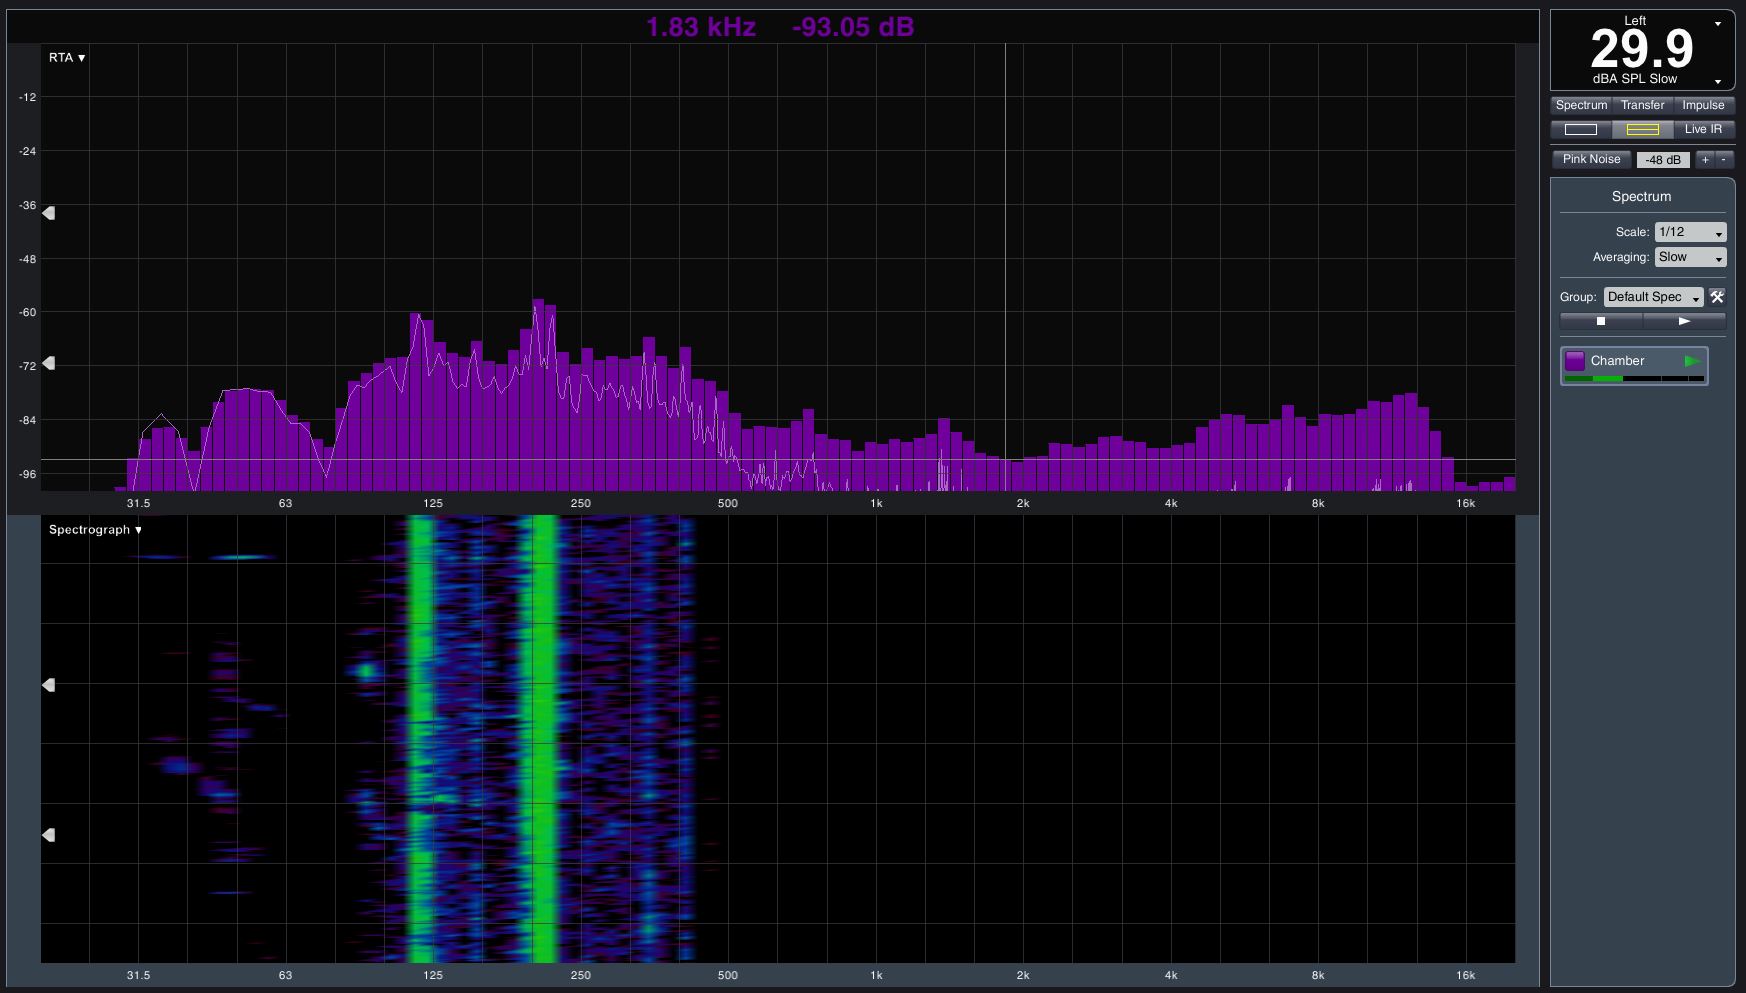
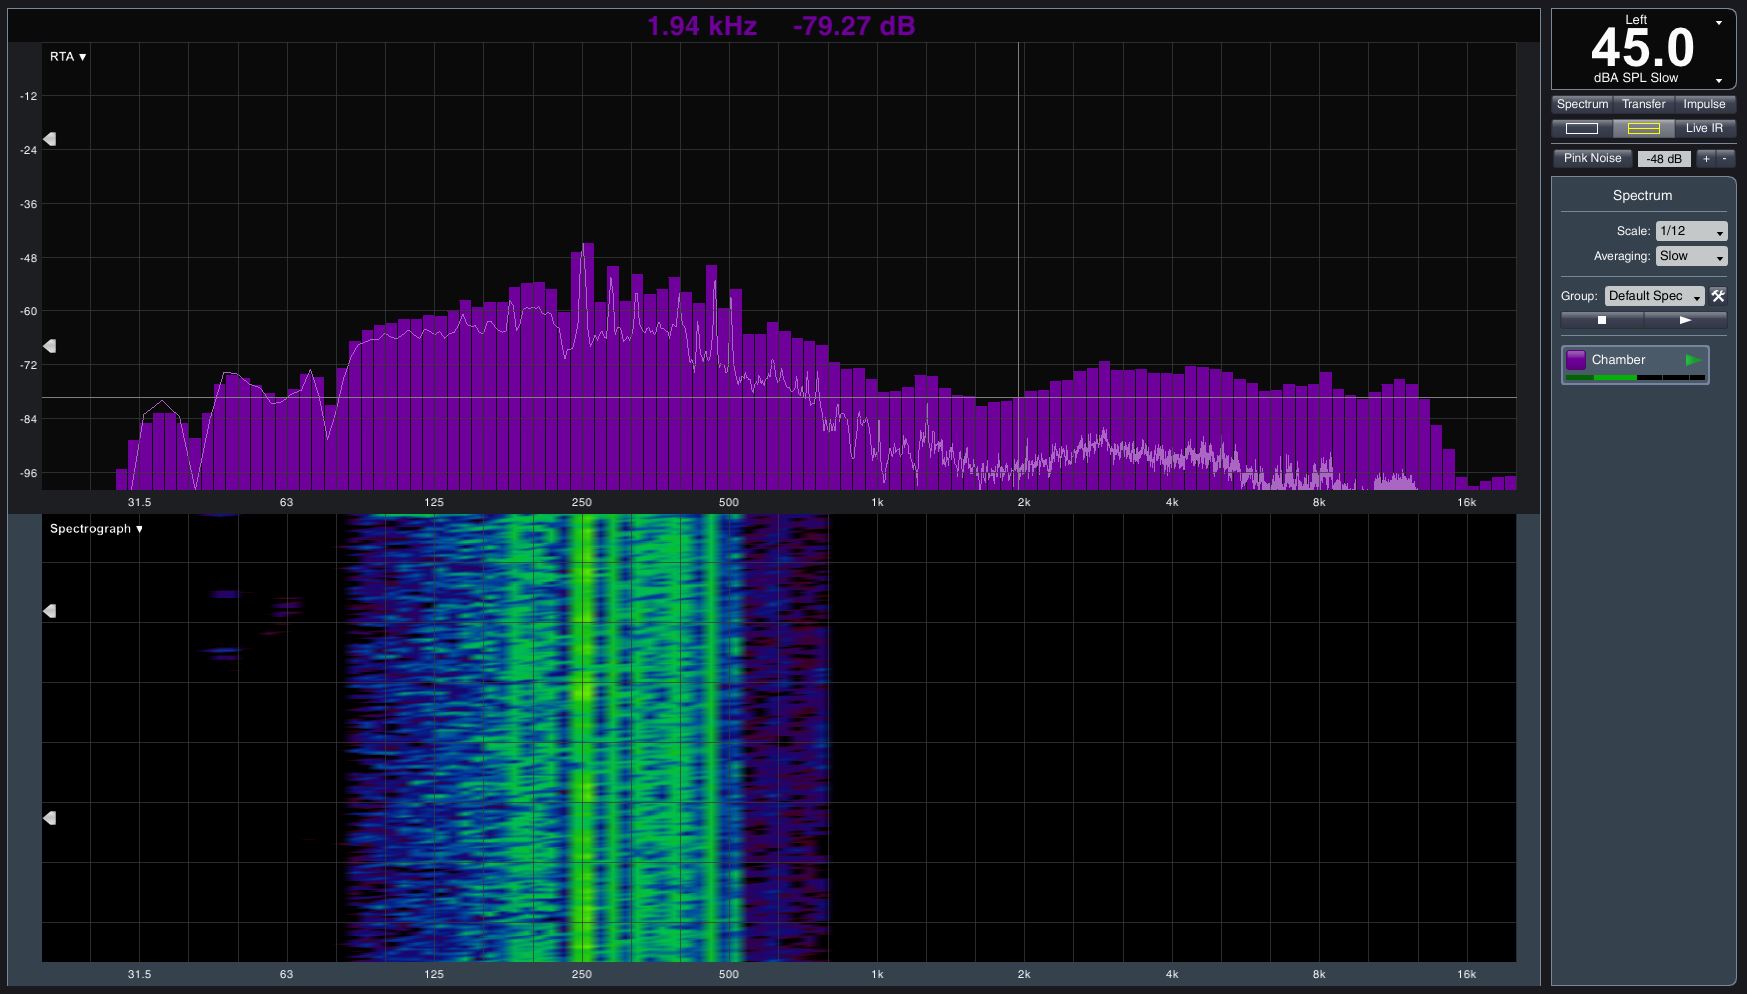
Frequency spectrum in the housing
Let’s look at the frequency analyses of all measurements and all three speeds tested. The graphs speak for themselves, as you can also see a small lower frequency peak of the engine at full speed quite clearly:


15 Antworten
Kommentar
Lade neue Kommentare
Urgestein
Veteran
1
Urgestein
Urgestein
Veteran
Urgestein
Veteran
Urgestein
Mitglied
Urgestein
Urgestein
Mitglied
Urgestein
Mitglied
Alle Kommentare lesen unter igor´sLAB Community →