


Rendering with Cinebench, Blender and LuxRender
Because we already know from Inventor Pro that the new CPU likes ray tracing, we are certainly not surprised by the following results. This thing is practically a number cruncher. Even if I don’t actually like it, as the Cinebench R23 delivers rather inconsistent results, you can of course still make a correct statement overall. The performance of the Ryzen 9 9950X in rendering is beyond any discussion and speaks for AMD, as it clearly beats the Intel Core i9 -14900K even without its latest microcode fix. Incidentally, the interesting thing is that the power consumption cap still works here, as I only measured a good 199 watts at the peak.

Logically, the expected picture emerges again in the single-thread performance and the Ryzen 9 7950X doesn’t stand a chance.

Of course, it’s the same as always: a good renderer needs a powerful core feed, that’s always been the case. My beloved igoBOT is a thankful task, even if rendering on the CPU is slowly going out of fashion. But before I use things like Cinebench as the sole benchmark, I prefer to run something like this, which can take a few minutes of work and deliver very consistent results. And it can also heat. And much, much better.

Once again, we see the Ryzen 9 9950X, which so far has practically driven everything into the ground that didn’t make it to the top of the trees. And it’s finally enough for the Core i9-14900K. But we’ll see what that means at the socket in a moment. Unlike the Ryzen 9 7950X months ago, the Ryzen 9 9950X doesn’t break any TDP specifications with a cool gesture of nonchalance. No, this time it stays cool!

The Luxmark as a decoupling of the LuxRender suite shows a very similar positioning in the score, whereby the Ryzen 9 9950X can more than just clearly overtake the former AMD flagship. It even outclasses it. The rest of the CPUs, including those with a 3D cache, are in line with the rest of the industry.

LTspiceXVII
New in my benchmark suite is LTspiceXVII, a circuit simulation program. The simulator is designed to run industry standard semiconductor and behavioral models. New circuits can be designed using the integrated schematic capture. Simulation commands and parameters are placed as text on the schematic using standard SPICE syntax. Waveforms of circuit nodes and device currents can be recorded by clicking on the nodes in the schematic during or after simulation.
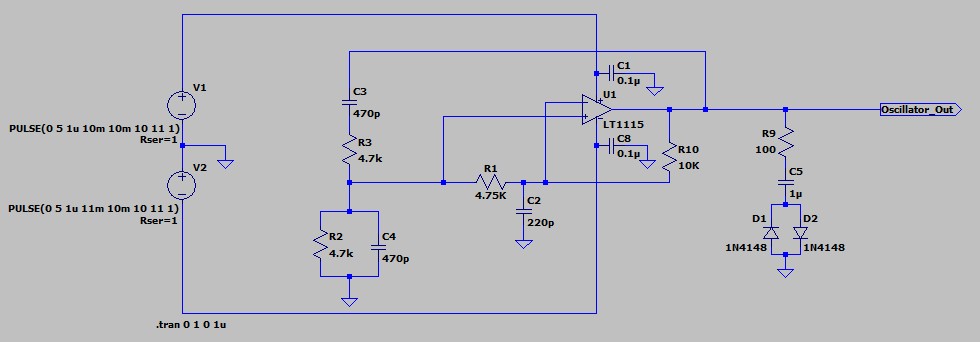
A total of 16 threads are used in the benchmark, which of course makes the CPUs with 8 cores or more slip closer together at the top. Nevertheless, the Core i9-14900K beats all the rest, including its predecessors and the Ryzen 9 7950X, which leads the AMD runners-up. The Ryzen 9 9950X has its dreaded dropouts again, for whatever reason.


Encoding, Financial Service and Programming
The first two benchmarks also benefit many cores again, whereby FSI is pure compute. This is still AMD’s domain, especially since Intel performs weaker overall in FSI than in Handbrake. However, Zen fails miserably here, as the Ryzen 5 9600X also performs far below its theoretical capabilities.

Only Handbrake can reconcile this somewhat. It was also necessary.

Intel is once again the measure of all things in Python and even more so in Octave, even if the Ryzen 9 7950X was temporarily in the lead. Now it is no longer. In Python, as in Math Lab, Intel’s Math Kernel Library (MKL) is used in many areas. AMD CPUs have suffered a little in the past, especially in NumPy. However, the Core i9-14900K remains the old and new Terminator and the rest follows the usual trend. Ok, minus the microcode fix it could be at least a tie.

The next workload uses Octave, a programming language for scientific computing, to solve a variety of mathematical operations. The differences between the bar lengths of the CPUs are much smaller, but the two Core i9s in particular benefit from clock speed across the cores and are far ahead of all other CPUs, except for the Ryzen 9 9950X, which just had another bright moment.


- 1 - Einführung, Vorbemerkung und CPU-Daten
- 2 - Test-Setup und Methoden
- 3 - Gaming Performance HD Ready (1280 x 720 Pixels)
- 4 - Gaming Performance Full HD (1920 x 1080 Pixels)
- 5 - Gaming Performance WQHD (2560 x 1440 Pixels)
- 6 - Gaming Performance Ultra-HD (3840 x 2160 Pixels)
- 7 - Autodesk AutoCAD 2023
- 8 - Autodesk Inventor 2021 Pro
- 9 - Rendering, Simulation, Financial, Programming
- 10 - Wissenschaft und Mathematik
- 11 - Workstation: Leistungsaufnahme und Effizienz
- 12 - Gaming: Leistungsaufnahme und Effizienz
- 13 - Zusammenfassung und Fazit


30 Antworten
Kommentar
Lade neue Kommentare
Mitglied
Urgestein
1
Veteran
Veteran
Mitglied
Mitglied
Mitglied
Urgestein
Urgestein
Veteran
1
Urgestein
Urgestein
Urgestein
Neuling
Urgestein
Veteran
Neuling
Alle Kommentare lesen unter igor´sLAB Community →