


Detailed analysis with different core numbers
I created the following 32 test series by completing all 16 variants of the possible core count once with and once without SMT. The number of used cores I did deliberately with Windows 10, so that I reduced the “number of processors” of the variant without SMT by one. This works really well and saves me the tedious BIOS fiddling. With the variants with SMT I reduced it in two steps. Windows is clever enough, for example, to use two “processors” with SMT at the end of a single core, but with both possible threads. The scheduler also plays a perfect role here. If this weren’t the case, the following values would also show severe anomalies. But that’s exactly what they don’t do!
At one core (no matter if with SMT or not) the Ryzen 9 clocks well above 4.7 GHz, at two it breaks away and at the end 4.2 GHz remained at all cores, after all. This also explains the advantage over the Intel Core i9-9960X, which ran much slower with a maximum of 3.9 GHz on all cores, but more entertaining at the power outlet. Let’s first consider the pure render time for the variants with different numbers of cores, because there is already the first interesting finding to be reported here:
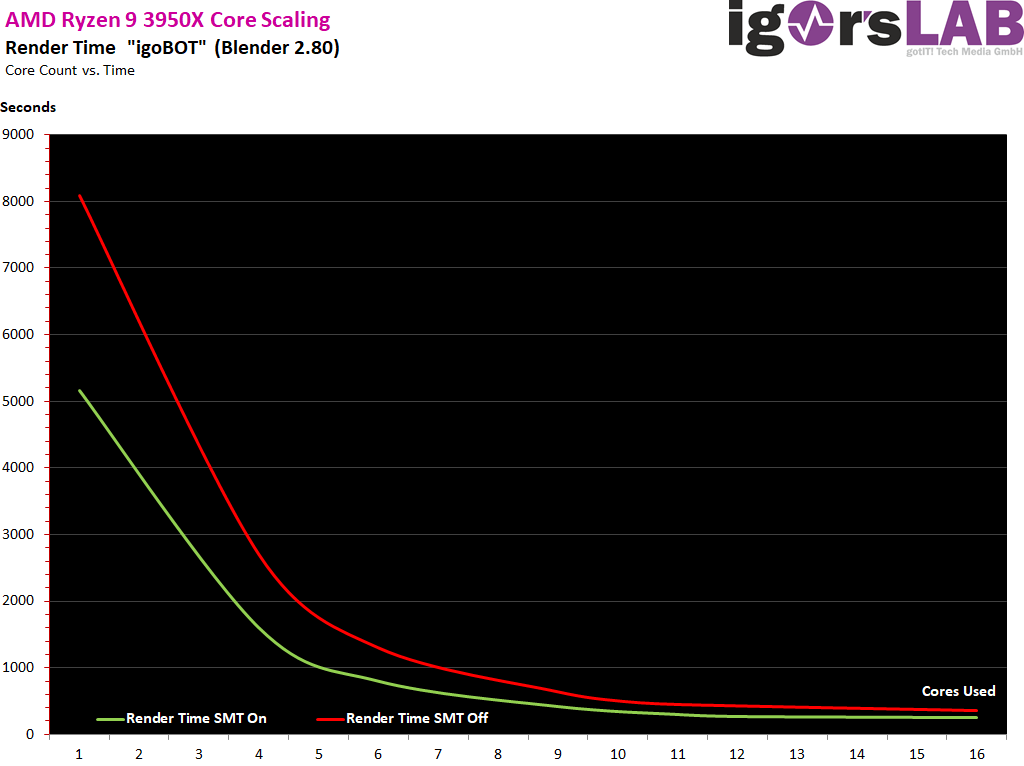
If you look at the render times, there are two bends in the curves, which are even positioned quite similarly in both curves. At 10 and below 5 cores, the increase of the render time in relation to the cores changes very much. So you can see very well that Blender can make the biggest performance jump per added core with up to 5 cores and that it scales quite well with up to 10 cores. Everything beyond that leads to further improvements, but the scalability of the task is finite.
Even if e.g. a twelve-core like the Ryzen 9 3900X is a bit behind in the overall second, it is still the cleverer CPU in the end. And the 8-cores, which some people would like to replace today rather than tomorrow, are once again a class smarter at Blender when it comes to the pure price/performance ratio. That’s a consolation to all those who didn’t get one. As far as the power consumption per core used is concerned, I have also noted once again in the next curve, which can also show that the 8 cores are even more efficient when the parallelizability reaches its limits. And for all those who are now coming with Cinebench: it doesn’t really look any different there.
But what does such a processor core have on average if you look at the CPU individually and divide the measured power consumption values by the number of cores? Interestingly enough, my values are only slightly above what HWInfo outputs per core with this motherboard as a value, whereby this is of course also a pure arithmetic value, but it is determined more granularly. Both curves show the clock drop with more than one or two cores and the kink from 8 to 10 cores. With 11 cores, the lowest value per core can be determined, at least in Blender. This also makes the Ryzen 9 3900X appear more positive when it comes to pure reason.
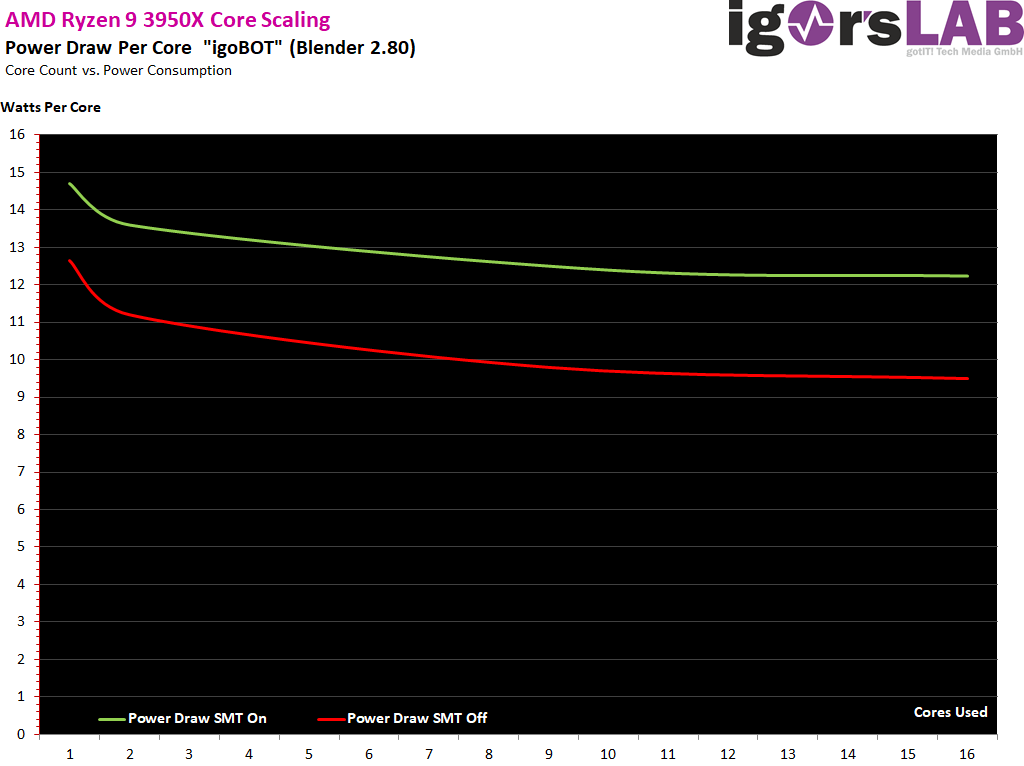
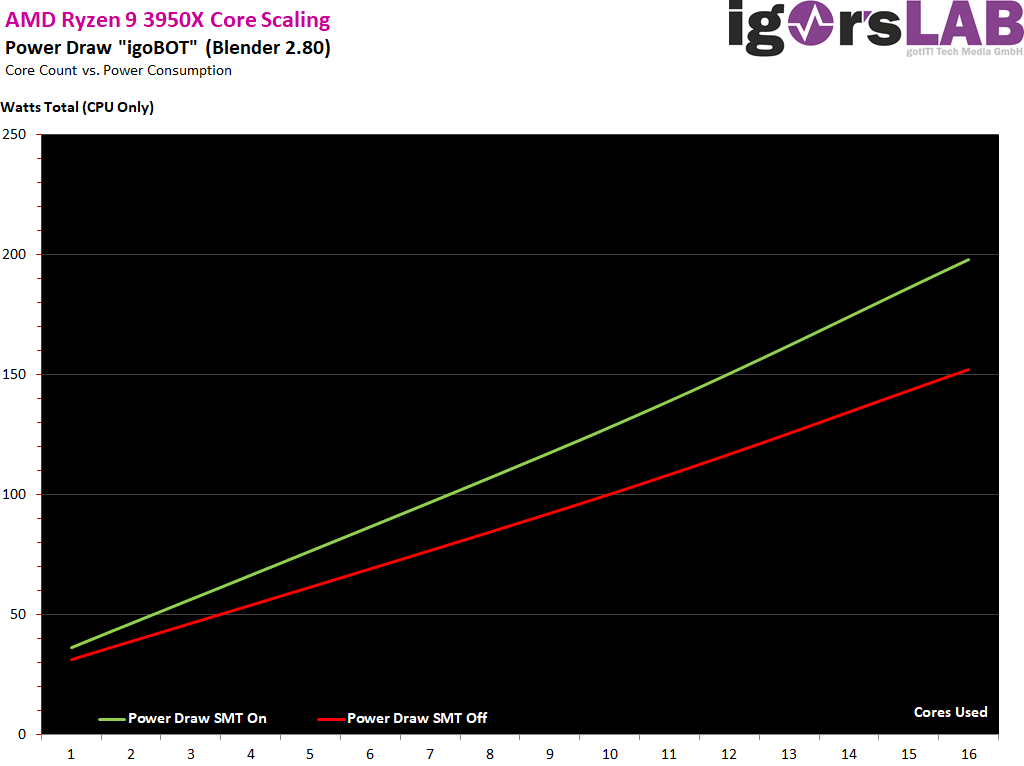
If one considers the total power consumption of the CPU, then one also sees the bend starting from approx. 10 cores, where the power consumption increases higher in relation to the performance. The “Blender sweetspot” is less than 10 cores when it comes to efficiency.
But that’s what it should have been now, because I also measured the power consumption in other situations. But you can find that on the next page. So please browse on!


Kommentieren