


Game selection and standard applications
The number of games does not say anything about the relevance and general validity, especially as every user sets their own personal premises very differently anyway. Therefore, a benchmark selection can only be a guideline, but not an absolute judgment. Even after 20 or 30 games, it would be difficult to make that judgment, because something always doesn’t fit or, conversely, fits far too well. That’s why I’ve selected games today that were either tailored to AMD or Intel or neither of them in particular and were also a little older and therefore completely patched.
The mix contains an equal number of games that scale extremely well with the CPUs, even up to WQHD and in some cases even in Ultra HD, as well as games that are already partially limited by the GPU from Full HD onwards and that actually always run in GPU Bound in WQHD. Nevertheless, these constellations are also highly interesting if certain CPUs deviate from this norm and can still achieve slight advantages against the trend.

So it’s not the actual quantity that counts, but the selection. And it is not the absolute percentages between the CPU results that will be decisive, but the general trend that can be determined across all or most games. If you also take the exact metrics into account (10 per game and resolution!) and look at the power consumption, including efficiency, then you can quickly make your own decision about what you might or might not buy.
Important preliminary remarks on the test field and the test setup
As always, I test ALL processors with the appropriate or specified default options of the motherboard manufacturers, as communicated by the two chip manufacturers. In the case of Intel and Raptor Lake S (Refresh), these are exactly the profiles that Intel has finally published and that MSI as a board partner has also implemented in this form. In addition, there are all firmware updates from both chip manufacturers available to date. AMD can look forward to Precision Boost Overdrive on Zen 3 to Zen 5, which is already set by default. The normal user won’t be manually capping the power consumption to the respective TDP class anyway.
I would also like to refer you to a counter-test I once carried out on AMD’s PBO, which shows that power consumption does not increase disproportionately in games, but performance does. I also had to replace a motherboard unplanned in the test system, whereby nothing absolutely identical could be found in the short time available on a weekend. I am therefore testing the Ryzen 9 9950X on an MSI X670E Tomahawk WiFi, on which only the connectivity is limited. In terms of performance, no differences were measurable in random tests with the CPUs already measured on the Ace.
It is also important to me that I test all current platforms, i.e. Raptor Lake, Alder Lake and Zen 4 with DDR5 6000 CL30, which I then use for better comparability. I’m still using the appropriate RAM from the last test, which also ran stably and smoothly via XMP (Intel) and EXPO (AMD). The older AM4 system ran with DDR4 3600 CL14 and all CPUs were cooled equally well, at least within the limits of what they allowed. But we’ll get to the exact test setup in a moment.
Test setup
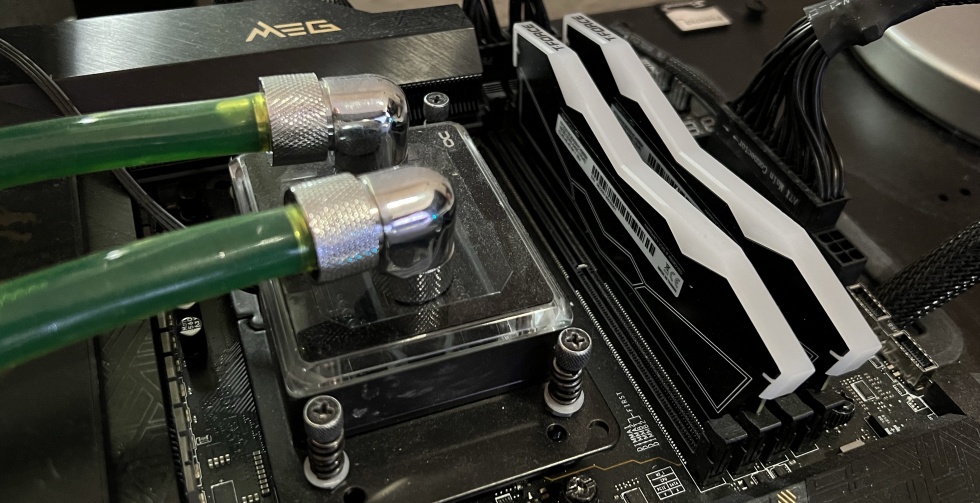
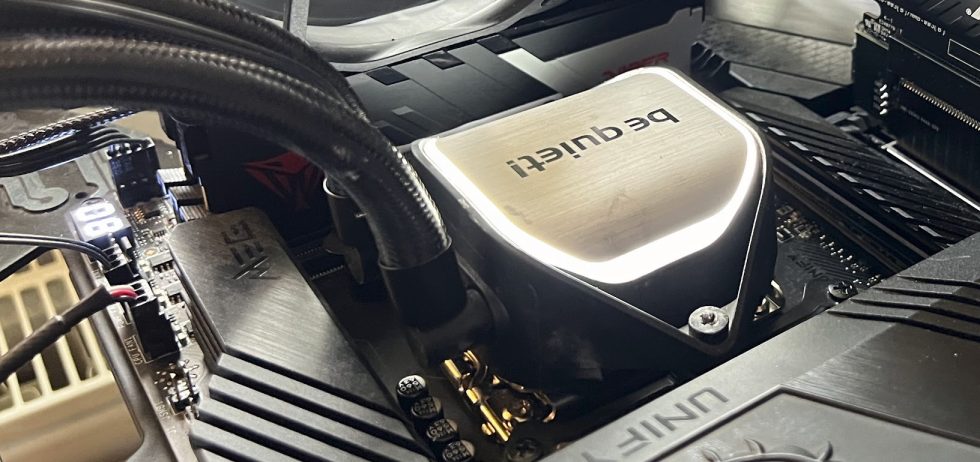
I’m again relying on a GeForce RTX 4090 for the gaming, application and workstation tests. The test system for the applications is the same as for the gaming test, although I’ve rechampioned everything with and since the launch of the Ryzen 7000 series. There is also the realization that DDR5 memory modules are slowly establishing themselves in workstations, but there is still a long way to go. The MSI MEG X670E Ace and the MSI MAG X670E Tomahawk WiFi from the Ryzen tests are complemented by an MSI MEG Z690 Unify for the Raptor Lake CPUs and an MSI MEG X570 Godlike for the X570 platform including AM4. I already wrote a lot about the memory in the foreword and the performance settings are already on page one this time. With a 360 AiO from Be Quiet! (Pure Loop 2).
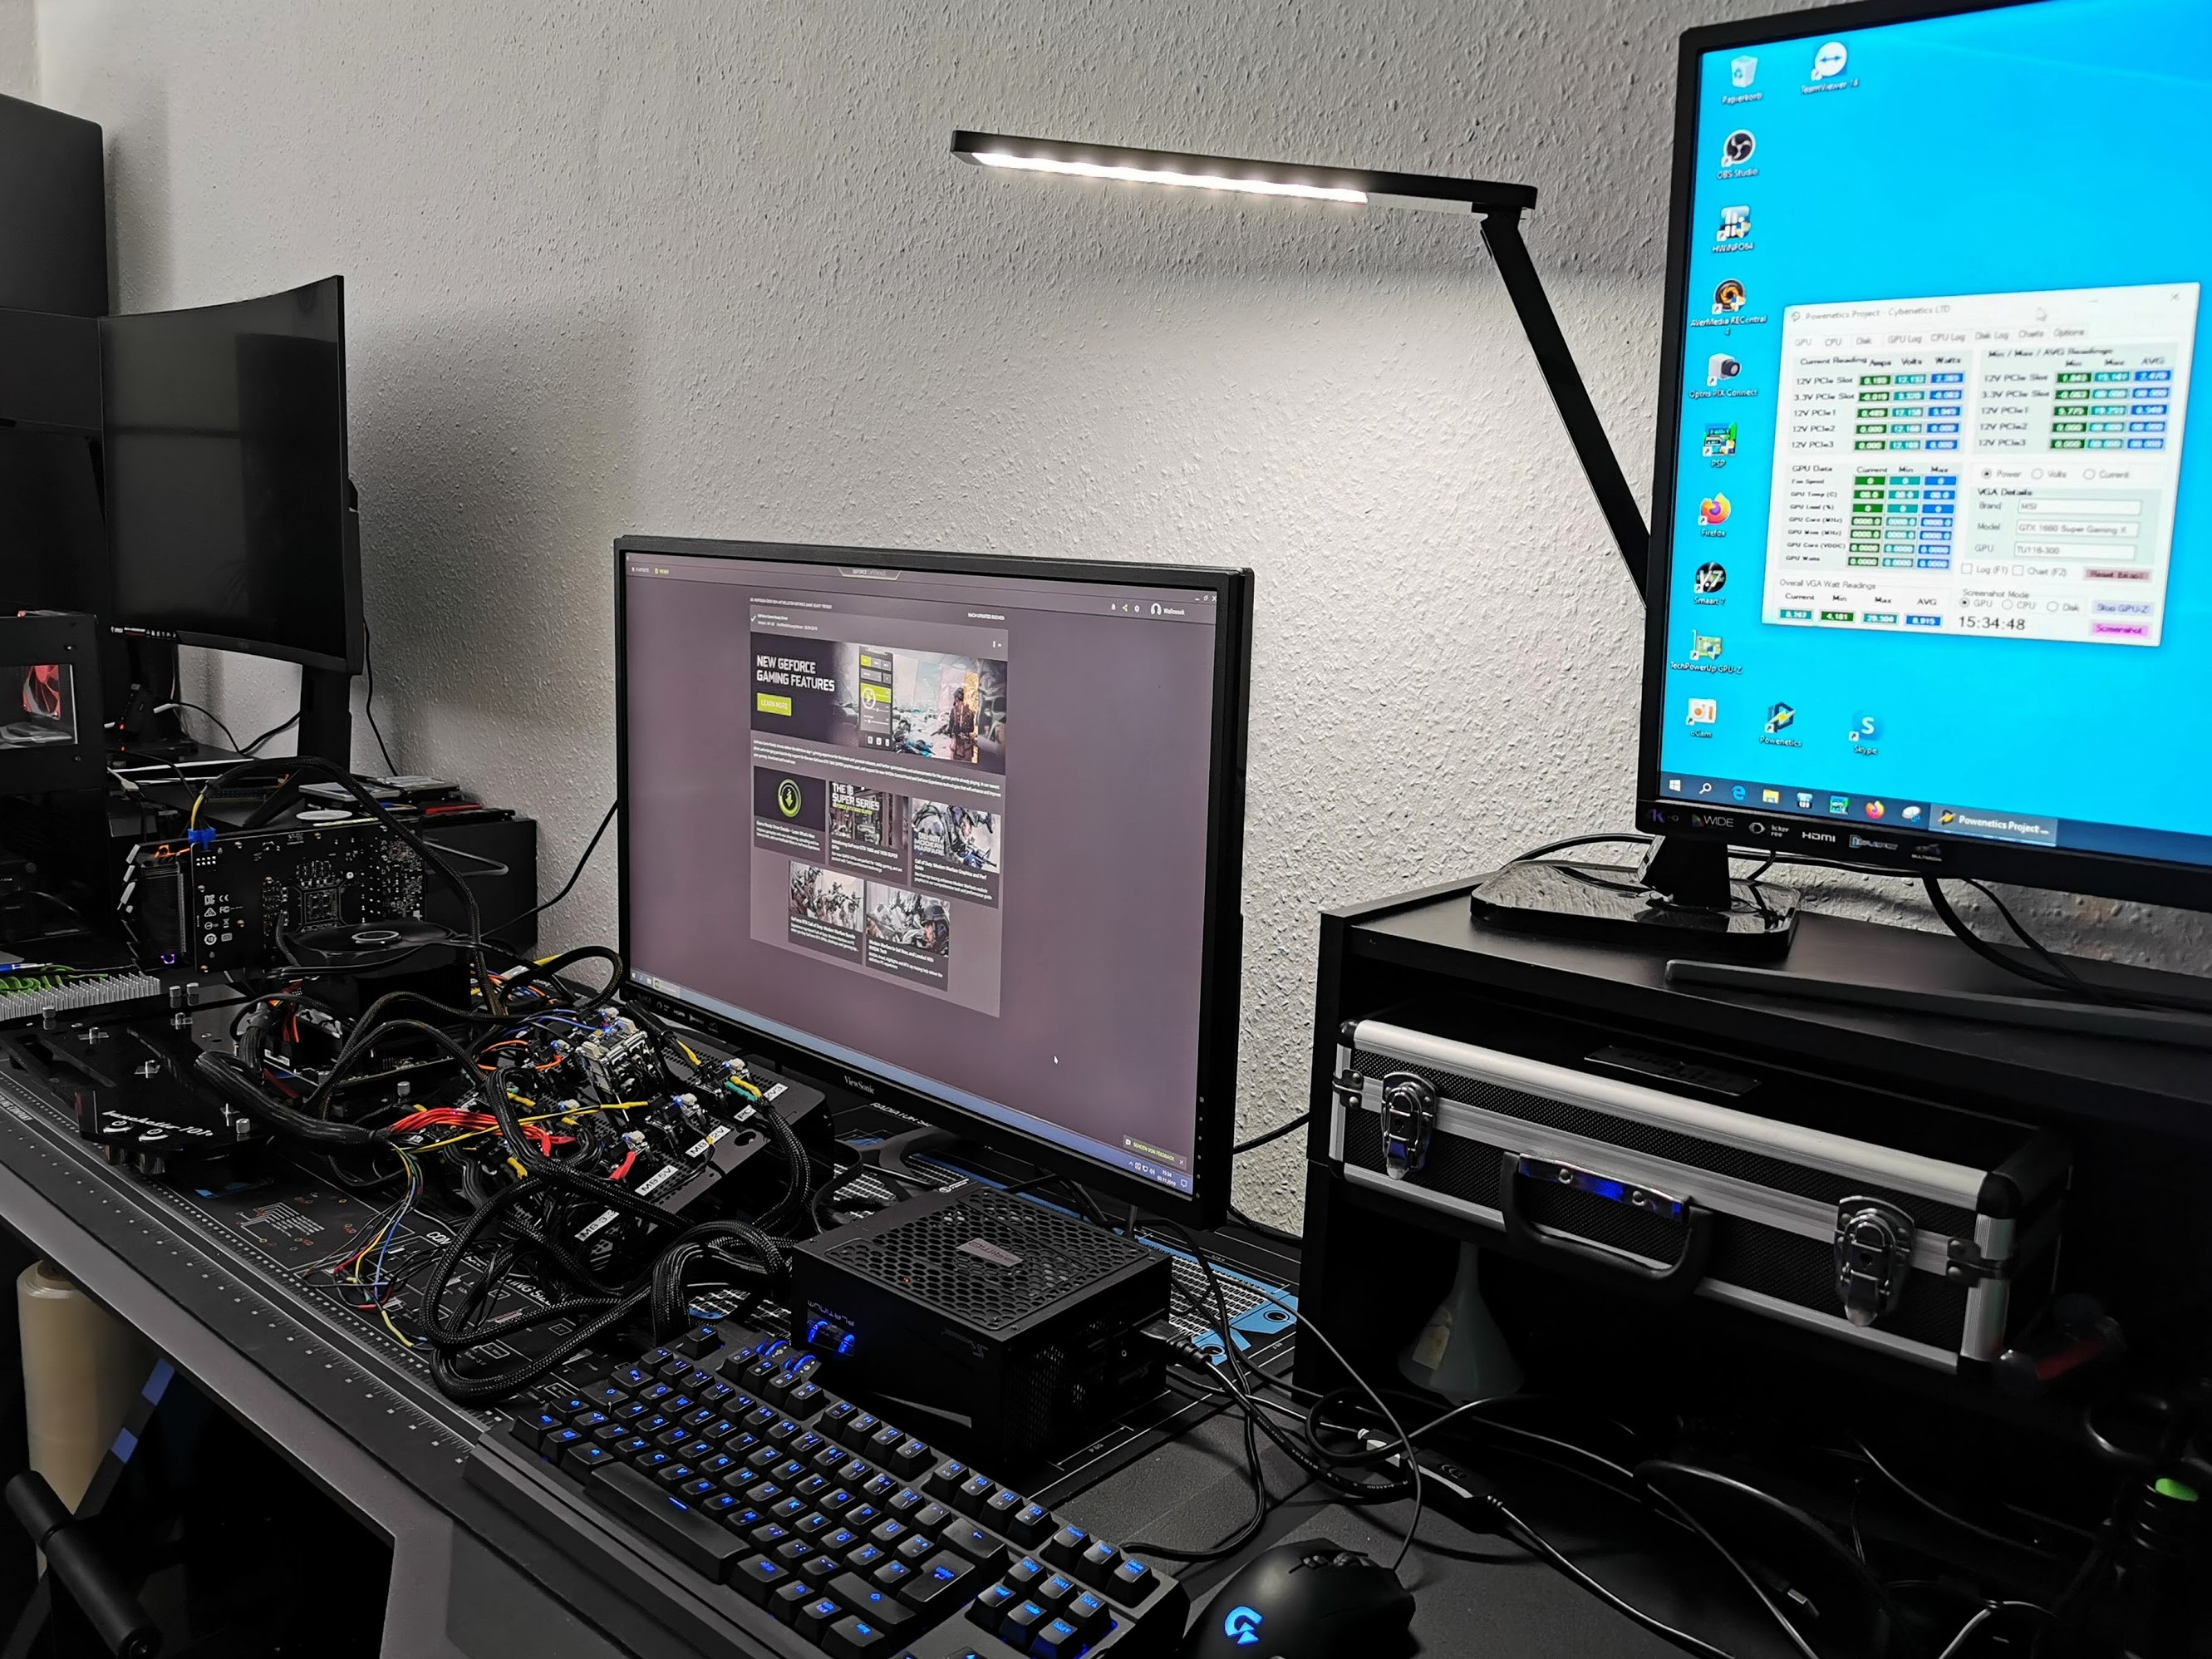
The measurement of the detailed power consumption and other, more in-depth things is carried out here in the laboratory (where at the end the thermographic infrared images are also taken with a high-resolution industrial camera in the air-conditioned room) on two tracks using high-resolution oscilloscope technology and the self-created, MCU-based measurement setup for motherboards and graphics cards (pictures below) or the circuit board from Cybenetics.
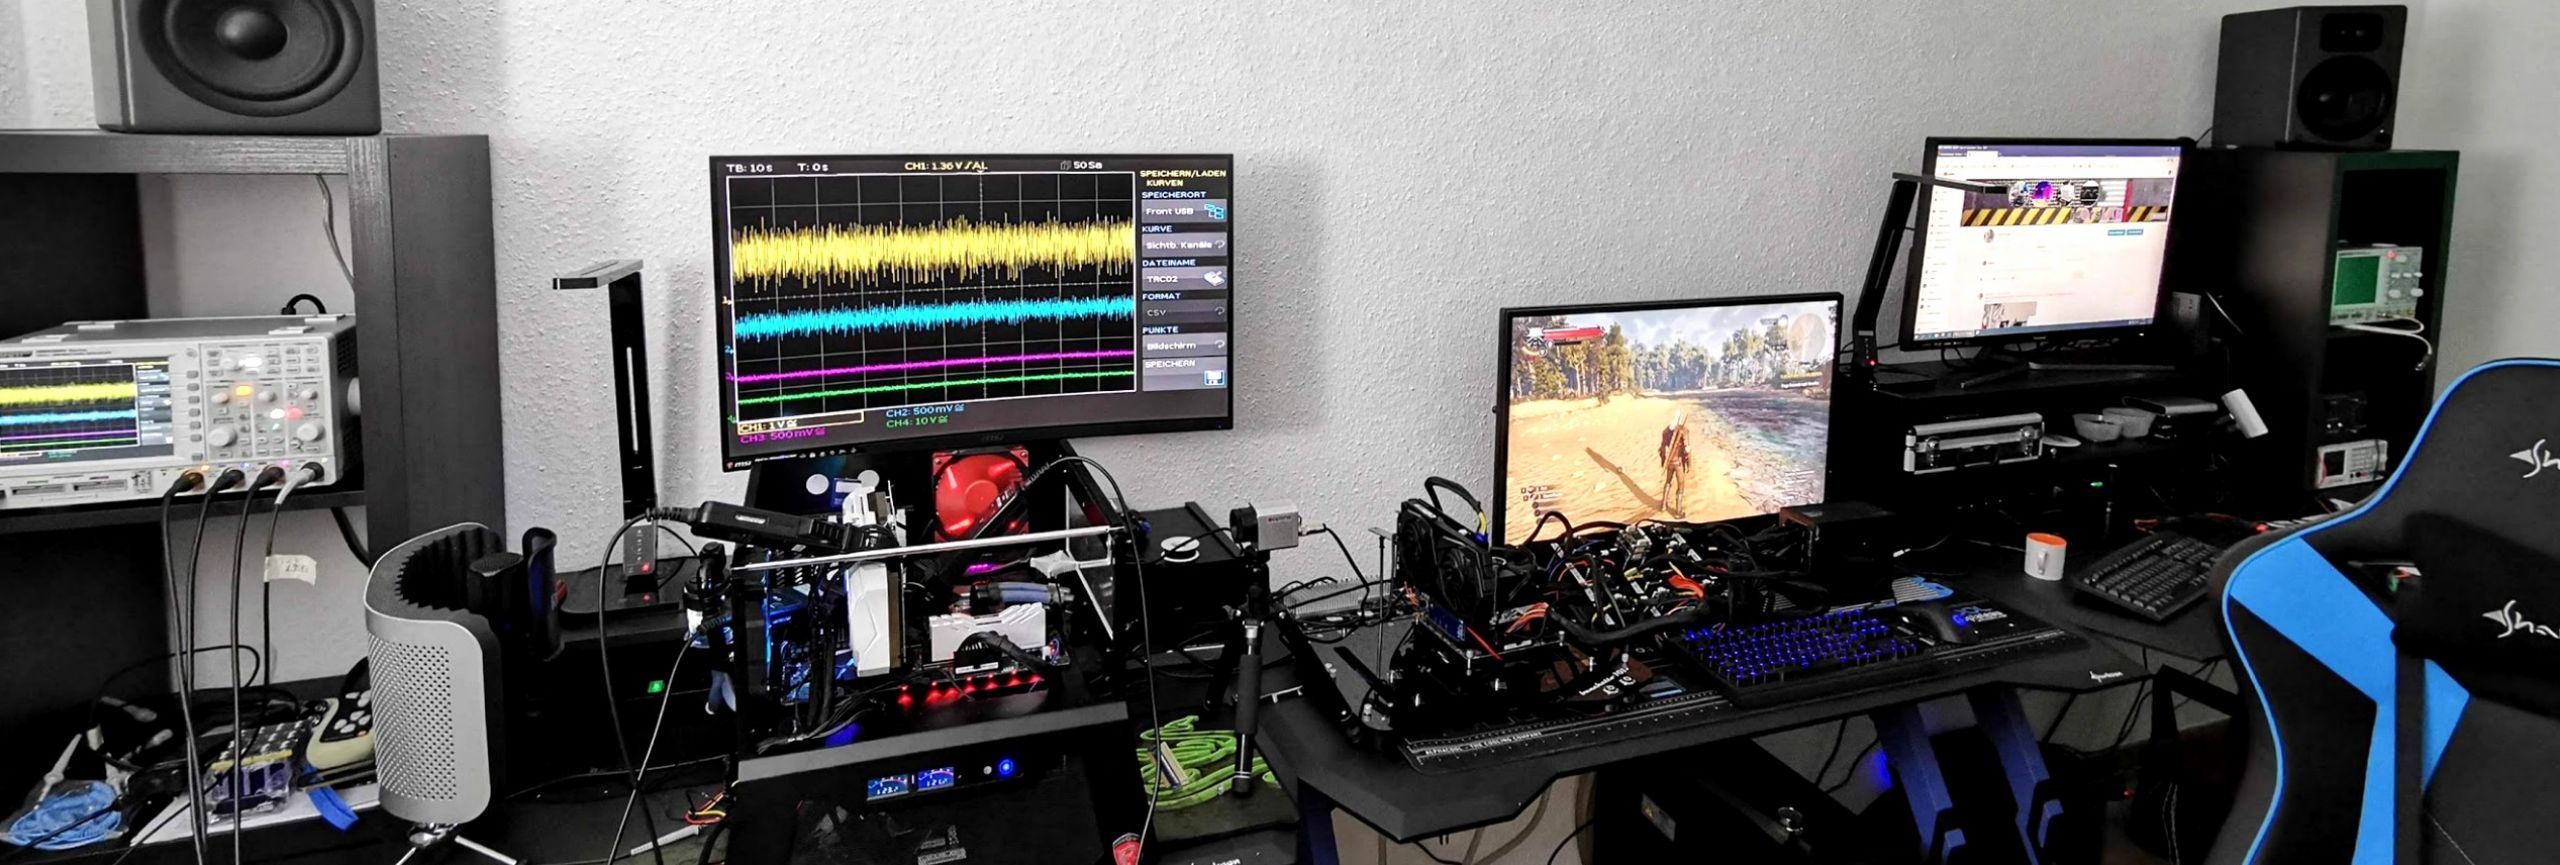
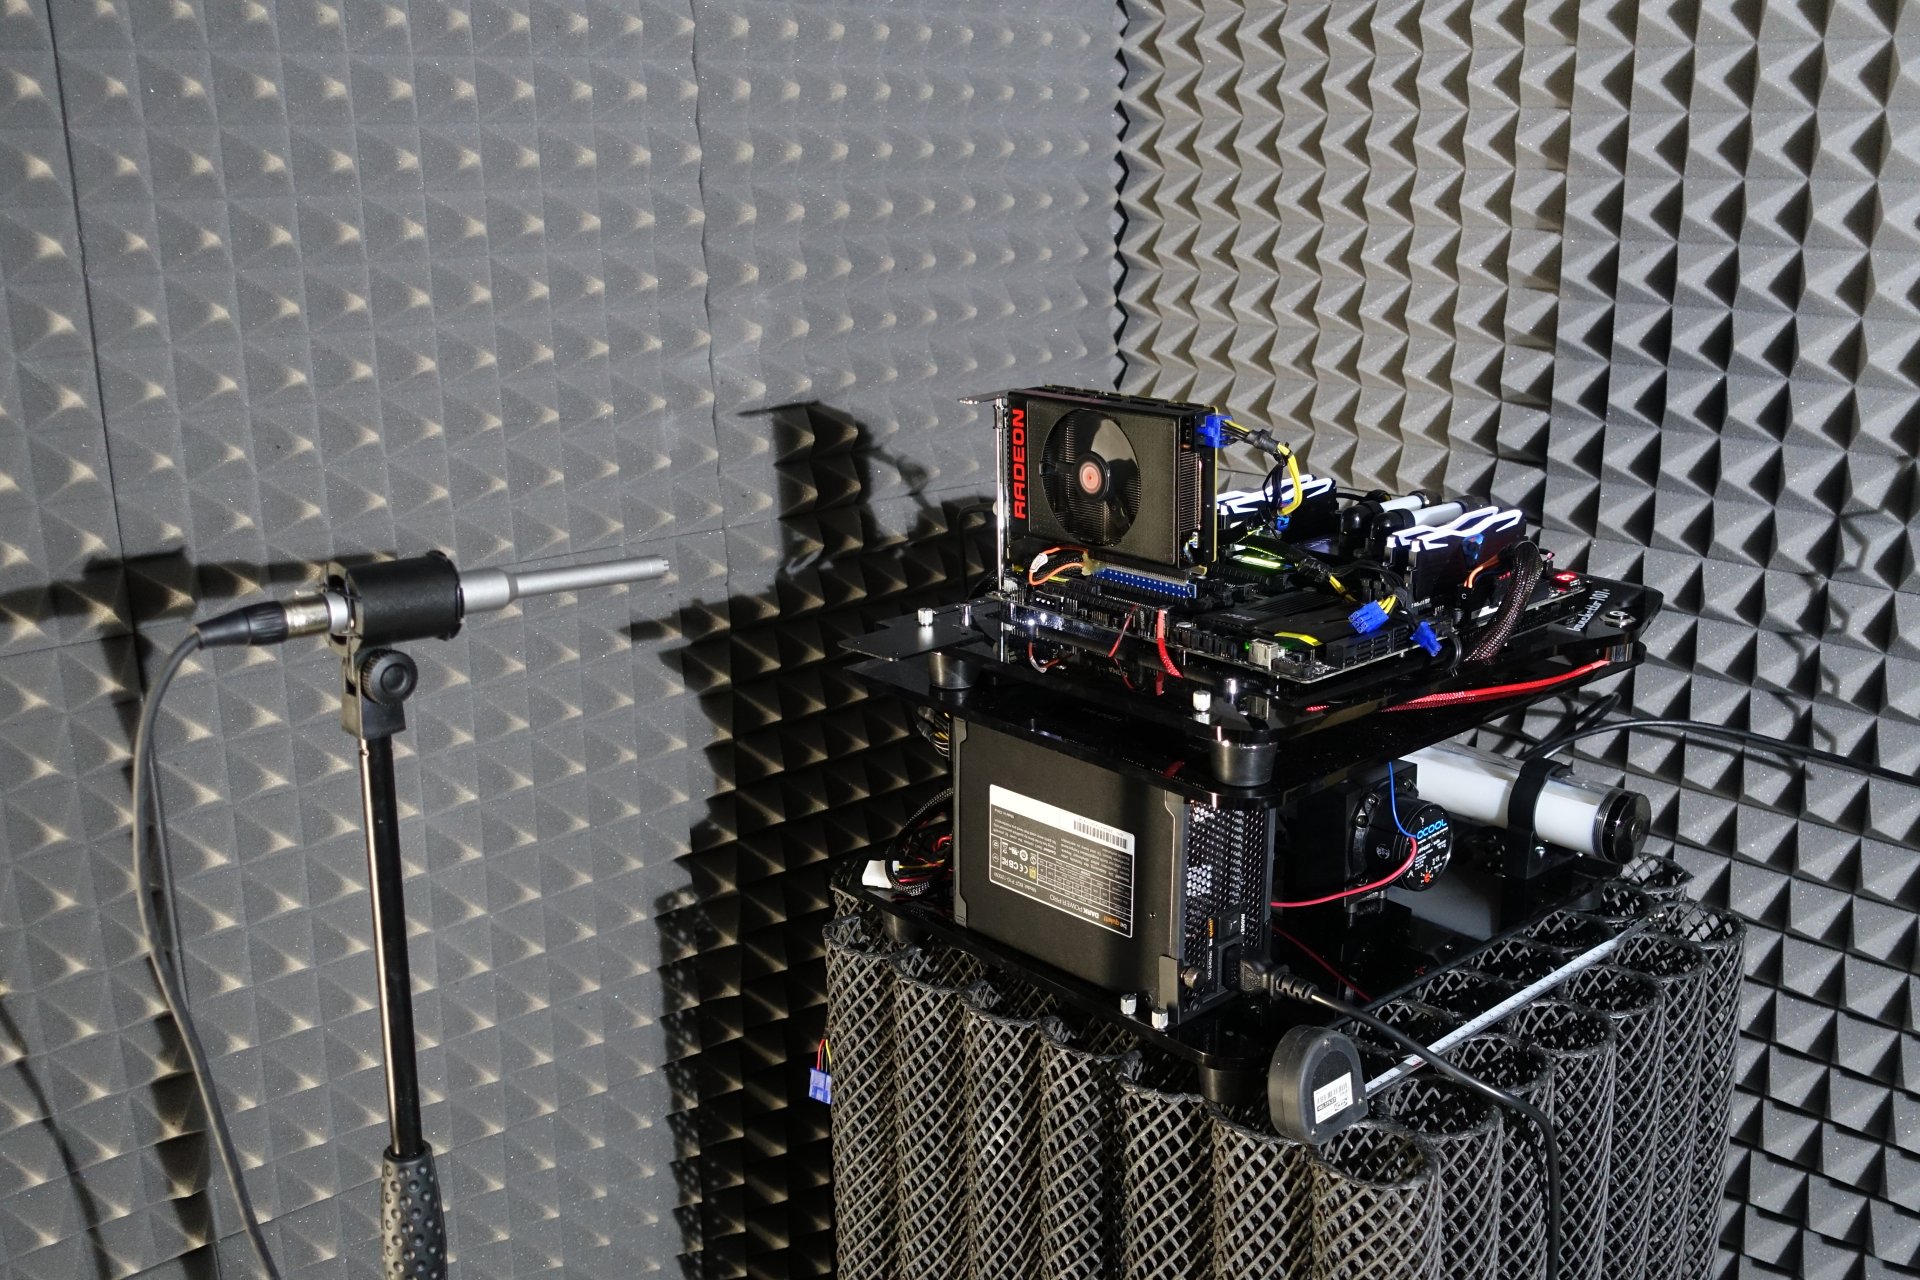
The audio measurements are carried out outside in my chamber (room within a room). But all in good time, because today is all about gaming (for now).

I have also summarized the individual components of the test system in a table:
| Test System and Equipment |
|
|---|---|
| Hardware: |
AMD AM5 Ryzen 9 9950X AMD AM4 Intel LGA 1700 MSI RTX 4090 Suprim X 2x 2 TB MSI Spatium M480 Pro |
| Cooling: |
Be Quiet Pure Loop 2 360 mm Alphacool Apex |
| Case: |
Cooler Master Benchtable |
| Monitor: | LG OLED55 G19LA |
| Power Consumption: |
Oscilloscope-based system: Non-contact direct current measurement on PCIe slot (riser card) Non-contact direct current measurement at the external PCIe power supply Direct voltage measurement at the respective connectors and at the power supply unit 2x Rohde & Schwarz HMO 3054, 500 MHz multichannel oscilloscope with memory function 4x Rohde & Schwarz HZO50, current clamp adapter (1 mA to 30 A, 100 KHz, DC) 4x Rohde & Schwarz HZ355, probe (10:1, 500 MHz) 1x Rohde & Schwarz HMC 8012, HiRes digital multimeter with memory function MCU-based shunt measuring (own build, Powenetics software) |
| Microscope / Laser: |
Laser-induced breakdown spectroscopy (LIBS) Keyence VHX-7000 and AE-300 |
| Thermal Imager: |
1x Optris PI640 2x Xi400 Thermal Imagers Pix Connect Software Type K Class 1 thermal sensors (up to 4 channels) |
| Acoustics: |
NTI Audio M2211 (with calibration file) Steinberg UR12 (with phantom power for the microphones) Creative X7, Smaart v.7 Own anechoic chamber, 3.5 x 1.8 x 2.2 m (LxDxH) Axial measurements, perpendicular to the center of the sound source(s), measuring distance 50 cm Noise emission in dBA (slow) as RTA measurement Frequency spectrum as graphic |
| OS/UEFI: | Windows 11 Pro (all updates/patches, current certified drivers), AMD PI 1.2.0.0.a, Intel ME_16.1.30.2361 |

- 1 - Einführung, Vorbemerkung und CPU-Daten
- 2 - Test-Setup und Methoden
- 3 - Gaming Performance HD Ready (1280 x 720 Pixels)
- 4 - Gaming Performance Full HD (1920 x 1080 Pixels)
- 5 - Gaming Performance WQHD (2560 x 1440 Pixels)
- 6 - Gaming Performance Ultra-HD (3840 x 2160 Pixels)
- 7 - Autodesk AutoCAD 2023
- 8 - Autodesk Inventor 2021 Pro
- 9 - Rendering, Simulation, Financial, Programming
- 10 - Wissenschaft und Mathematik
- 11 - Workstation: Leistungsaufnahme und Effizienz
- 12 - Gaming: Leistungsaufnahme und Effizienz
- 13 - Zusammenfassung und Fazit


44 Antworten
Kommentar
Lade neue Kommentare
Mitglied
Urgestein
1
Veteran
Veteran
Mitglied
Mitglied
Mitglied
Urgestein
Urgestein
Veteran
1
Urgestein
Urgestein
Urgestein
Neuling
Urgestein
Veteran
Neuling
Alle Kommentare lesen unter igor´sLAB Community →