


I’m going to take the requirements up a notch: Autodesk Inventor 2021 is an advanced 3D CAD software for product development and mechanical engineering, which is already a little more demanding on the CPU. It offers parametric and free-form modelling functions so that users can design both standardized and complex geometries. In the area of assembly modeling, it enables engineers to design and assemble components in a realistic, virtual environment. With specialized tools for sheet metal design, designs can be created with folds, bends and other specific features.
The program also supports the design of piping systems and electrical cable runs. To verify design integrity, users can access simulation tools, including stress analysis and thermal studies. For presentations and documentation, Inventor offers advanced visualization capabilities, including realistic renderings and automatic 2D drawing creation from 3D models. Interoperability is also a core feature, with users able to import and export CAD data from multiple sources. The software also offers integrated data management features and cloud connectivity for improved collaboration and data storage.
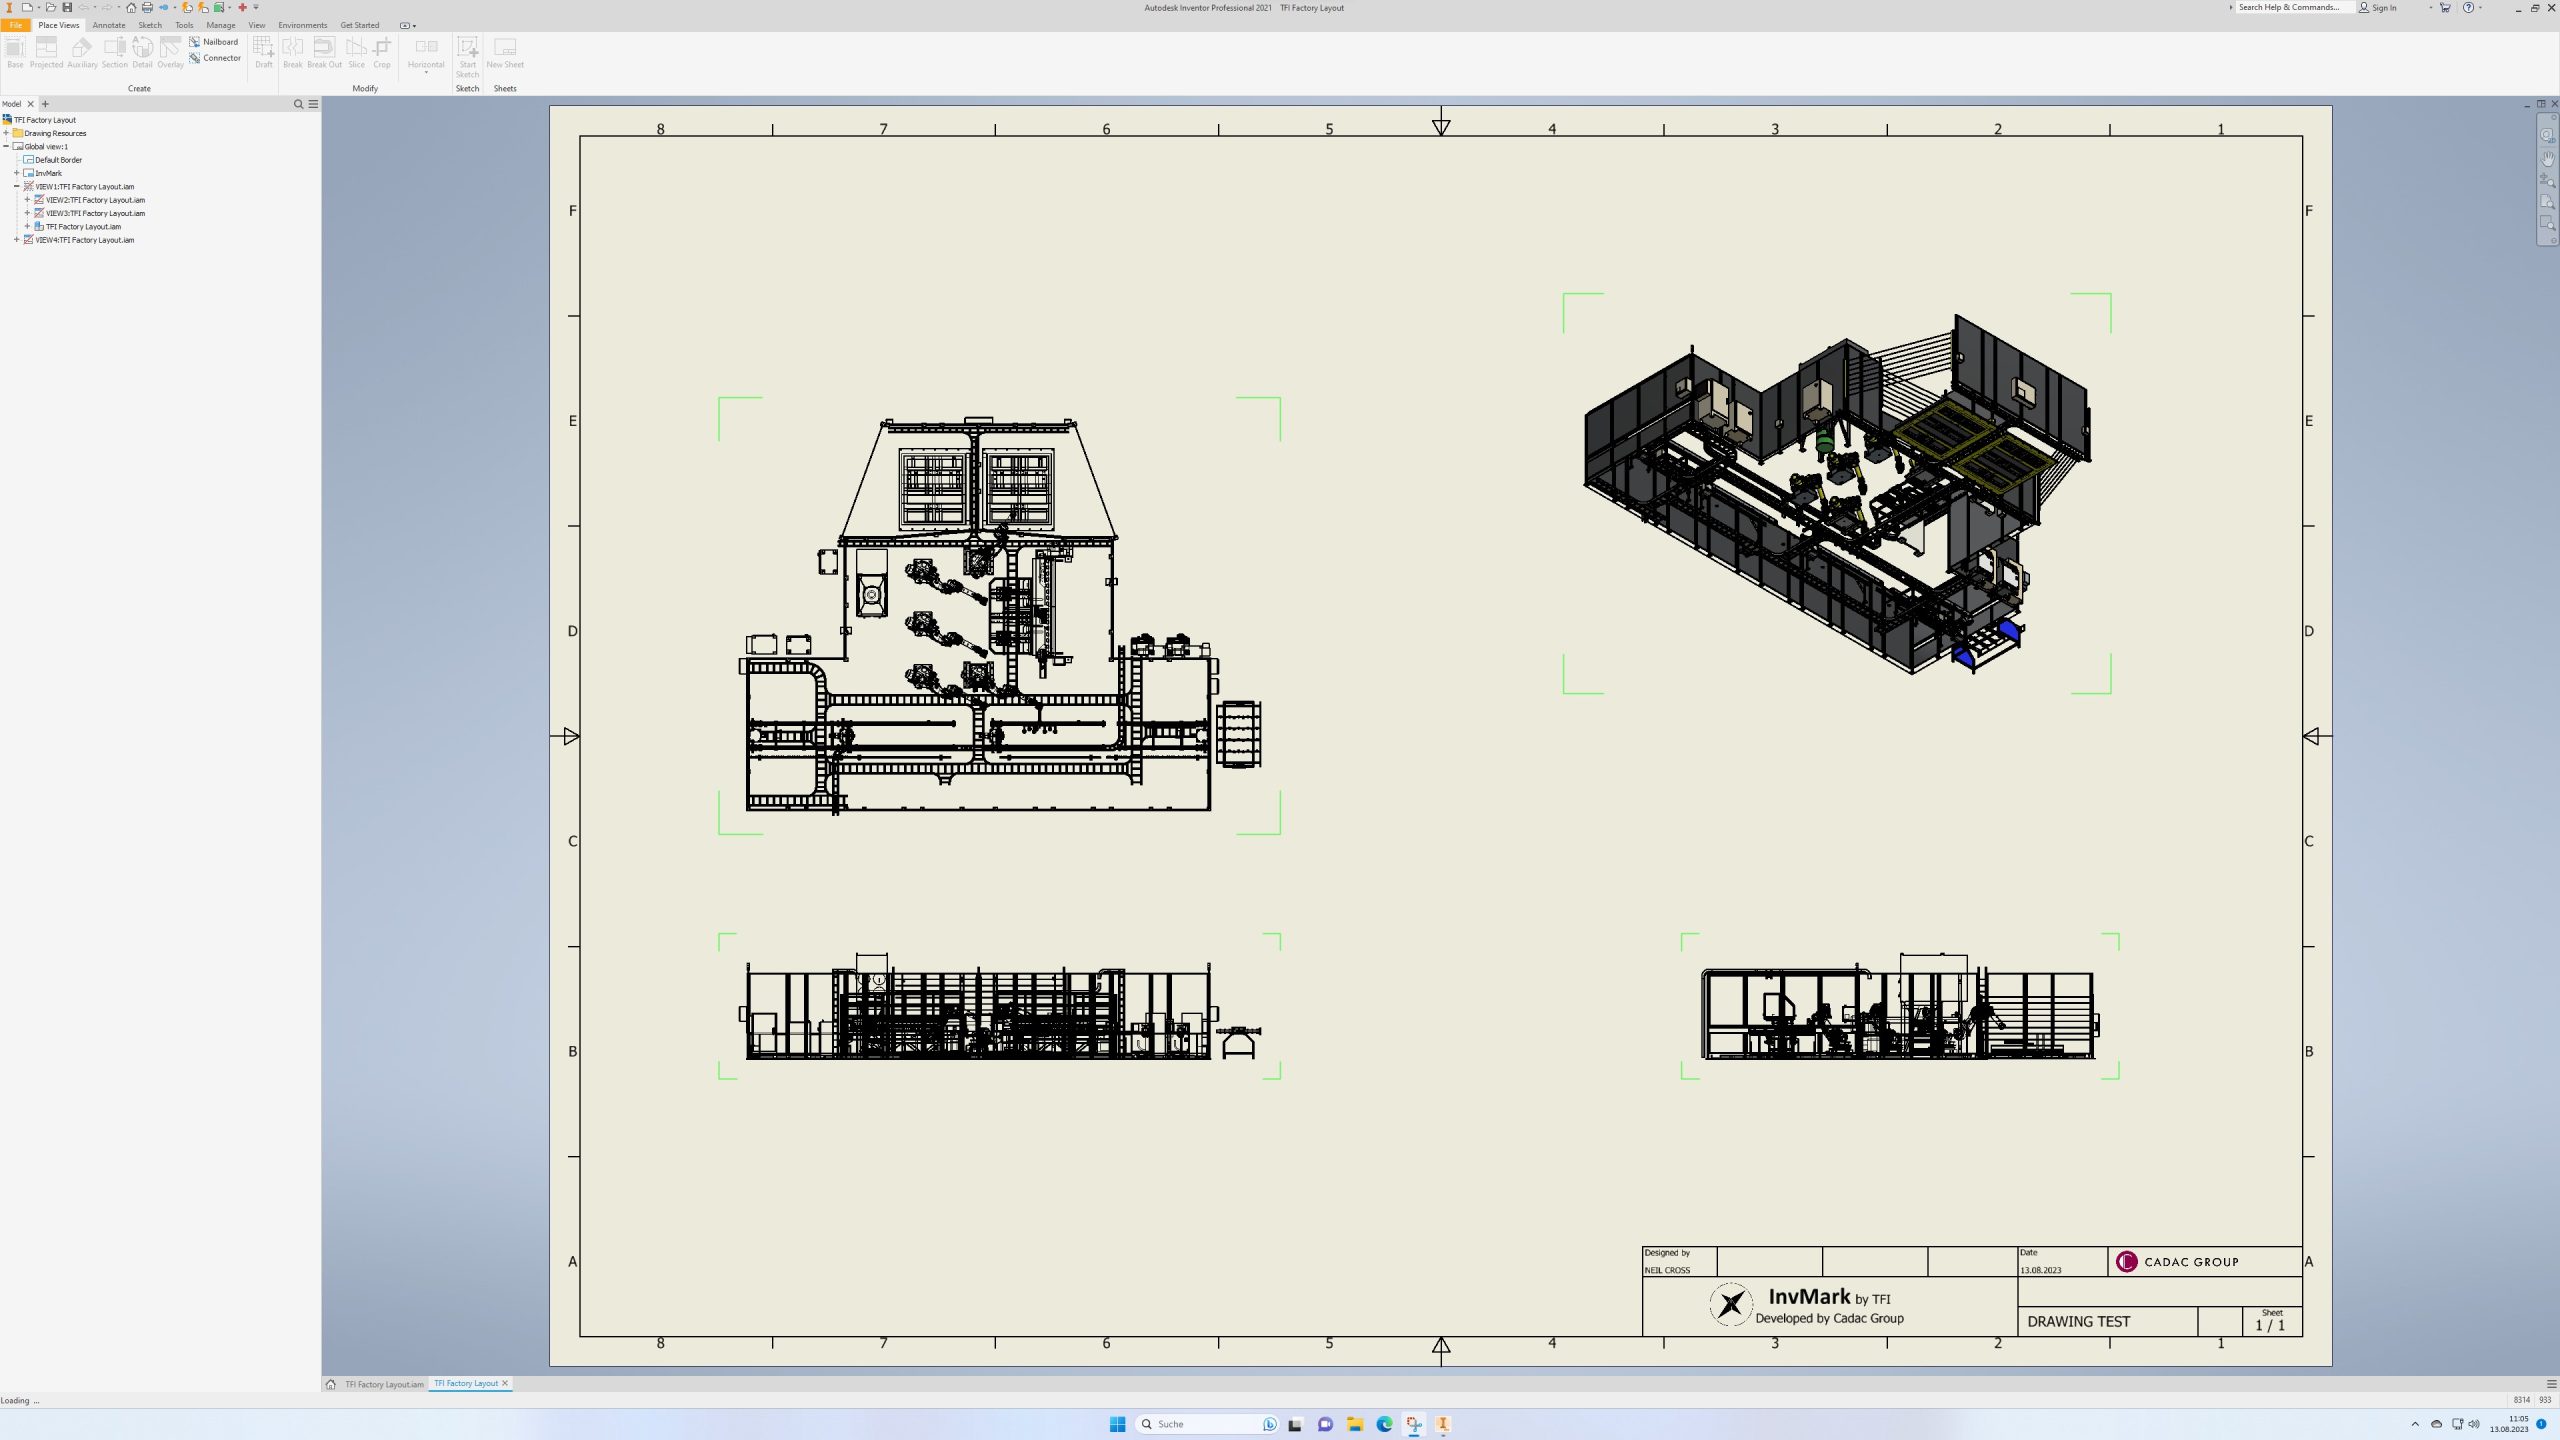
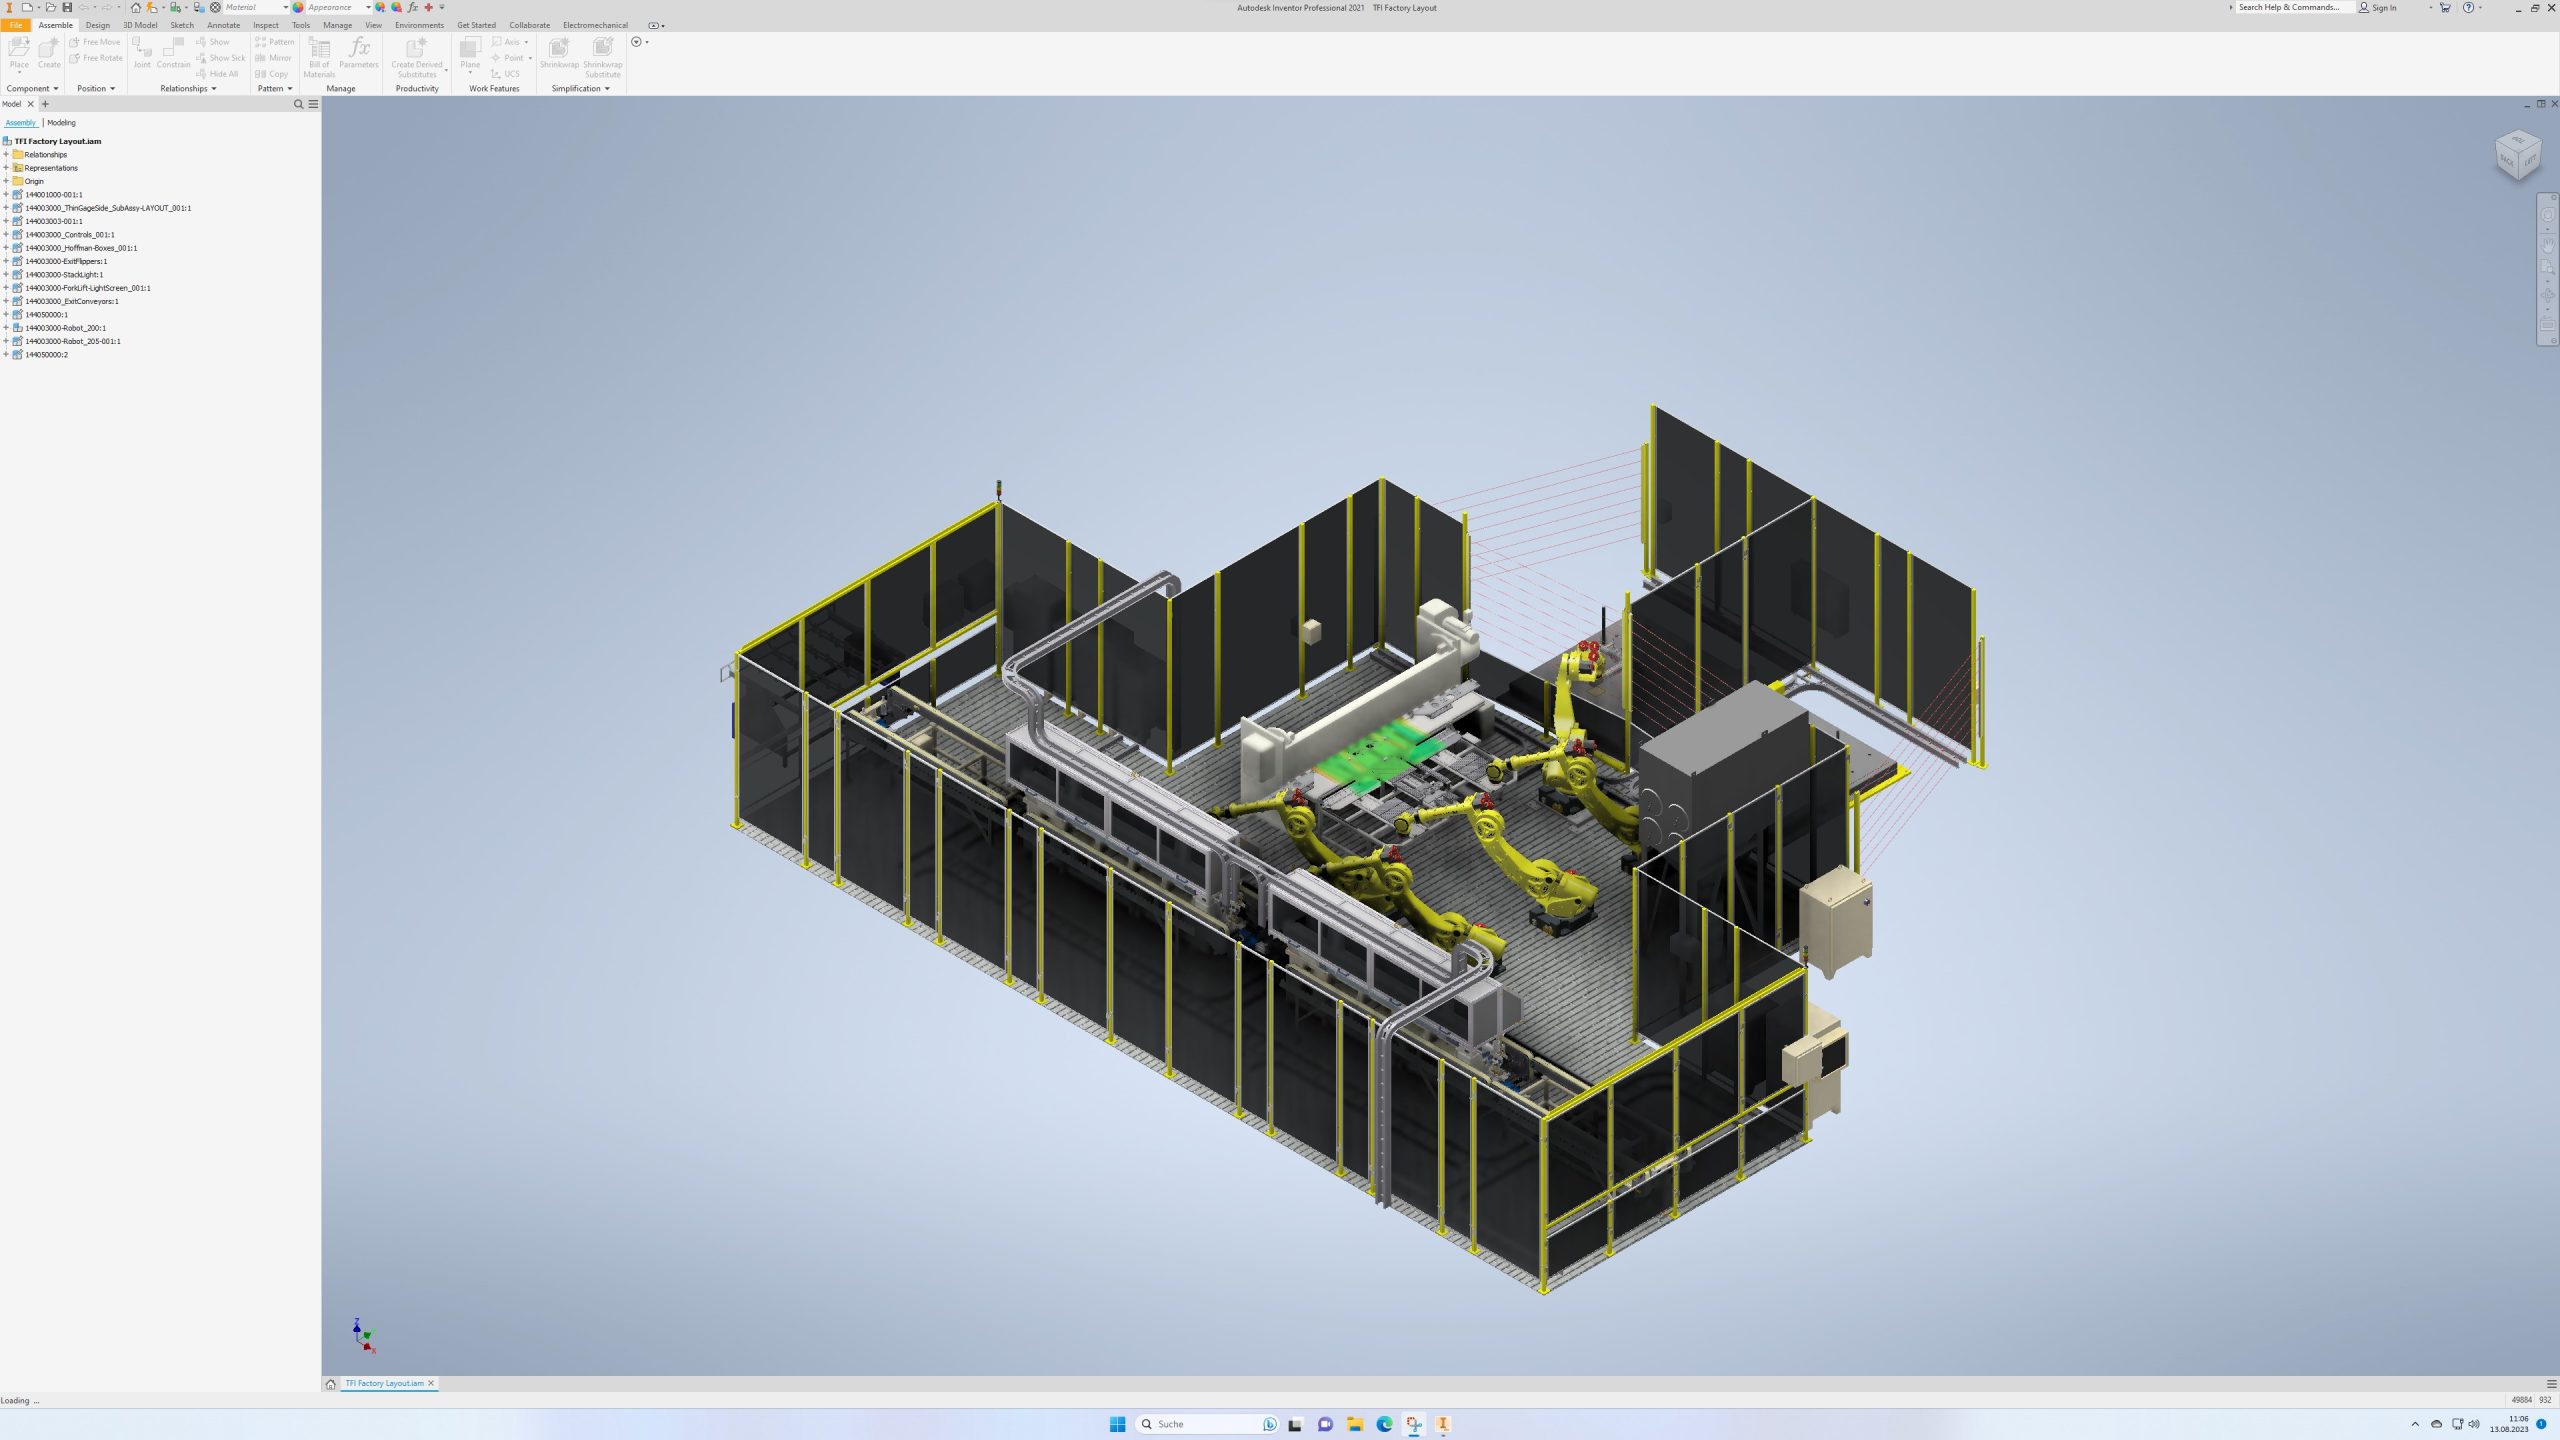
The InvMark covers almost all of these areas of Inventor (Pro) with its comprehensive benchmark and is a really good gauge of Autodesk system performance. Unfortunately, I can only use the 2021 version here, but nothing should have changed much in terms of general performance. Since Inventor (like AutoCAD) also comes from Autodesk, the findings here should be very similar. Inventor Pro is often enough in CPU Bound with not very many simultaneous threads and so it suits me once again, since I have equipped the tests with exactly this Intel CPU.
We can see from the summarized bar chart that the differences are not quite so extreme here either. If we again take the baseline profile as the 100% marker, then the increase for the performance profile is a good 1.7 percent, for the extreme profile a good 3.2 percent and for the insane profile just under 4.2 percent. This is so silly that it almost makes you want to cry.

As expected, the Baseline profile has the biggest disadvantage in the multithreaded area, where ray tracing is also included (but not only). The advantage of the Performance profile is 5.4 percent, but then there is hardly any difference, as the Extreme profile measures just under 7.2 percent and the Insane profile just under 7.5 percent more performance. You will hardly notice this in practice either.

The single-threaded performance is even closer. The Performance profile is only 0.7 percent ahead of the Baseline profile, the Extreme profile only 1.6 percent and the Insane profile 3.4 percent.

Individual benchmarks
I have omitted the FEA, Graphics, Data Translation and Assembly Pattern areas here, as there is a constant difference of less than one percent for all profiles, which is almost within the tolerance range. The biggest disadvantage of the Baseline profile is ray tracing, while the rest more or less represents the expected increase in power consumption. The dynamic simulation gains the most in the Insane profile, which is also an interesting finding. But even here, you hardly need to use more than the Performance profile to be able to work easily, on the contrary. The baseline profile is not that bad here either, just bad for marketing and for potentially already degraded CPUs.


128 Antworten
Kommentar
Lade neue Kommentare
Urgestein
Veteran
Urgestein
1
1
Urgestein
1
Urgestein
1
Urgestein
Urgestein
Veteran
Urgestein
Urgestein
Urgestein
Urgestein
Urgestein
1
Urgestein
Alle Kommentare lesen unter igor´sLAB Community →