


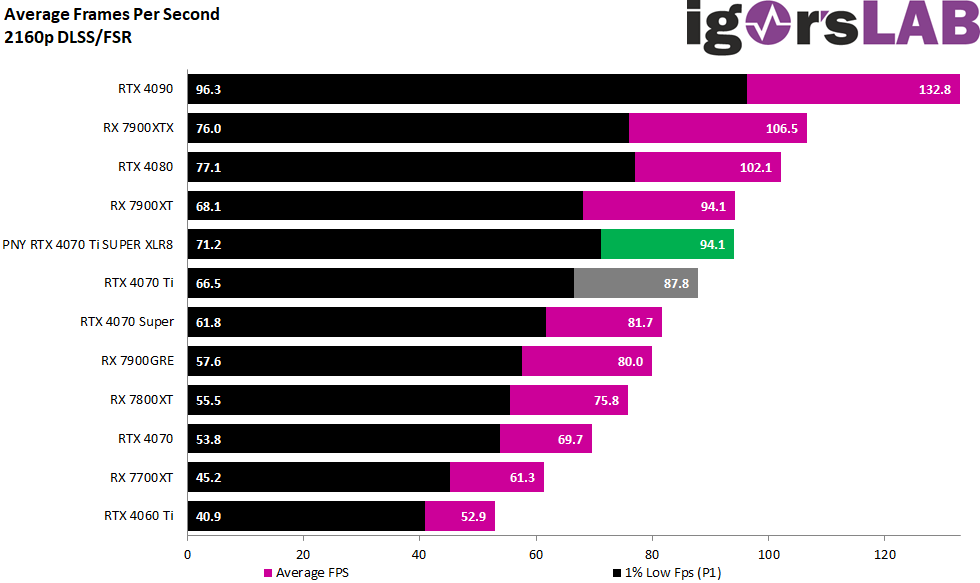
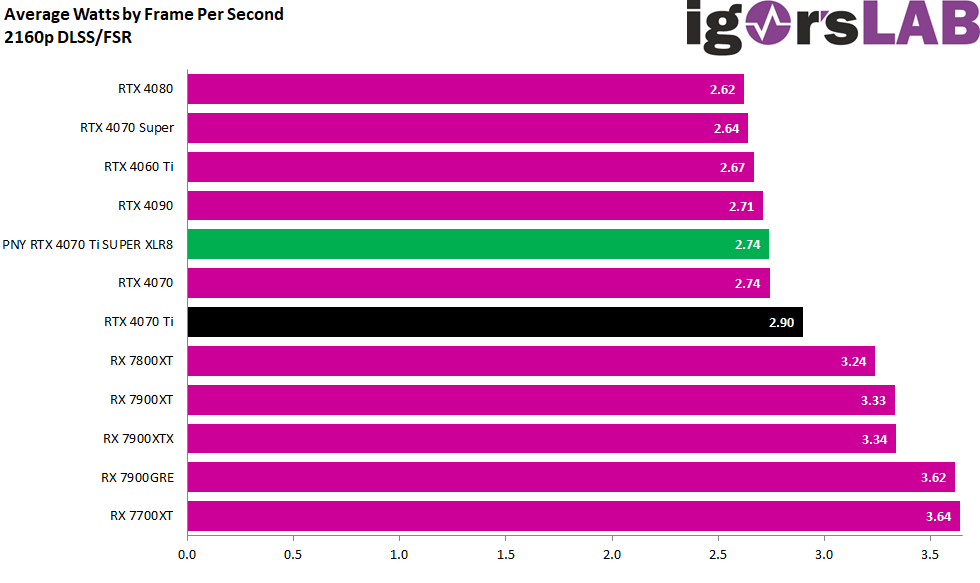
DLSS and FSR render in a lower resolution, so that in the end it basically comes down to WQHD. But here too, the results are quite interesting.
Sum of all games
I normalized the FPS and percentiles as usual and formed a geometric mean (geomean) because this is simply more accurate from a statistical point of view and is also used in the industry.
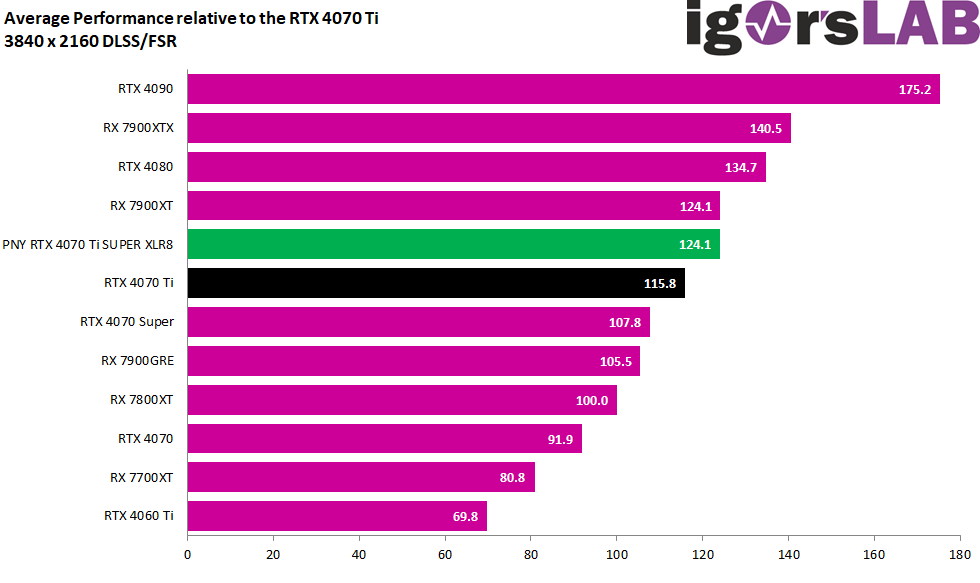
In percentages, the result is a complete tie with the RX 7900XT, even to the decimal place!
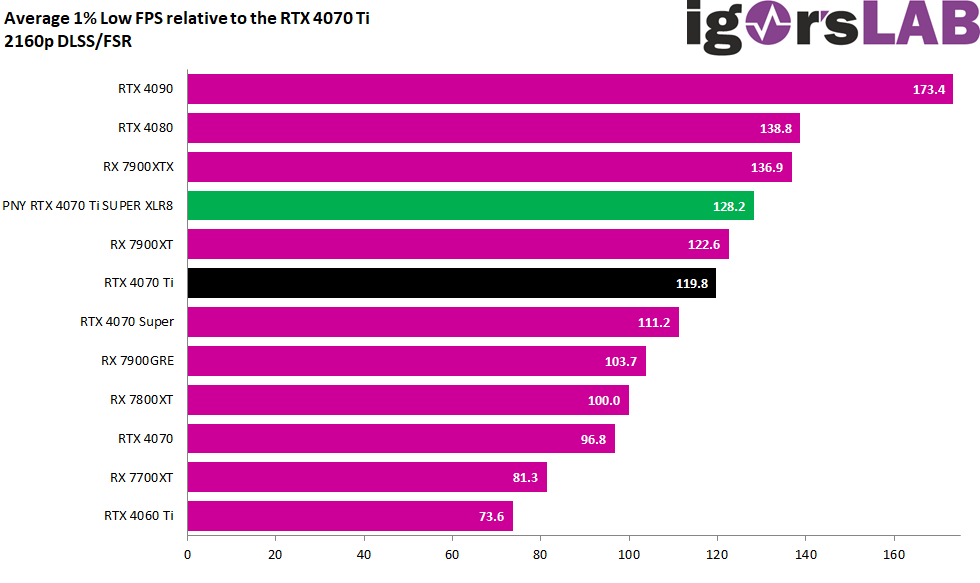
In the P1, however, the RTX 4070 Ti Super from PNY can clearly set itself apart from the RX 7900XT thanks to DLSS.
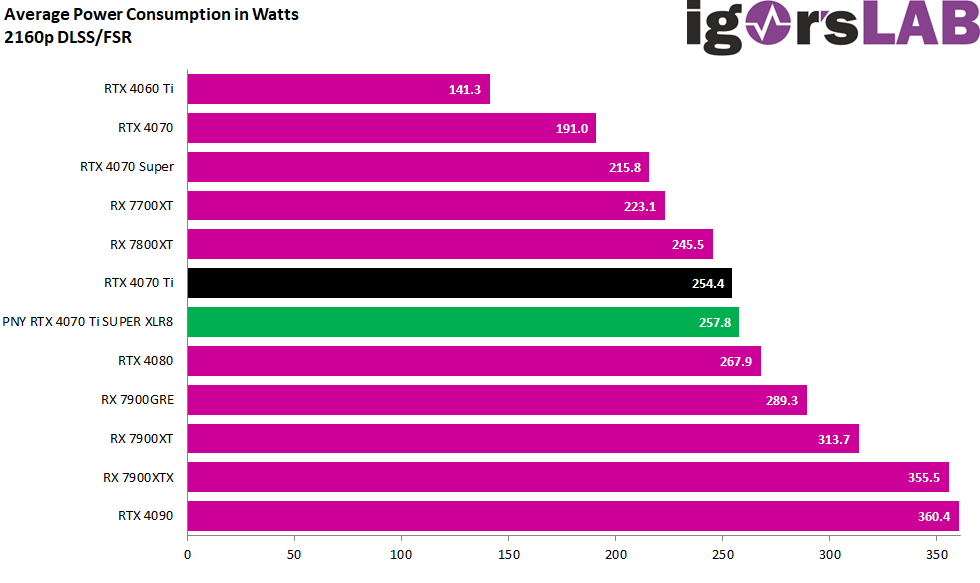
In terms of power consumption and efficiency, the picture is (almost) the same as in WQHD.

- 1 - Introduction, technical data and technology
- 2 - Test system and measuring equipment
- 3 - Teardown: Cooler
- 4 - Teardown: PCB, layout and components
- 5 - Teardown: Detailed material analysis
- 6 - Gaming Performance FHD (1920 x 1080)
- 7 - Gaming-Performance WQHD (2560 x 1440)
- 8 - Gaming Performance Ultra-HD (3840 x 2160)
- 9 - Gaming Performance DLSS / FSR
- 10 - Power consumption and load balancing
- 11 - Load peaks, clipping and PSU recommendation
- 12 - Temperatures, clock rates and infrared analysis
- 13 - Fan curves and noise level with audio sample
- 14 - Summary and conclusion


123 Antworten
Kommentar
Lade neue Kommentare
Veteran
Mitglied
1
1
Urgestein
Veteran
Urgestein
Urgestein
Urgestein
Urgestein
Urgestein
Urgestein
1
1
Urgestein
Mitglied
1
Urgestein
Urgestein
Alle Kommentare lesen unter igor´sLAB Community →