


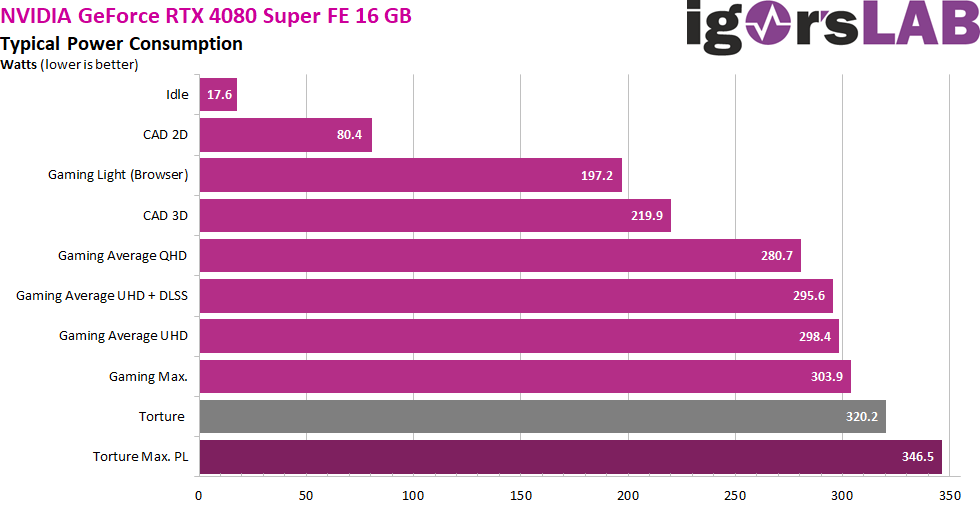
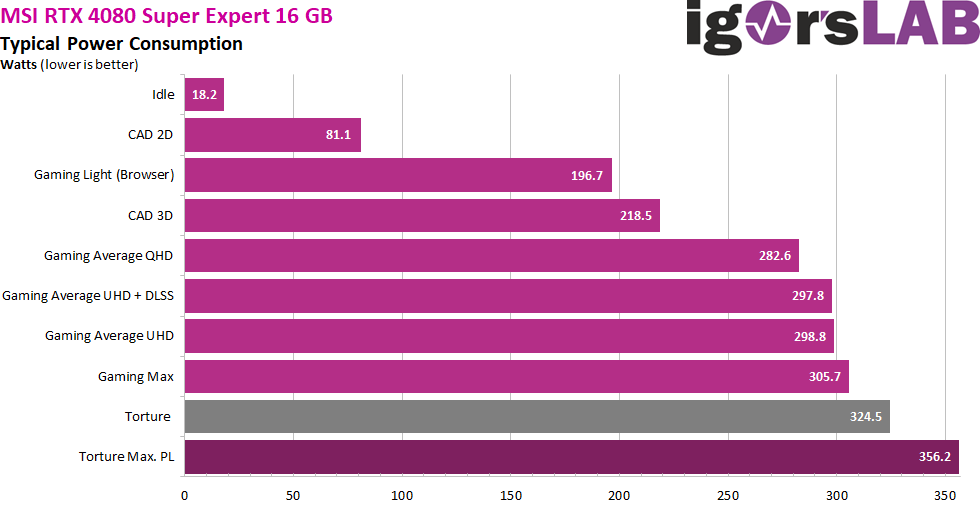
Power consumption in factory settings as a summary
The just under 18 watts in idle mode (12 and 3.3 volts) of both cards are ok. With a second monitor and a different resolution, however, this quickly becomes 38 watts and more. Incidentally, we can see very clearly that the full TBP of 320 watts is rarely exhausted with both cards and only the Torture Loop goes beyond the limits here or reaches them at all. Normally, it is always less.
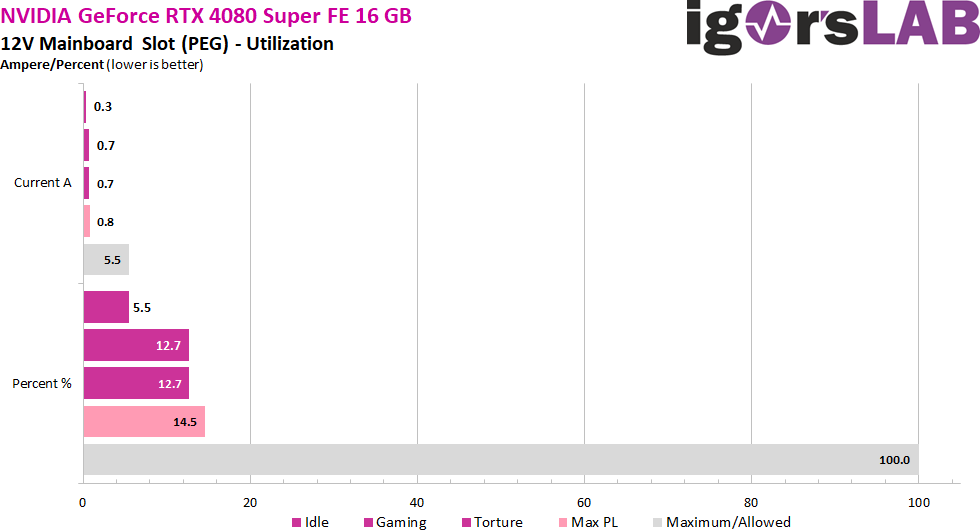
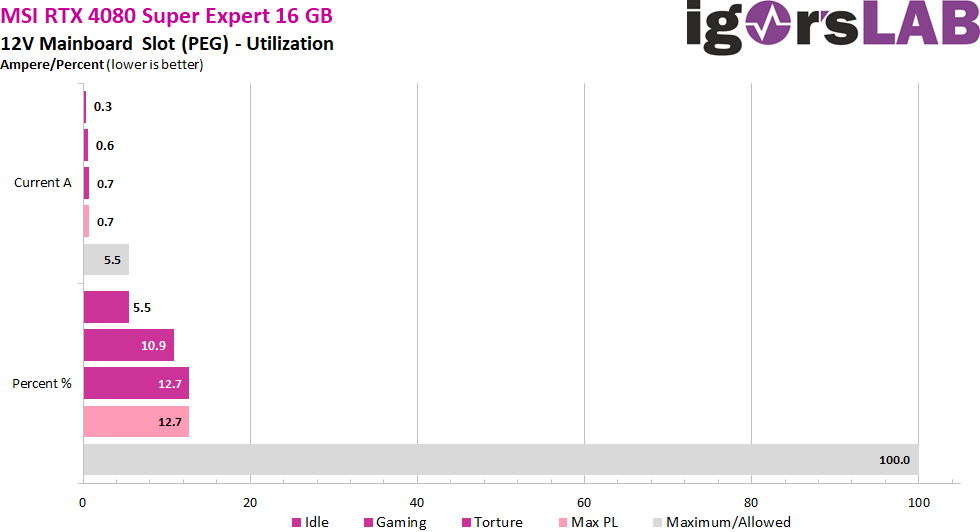
Load distribution between PCIe slot and the PCIe sockets
Both cards hardly use the PCIe slot, which is really pleasing.

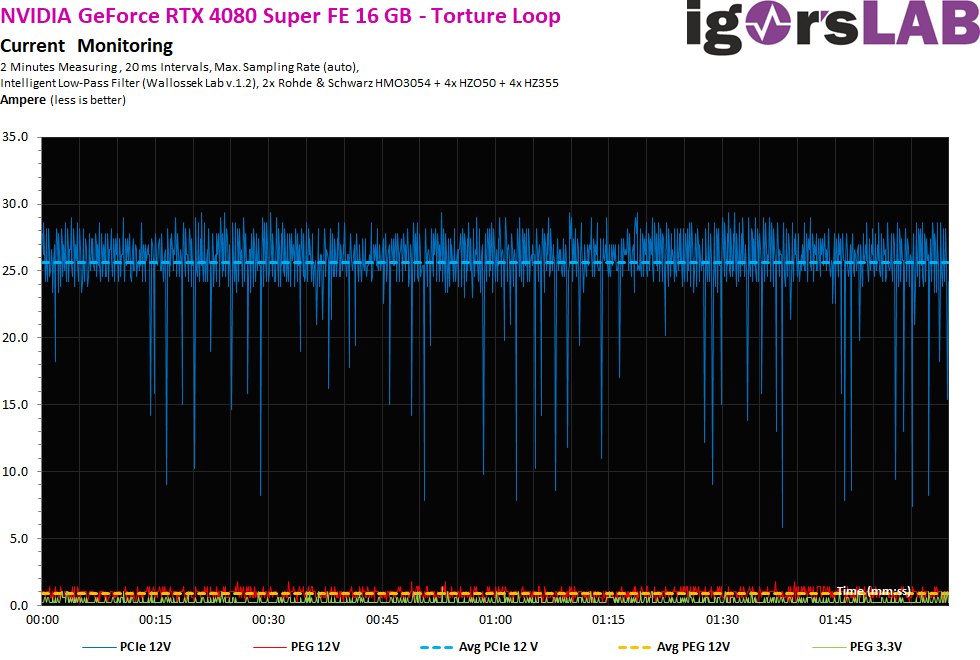
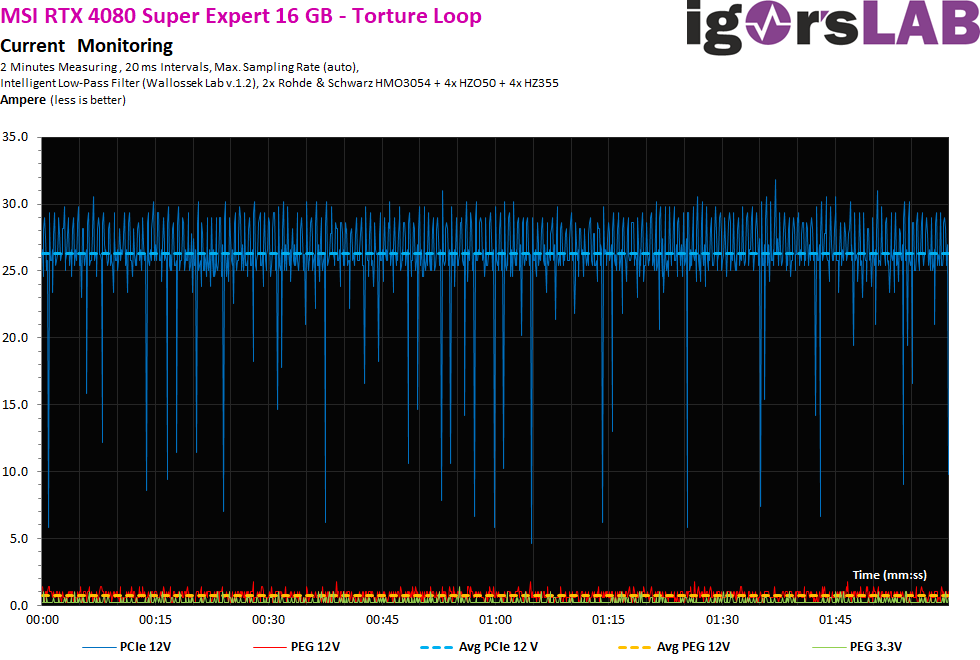
Rough 20 ms intervals
Let’s first take a look at the flowing currents. Measurements were taken at rough 20 ms intervals, i.e. around 50 times per second, in order to simulate the load on the supervisor chip of the power supply units (switch-off). We can see that even short load peaks are capped at 36 A at the latest, but a real limitation looks different. This is not a small amount and also something that shows us the control frenzy of Boost.
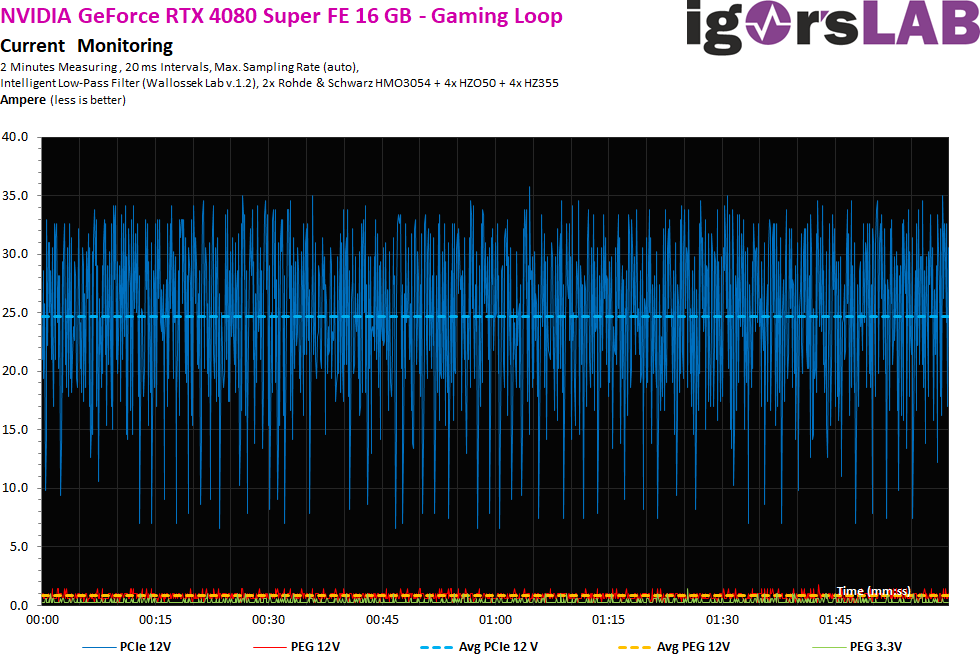
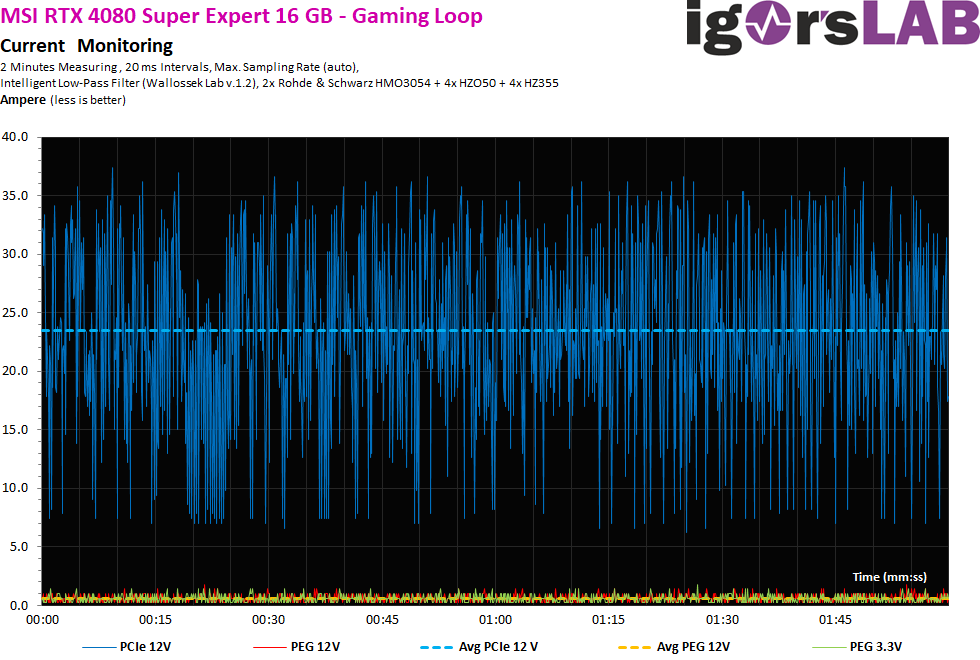
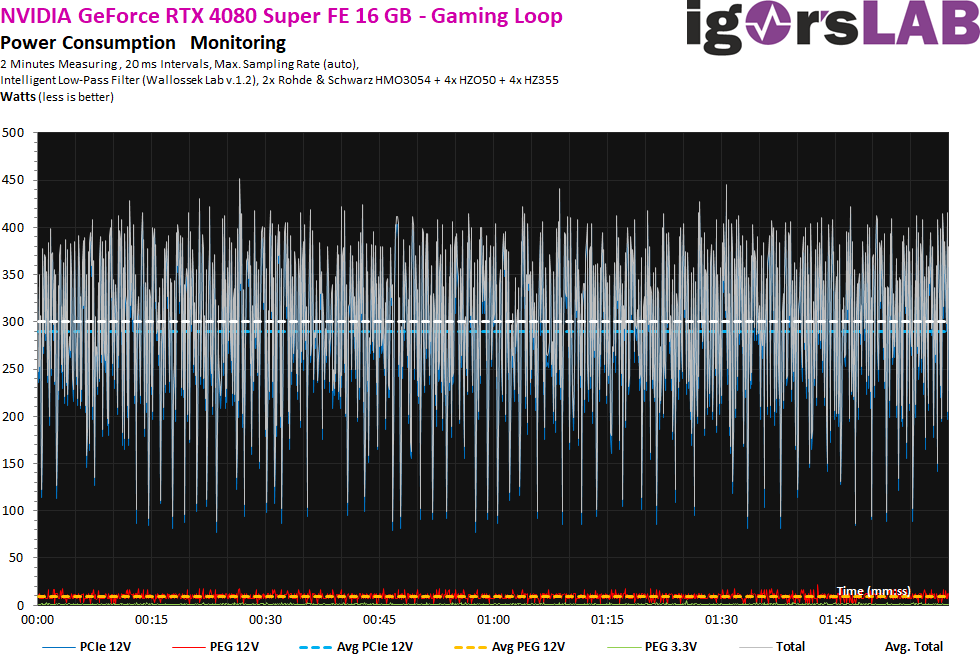
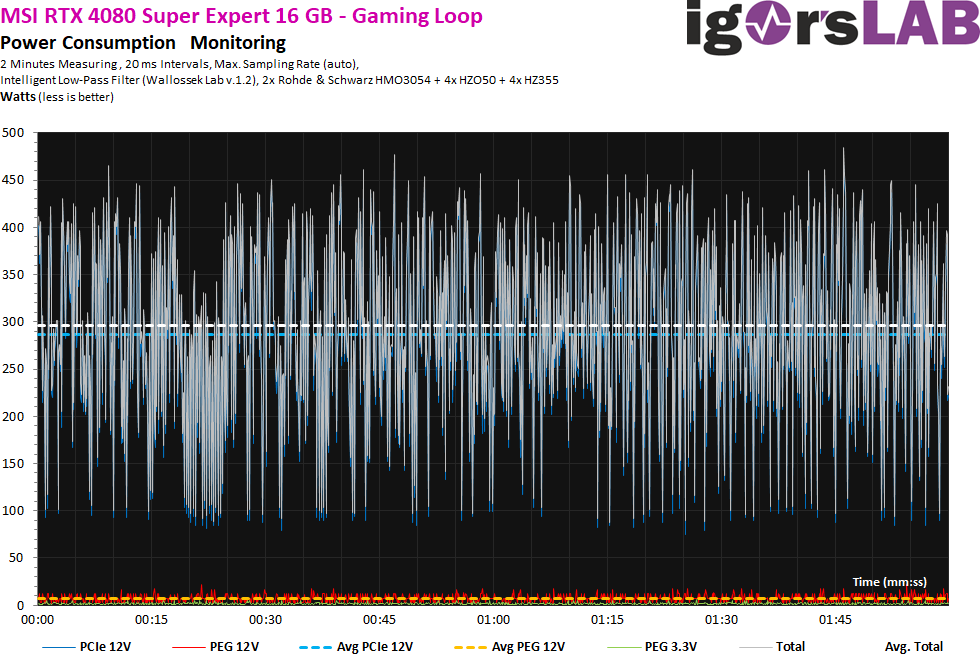
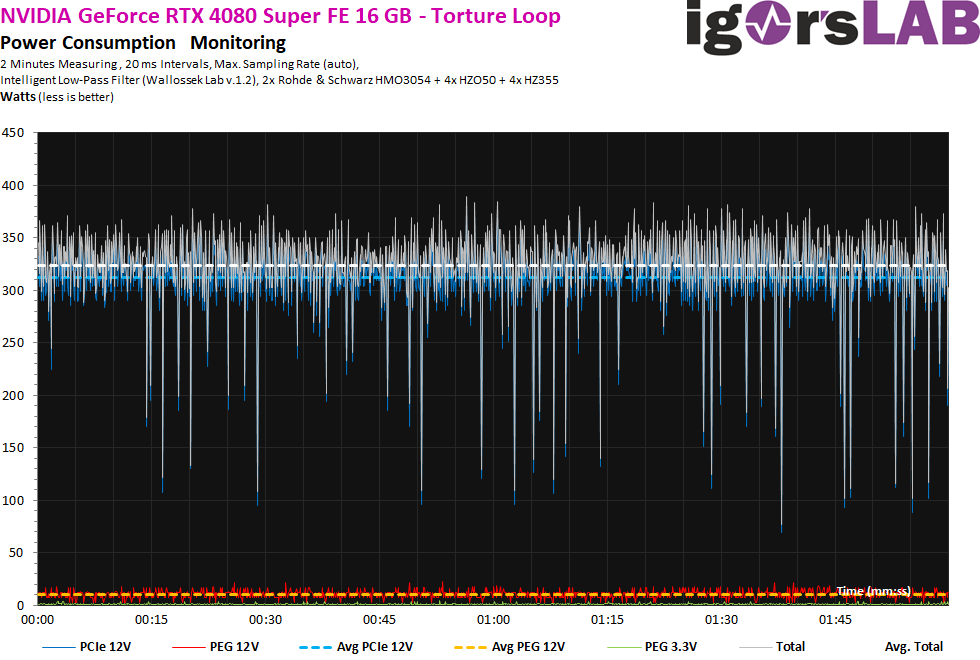
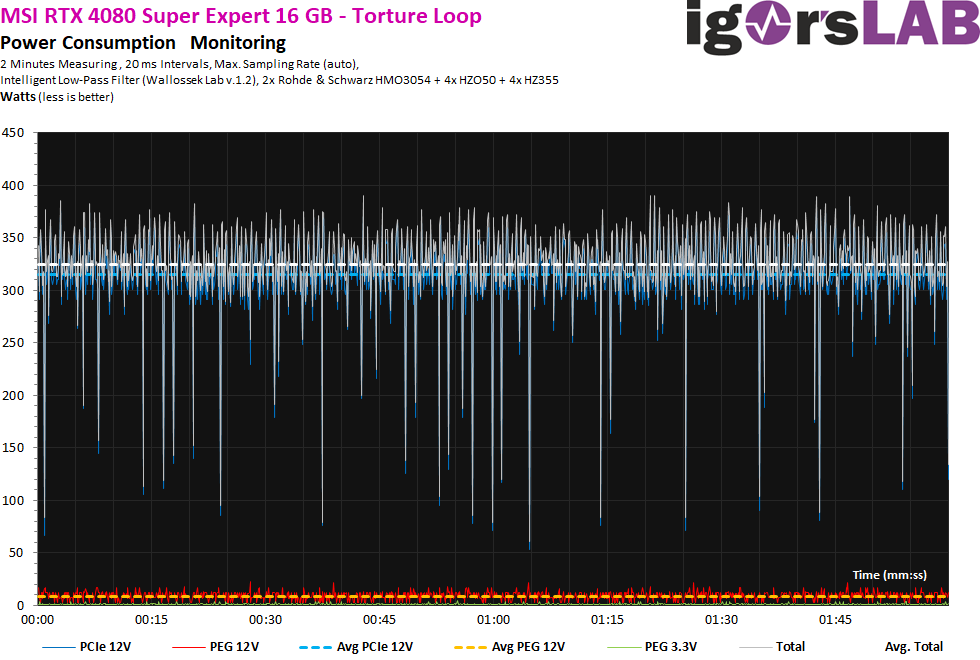
Nevertheless, we still need to take a look at the voltages, or the product of voltage and current flow. I already wrote that I took measurements at different power supply connections, even if all the connections on the graphics card’s circuit board meet again somehow at the end. What we can now see here as much clearer fluctuations and peaks is due to the partially slightly overvoltage power supply and therefore to the voltage and not the currents. This is due to technical reasons, but is not a problem. However, we can also see that the peaks at just under or slightly over 450 watts are not solely due to the flowing current (graphics card), but actually result from the power supply! This is also due to the topology and we also see that the MSI card regulates somewhat more “expansively”.
The Torture test is hardly any different. The super variants are now generally a little more hectic.
If you now add the voltage again, you will see a stronger ripple, which in turn results from the somewhat jittery operating voltage. However, to the power supply’s credit, it must also be said that this affects all current products from all manufacturers and can hardly be avoided.

- 1 - Introduction, technical data and technology
- 2 - Unboxing and technical details of both cards
- 3 - Test system and measuring equipment
- 4 - Teardown: PCB and components
- 5 - Teardown: Cooler and fans
- 6 - Material analysis: NVIDIA RTX 4080 Super FE 16GB
- 7 - Material analysis: MSI RTX 4080 Super Expert 16GB
- 8 - Gaming-Performance WQHD (2560 x 1440)
- 9 - Gaming Performance Ultra-HD (3840 x 2160)
- 10 - Gaming Performance DLSS vs. FSR
- 11 - Gaming performance with Frame Generation
- 12 - Latencies and lags
- 13 - Workstation graphics and rendering
- 14 - Details: Power consumption and load balancing
- 15 - Load peaks, capping and power supply recommendation
- 16 - Temperatures, clock rates and infrared analysis
- 17 - Fan curves, noise level and audio samples
- 18 - Summary and conclusion


38 Antworten
Kommentar
Lade neue Kommentare
Veteran
Urgestein
Mitglied
Mitglied
Urgestein
Veteran
Veteran
Urgestein
Urgestein
Urgestein
Urgestein
Moderator
Veteran
Urgestein
Mitglied
Urgestein
Urgestein
Alle Kommentare lesen unter igor´sLAB Community →