


Sum of all games
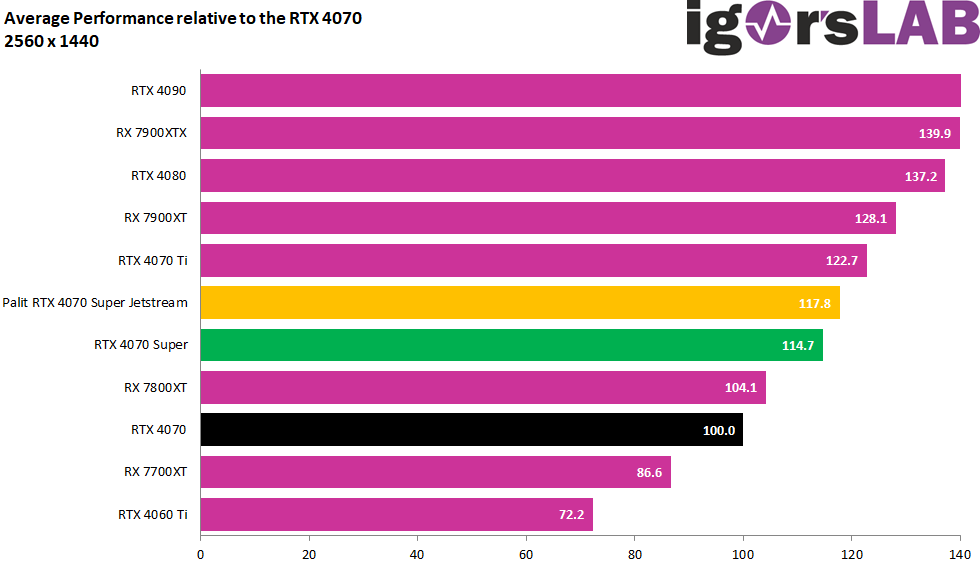
I have normalized the FPS and percentiles again and formed a geometric mean (Geomean) because this is simply more accurate from a statistical point of view and is also used in the industry. Once again, we compare the RTX 4070 and RTX 4070 Super Founders Edition with the rest.
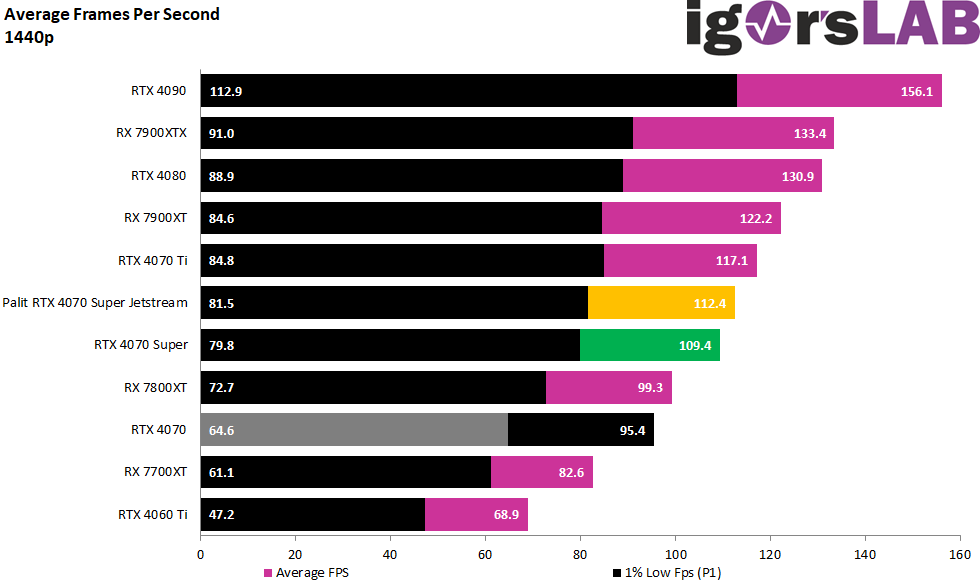
The RTX 4070 Super Jetstream takes almost 18 percent from the non-Super and is around 3 percentage points ahead of the FE. The Palit card is only just under 5 percentage points behind the RTX 4070 Ti Non-Super in QHD.
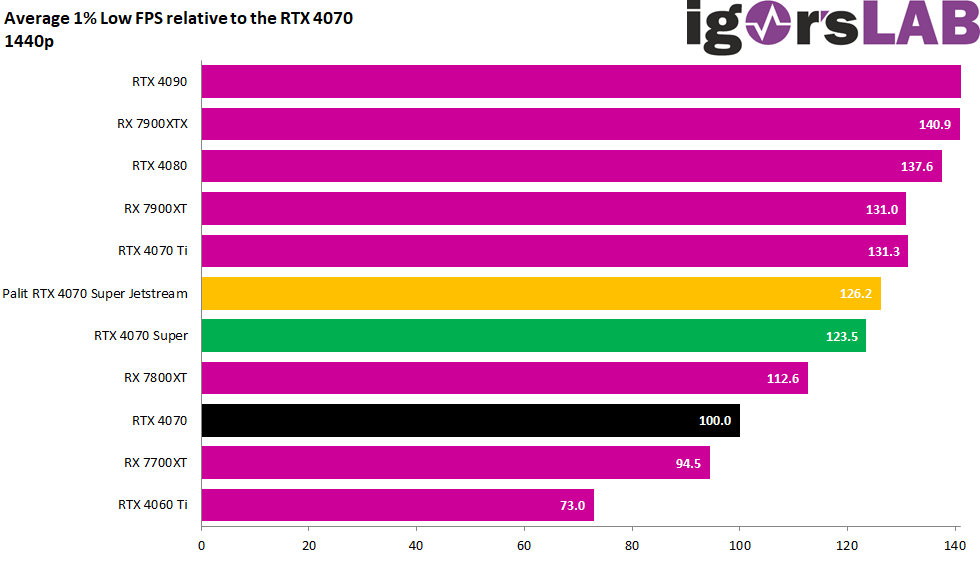
In P1, i.e. the Min FPS, the card with the larger cache is suddenly much more clearly ahead, as the CPU is no longer limiting either.
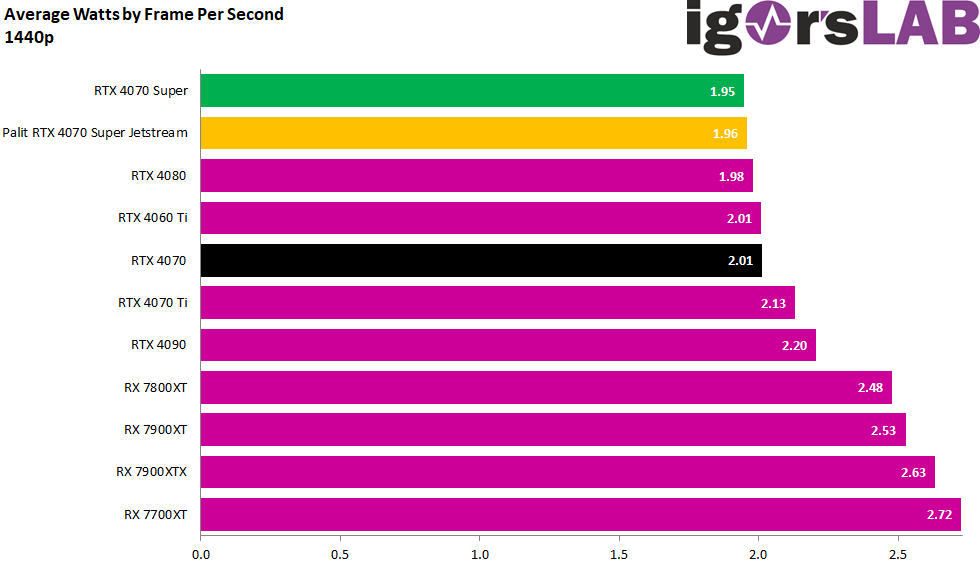
The very pleasant power consumption in relation to the performance continues seamlessly here, also in terms of height. Because 9.5 watts more than the FE is nothing that would immediately drive you to ruin.
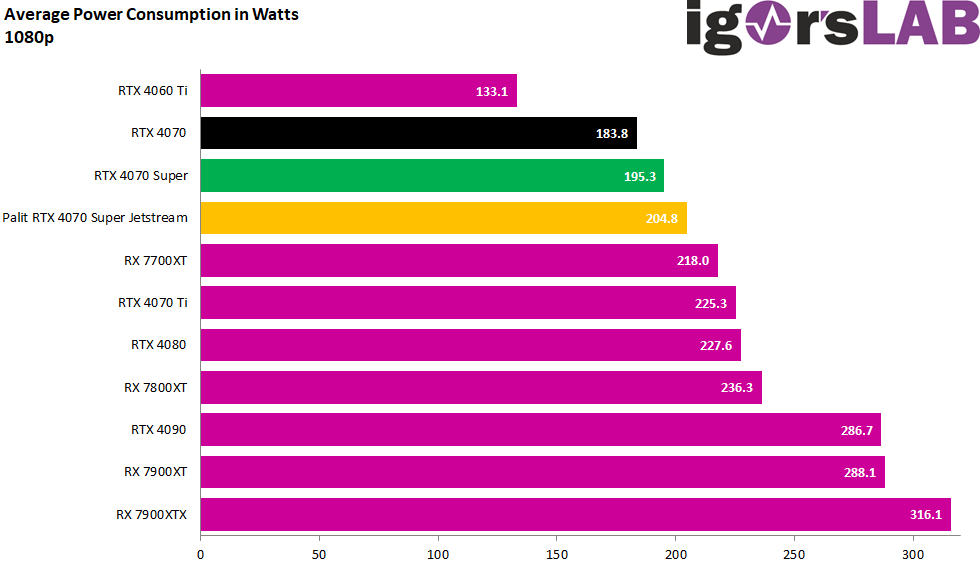
Because it doesn’t really harm the efficiency either:

- 1 - Intro, technical Data and Unboxing
- 2 - Test System and Equipment
- 3 - Teardown: PCB, Components and Cooler
- 4 - Material Analysis
- 5 - Gaming Performance FHD (1920 x 1080)
- 6 - Gaming-Performance WQHD (2560 x 1440)
- 7 - Gaming Performance Ultra-HD (3840 x 2160)
- 8 - Power Consumption and Load Balancing
- 9 - Transients and PSU Recommendation
- 10 - Clock Rate, Temperatures and Infrared Analysis
- 11 - Fan Curves and Noise
- 12 - Summary and Conclusion


134 Antworten
Kommentar
Lade neue Kommentare
Urgestein
Veteran
Veteran
Urgestein
Mitglied
Veteran
Urgestein
Urgestein
Urgestein
1
Veteran
Urgestein
1
Mitglied
Urgestein
Mitglied
Urgestein
Urgestein
Alle Kommentare lesen unter igor´sLAB Community →