


Sum of all games
I normalized the FPS and percentiles again and formed a geometric mean (Geomean), because this is simply more accurate statistically and is also handled that way in the industry. We again compare the cards with 115 watts power target and those with 121 watts plus overclocking.
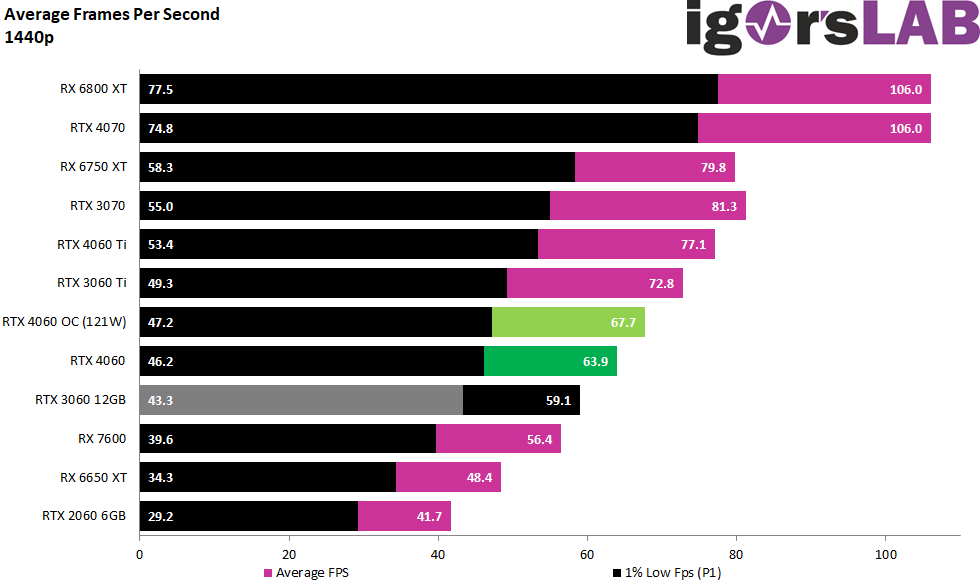
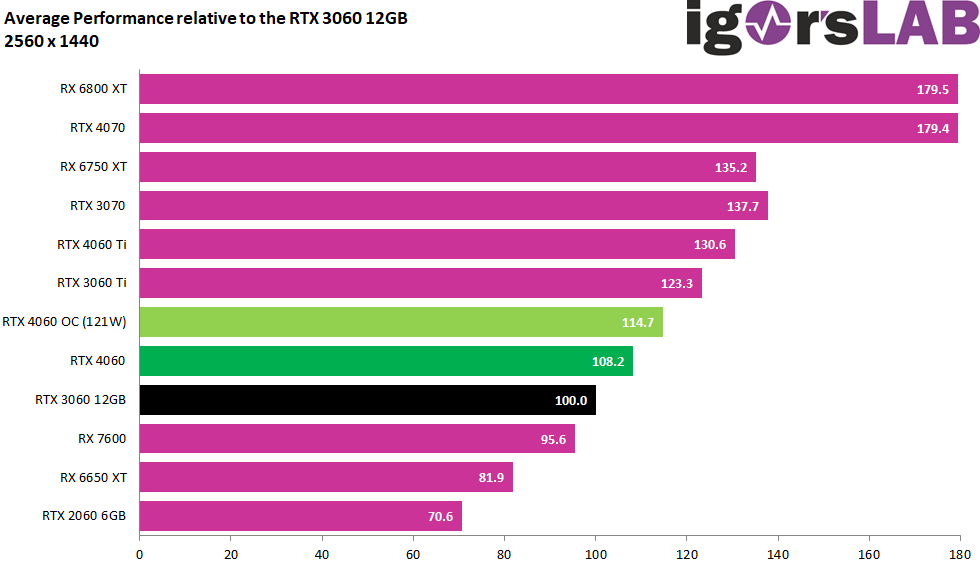
The RTX 4060 OC is 14.7% ahead of the GeForce RTX 3060 12 GB in QHD and 19.1 percentage points ahead of the Radeon RX 7600. The RTX 3060 Ti is only slightly behind with 8.6 percentage points and the RTX 4060 Ti is again in a completely different performance class with a lead of 15.9 percentage points.
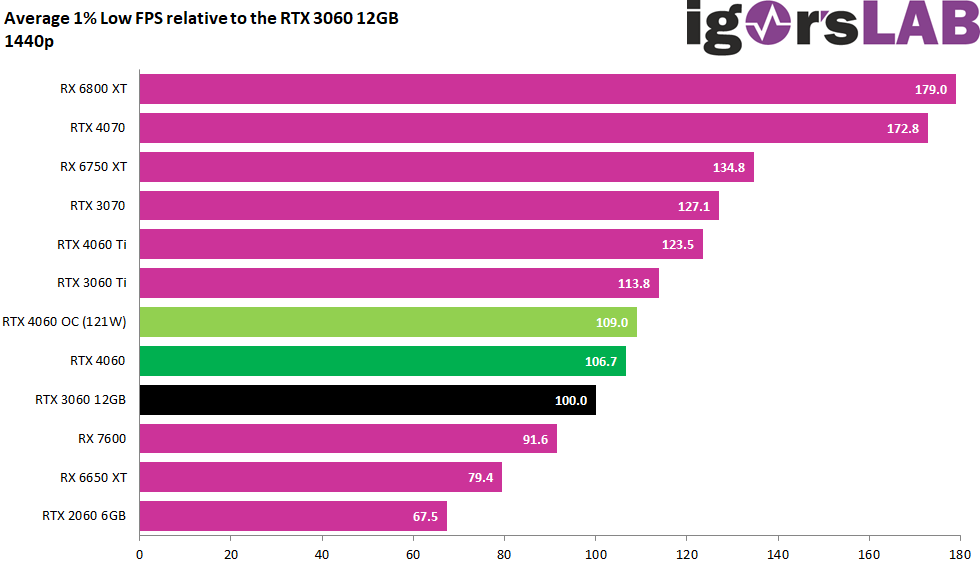
The P1, i.e. the Min FPS, separates the RTX 4060 OC and the RTX 3060 12 GB by 9%. The MSRP card is 2.3% behind the OC version.
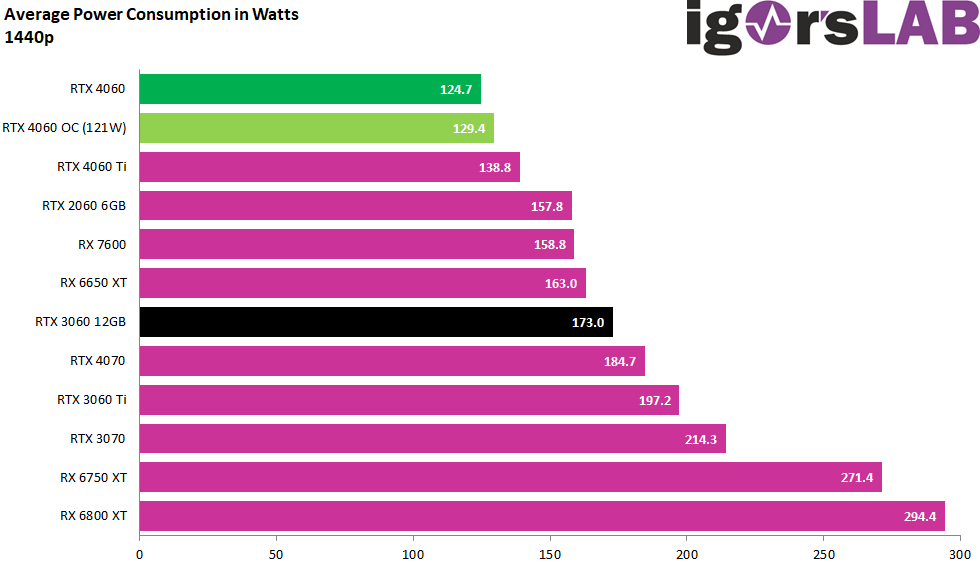
The significantly lower power consumption continues seamlessly here, even in terms of height. Just not in efficiency, but I’ll come to that later
I won’t go into the individual metrics here, as I did in Full-HD, because the basic statements don’t change at all compared to yesterday’s card.

- 1 - Einführung, technische Daten und Technologie
- 2 - Test System im igor'sLAB MIFCOM-PC
- 3 - Teardown: PCB und Komponenten
- 4 - Gaming Performance FHD (1920 x 1080)
- 5 - Gaming-Performance WQHD (2560 x 1440)
- 6 - Gaming Performance DLSS vs. DLSS3 vs. FSR
- 7 - Lastspitzen, Kappung und Netzteilempfehlung
- 8 - Temperaturen, Taktraten, Lüfter und Geräuschentwicklung
- 9 - Zusammenfassung und Fazit


20 Antworten
Kommentar
Lade neue Kommentare
Urgestein
1
Urgestein
Veteran
Mitglied
Urgestein
Veteran
Veteran
Veteran
Urgestein
Urgestein
Veteran
Mitglied
1
Mitglied
Moderator
Neuling
Neuling
Urgestein
Alle Kommentare lesen unter igor´sLAB Community →