


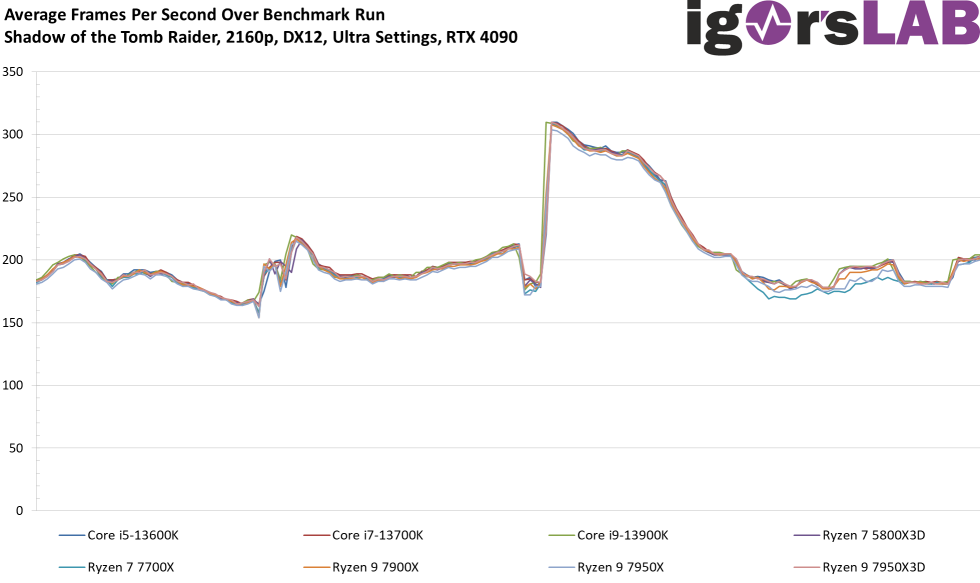
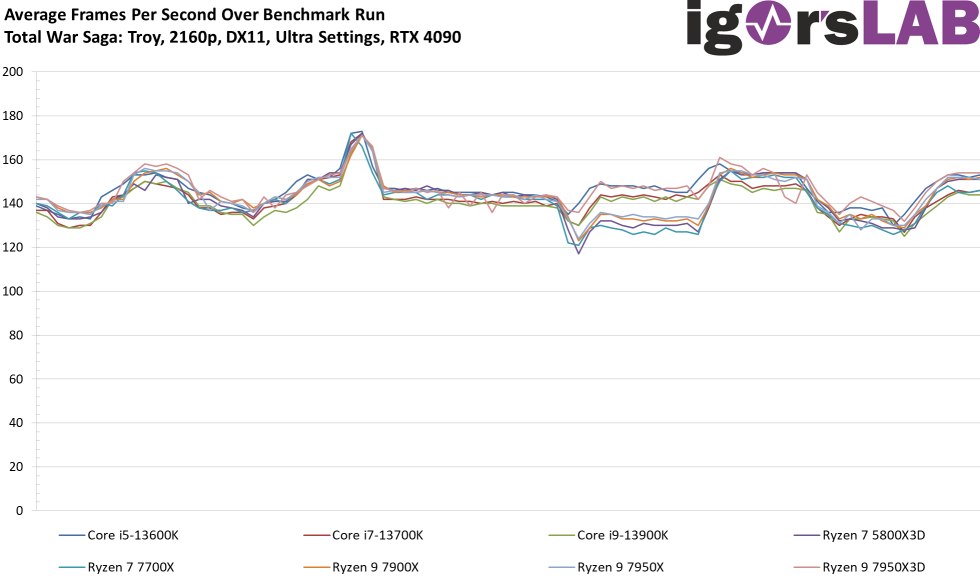
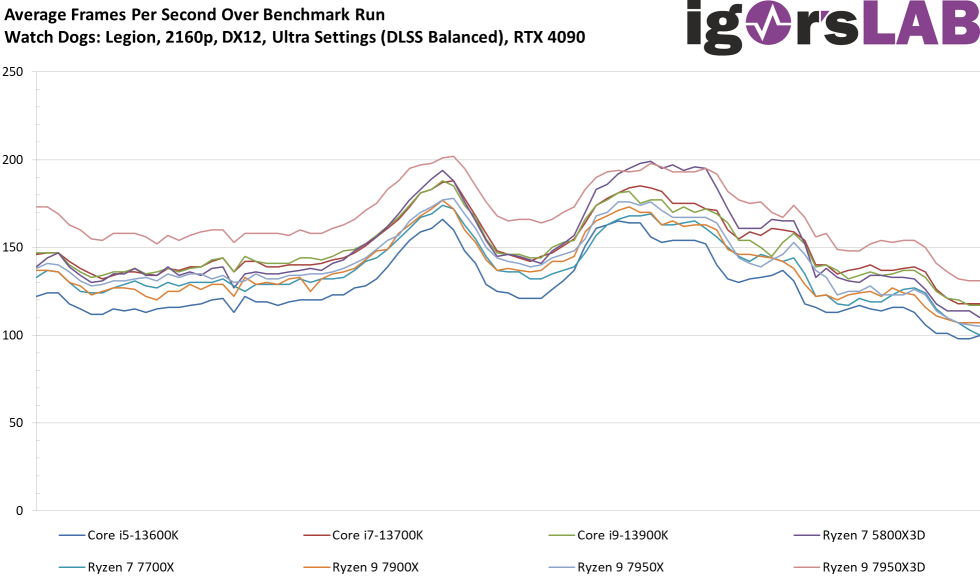
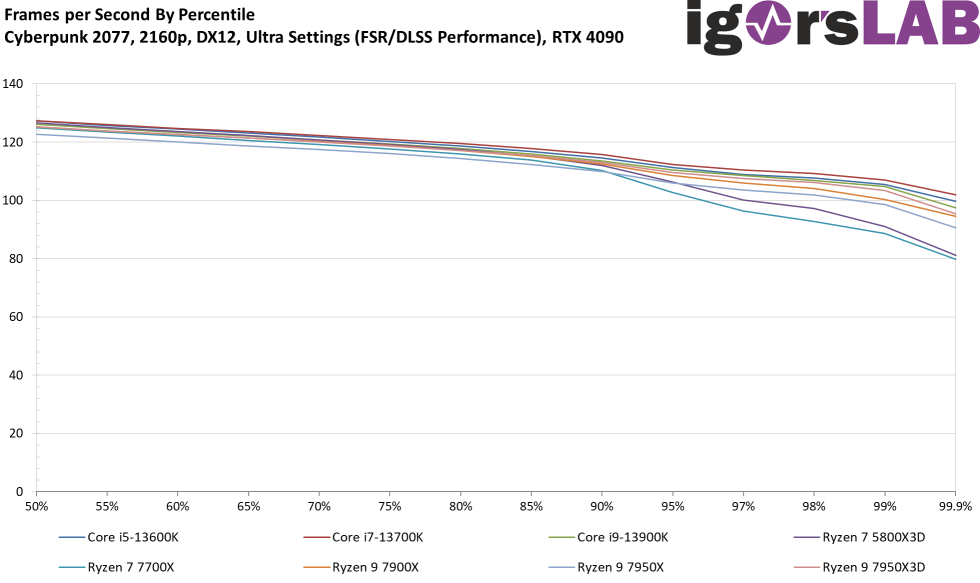
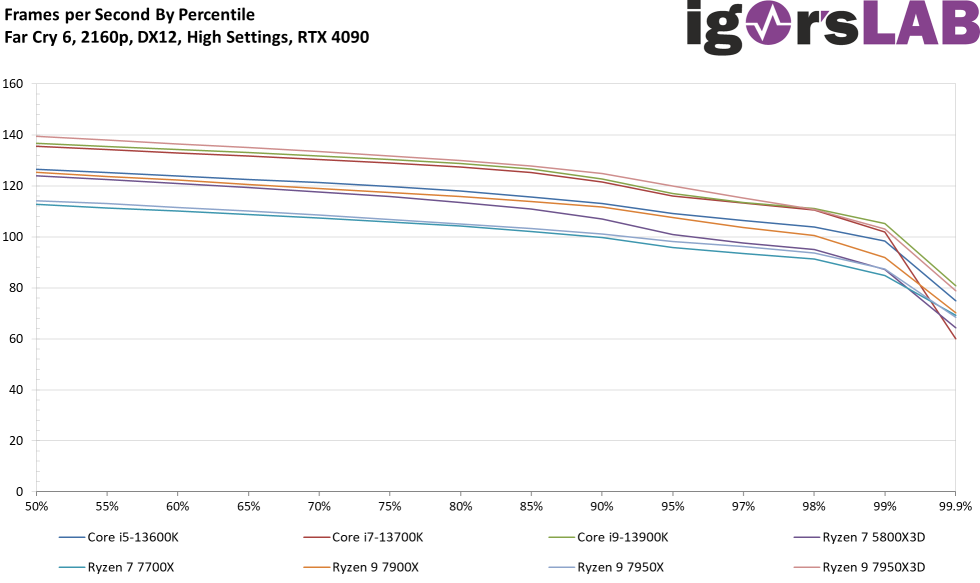
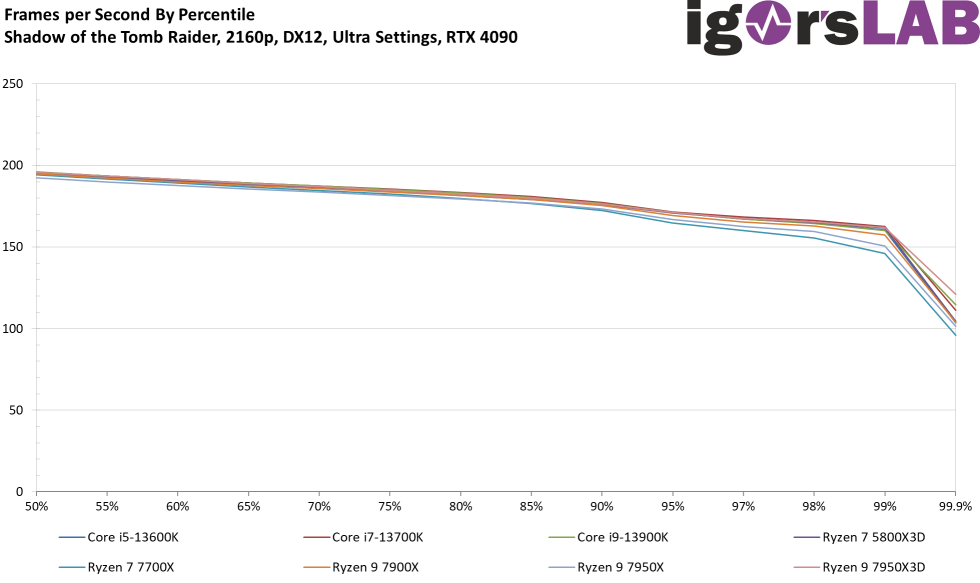
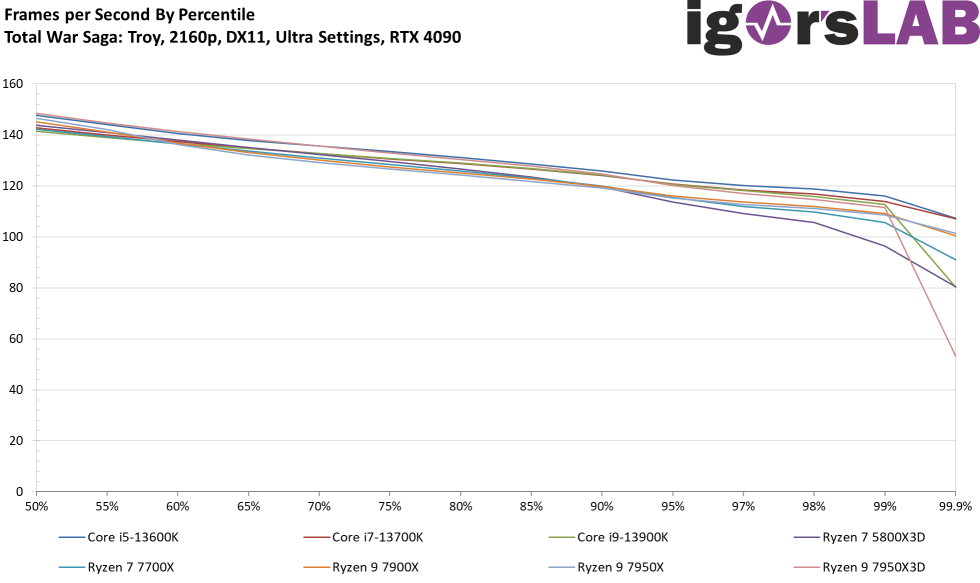
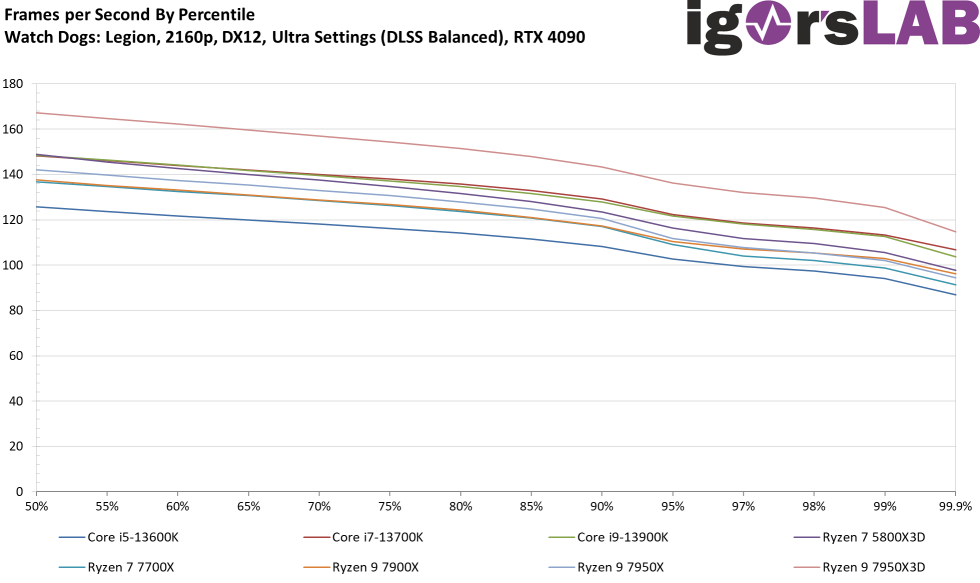
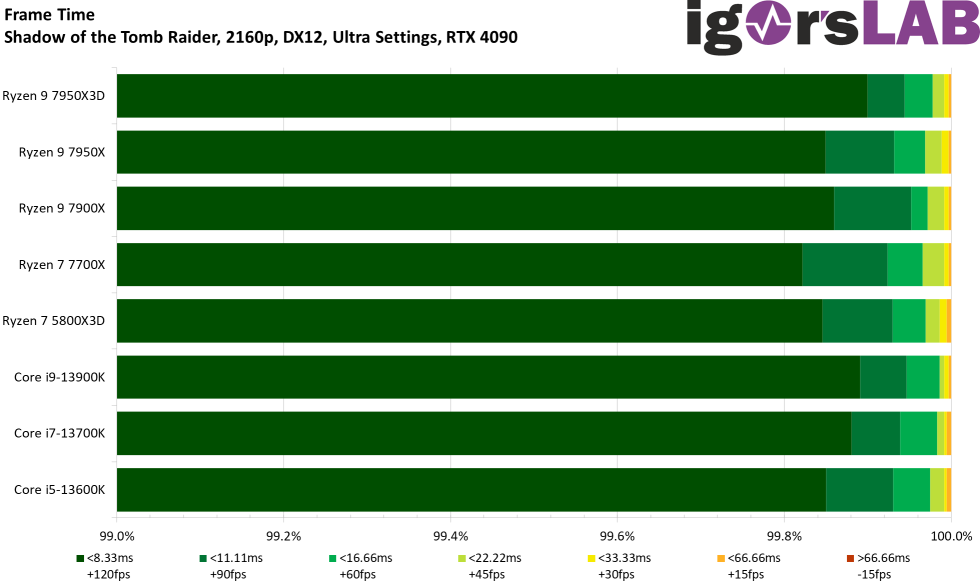
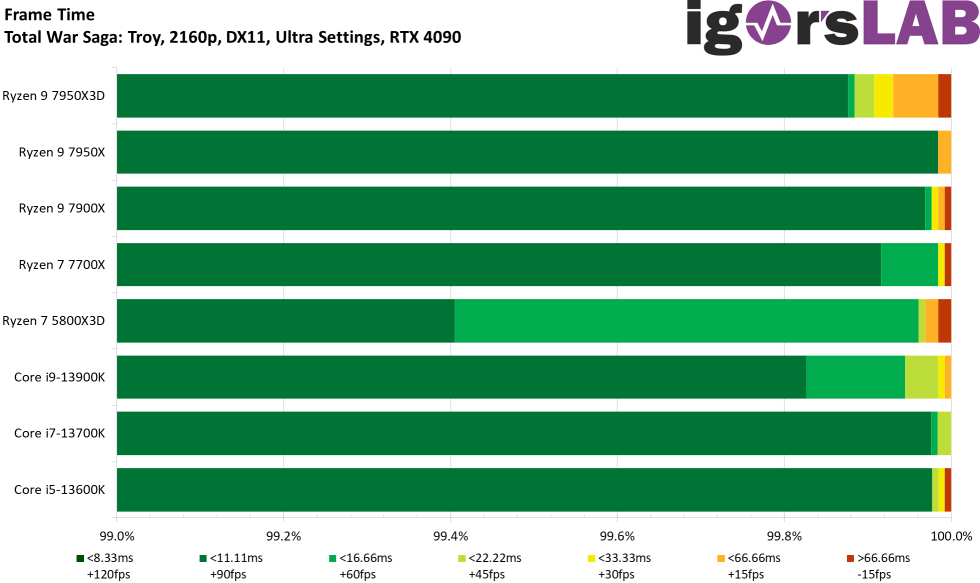
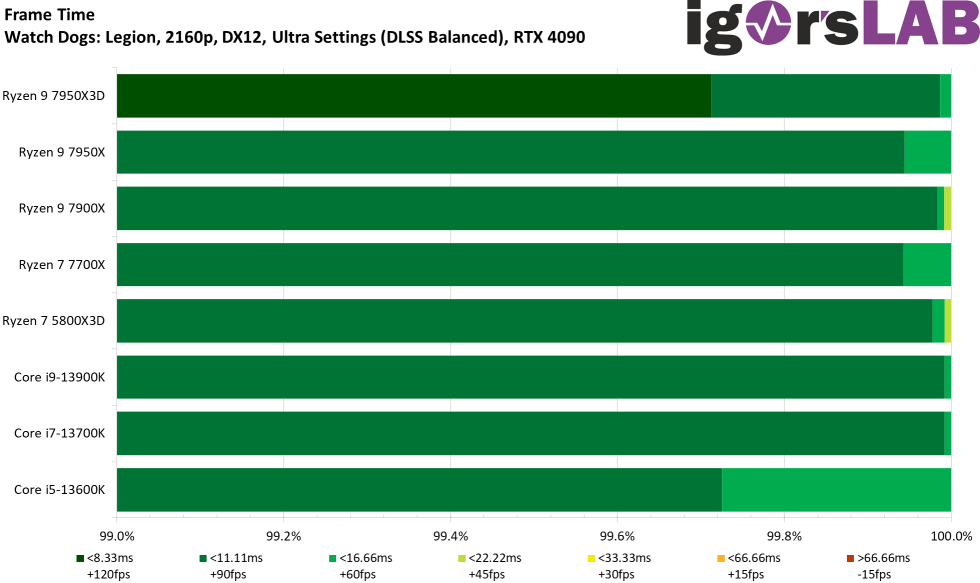
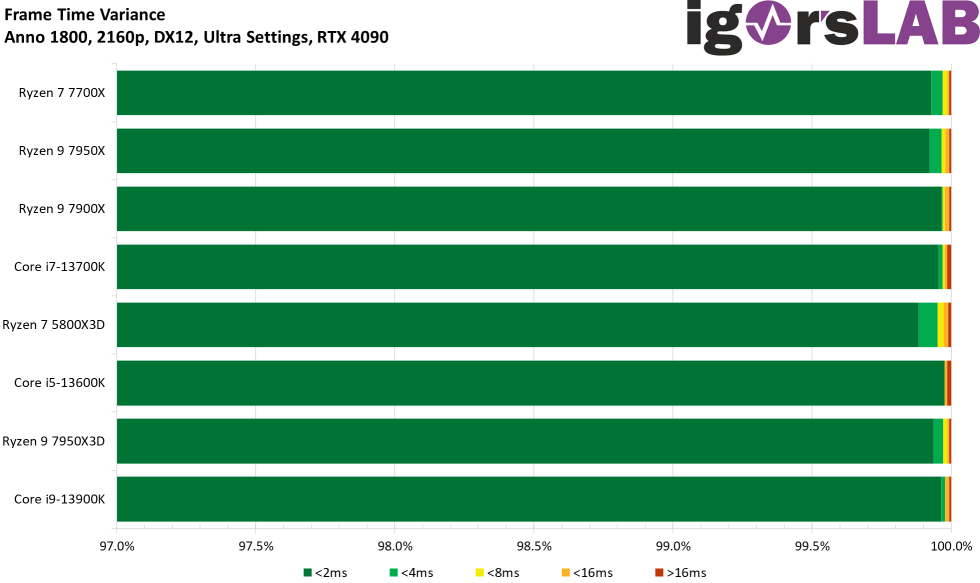
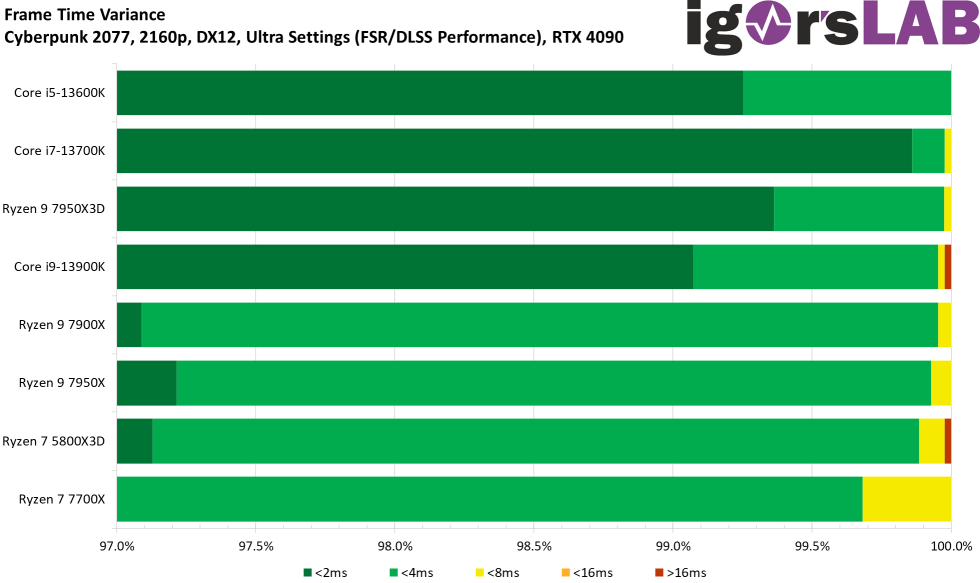
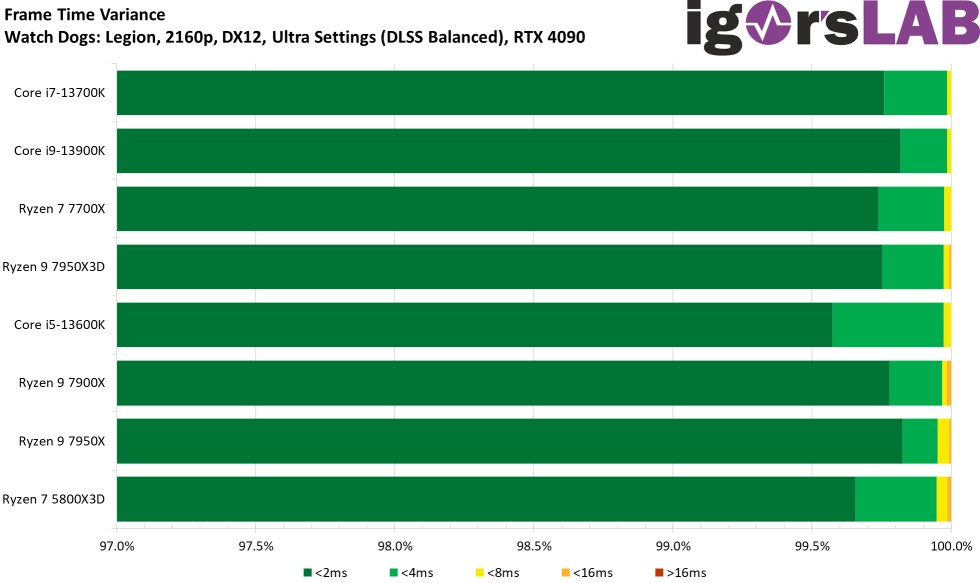
Summary of gaming performance in 2160 p
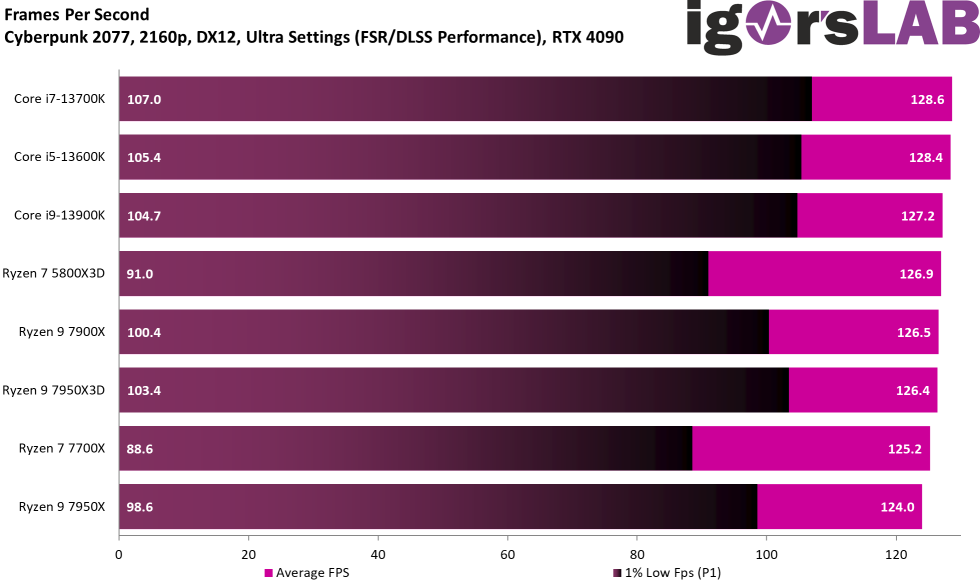
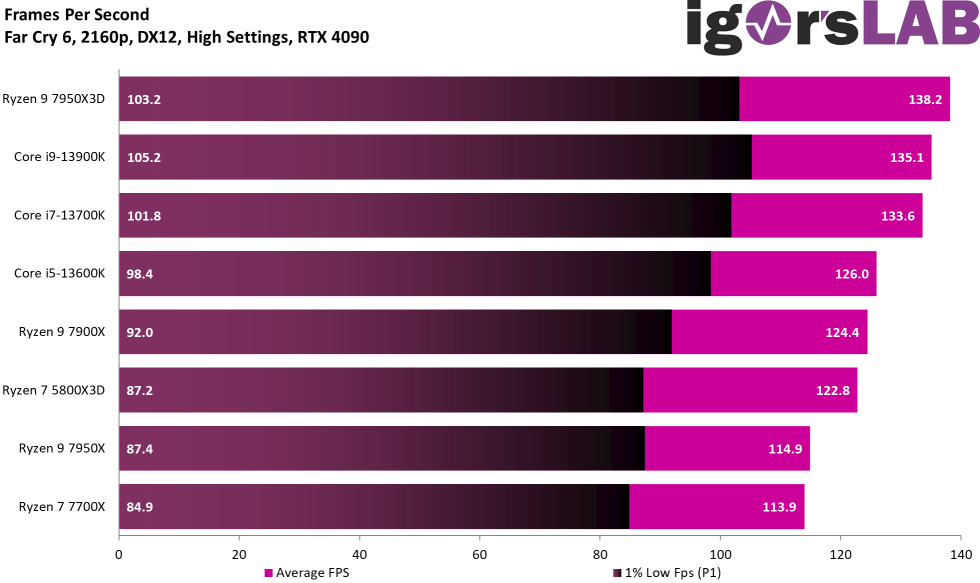
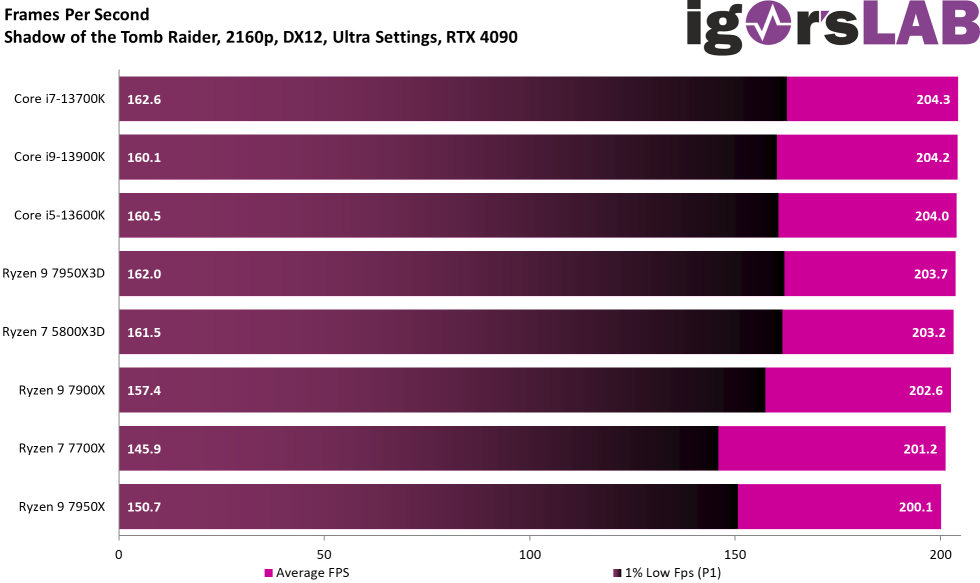
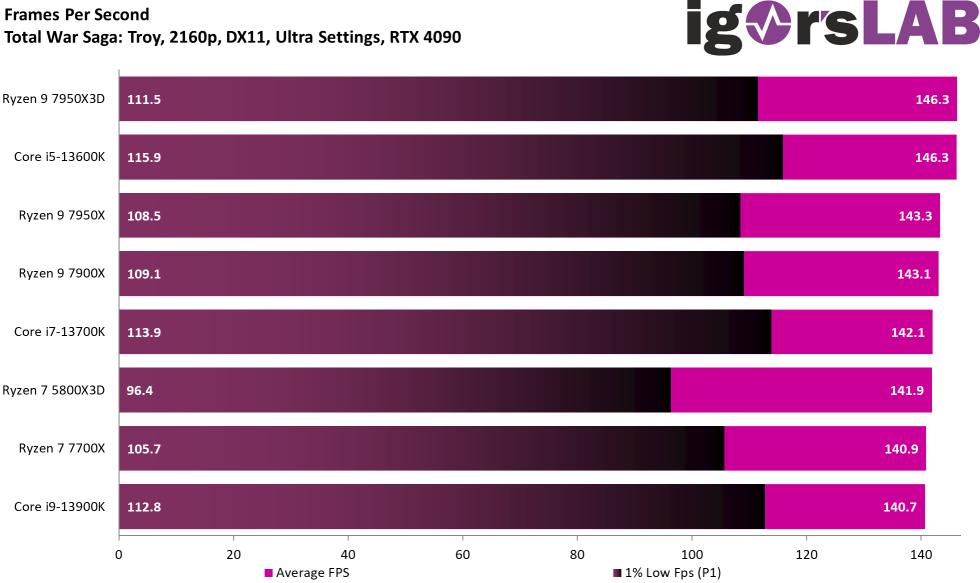
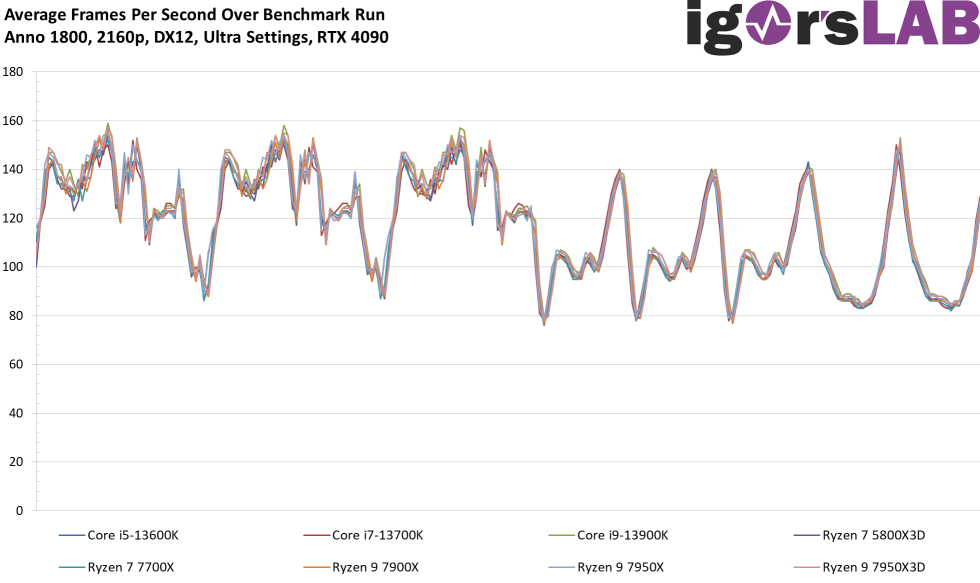
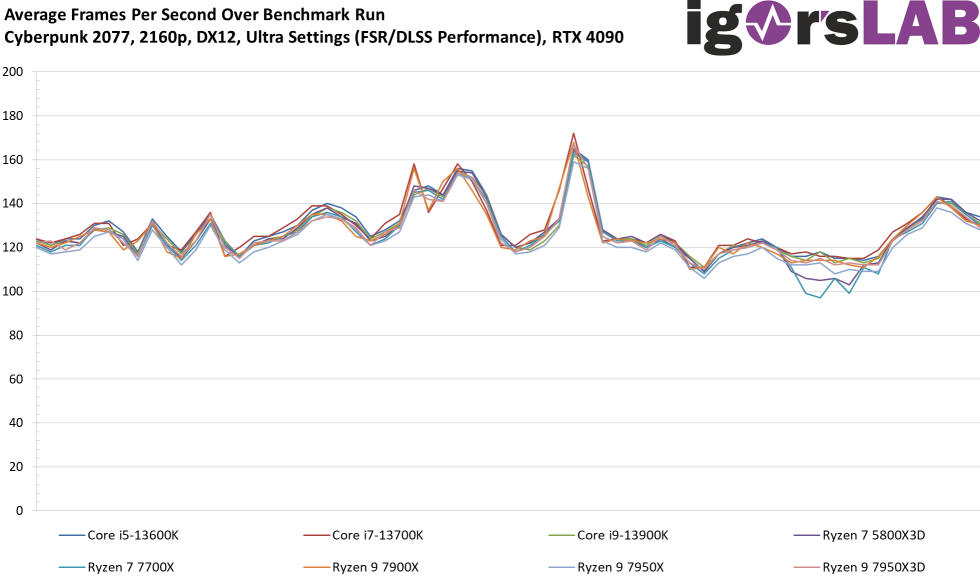
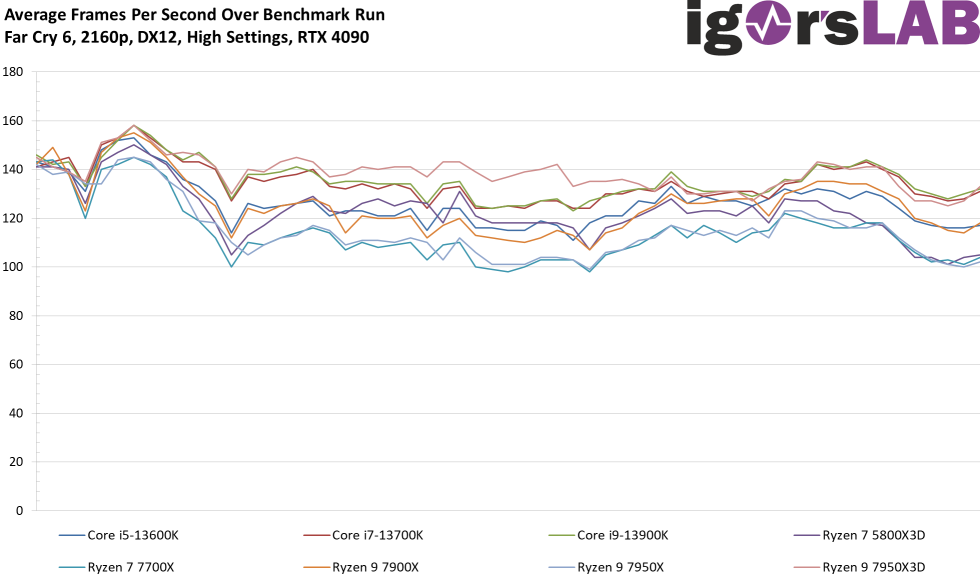
The GeForce RTX 4090 is starting to limit and I’ve toned down the quality settings a bit in two games and used DLSS to help in two others. Still, most of it is Ultra HD and therefore “real”. Yes, you are already moving hard in the area of measurement tolerances, but those who have followed the trend of the other three resolutions will recognize exactly this one again.
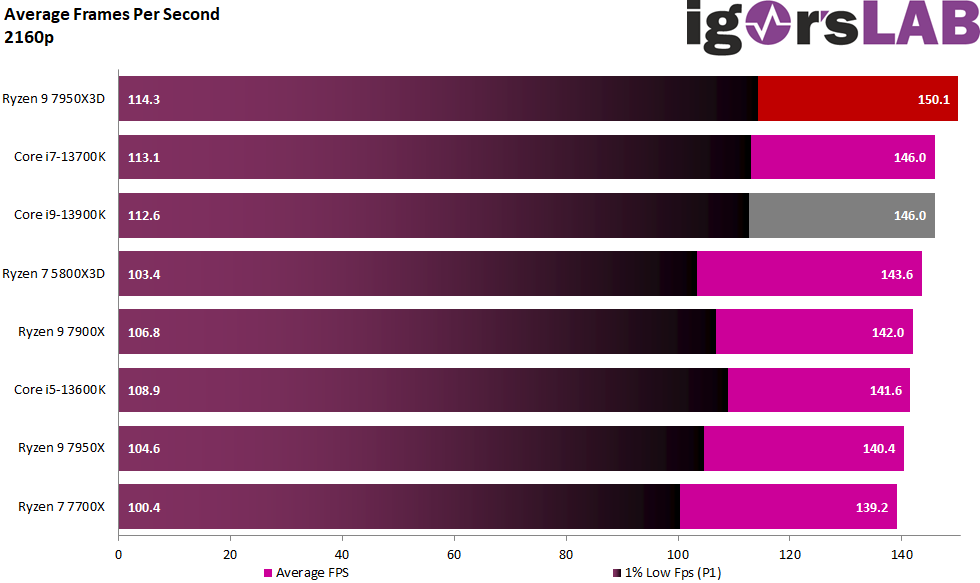
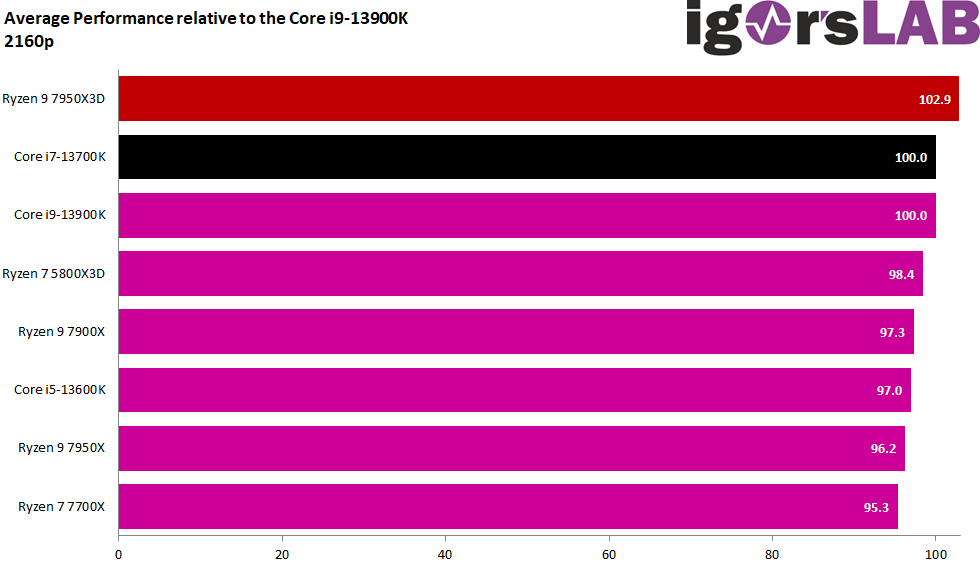
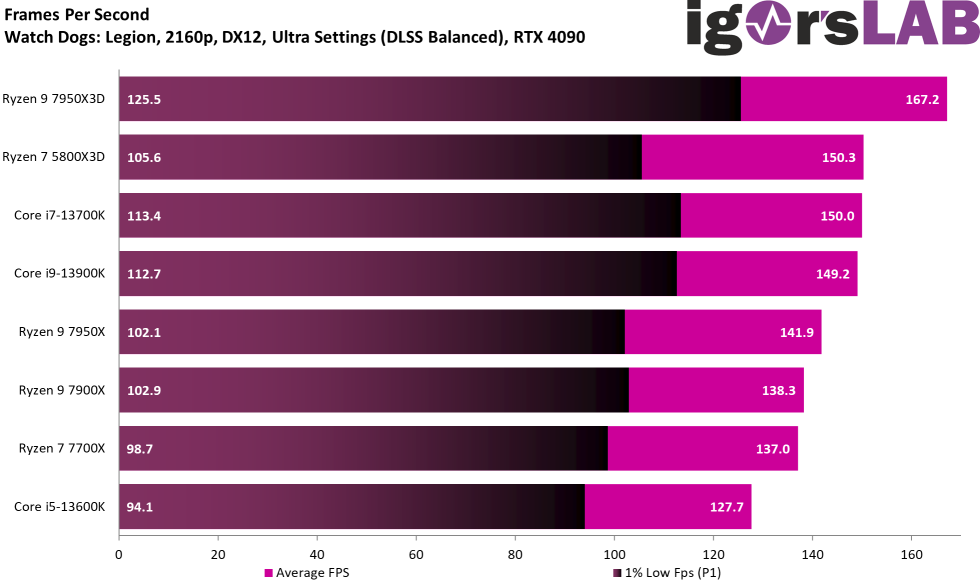
The Ryzen 9 7950X3D is now almost 3 percentage points ahead of the Core i9-13900K, which is more than just a measurement error, especially in terms of efficiency. It is still 4.5 percentage points ahead of the Ryzen 7 5800X3D and 5.6 percentage points ahead of its direct counterpart, the Ryzen 9 7950X without the 3D cache. The Ryzen 7 7700X is once again the taillight here. But even if the margins have become really small: there is a clear winner.
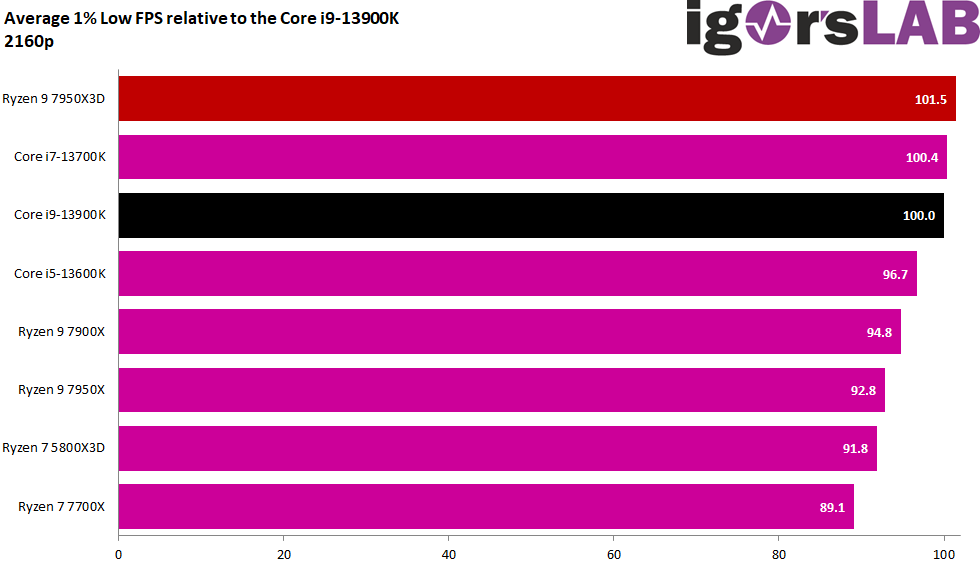
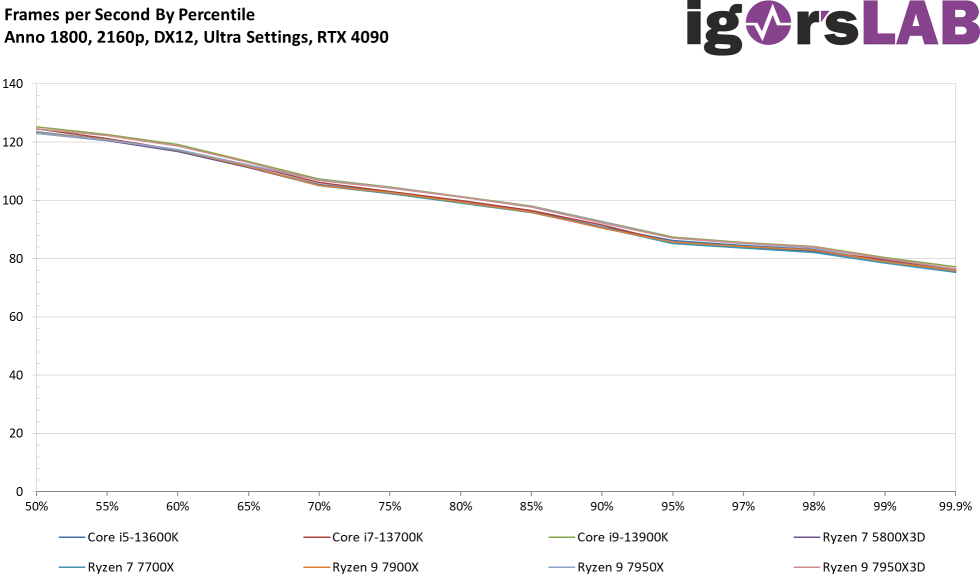
The output at the P1, i.e. the new Min FPS, also has a winner. Here, the Ryzen 9 7950X3D is again just ahead, even if it is more of a tie with the Core i9 and Core i7. The rest is running behind as usual.
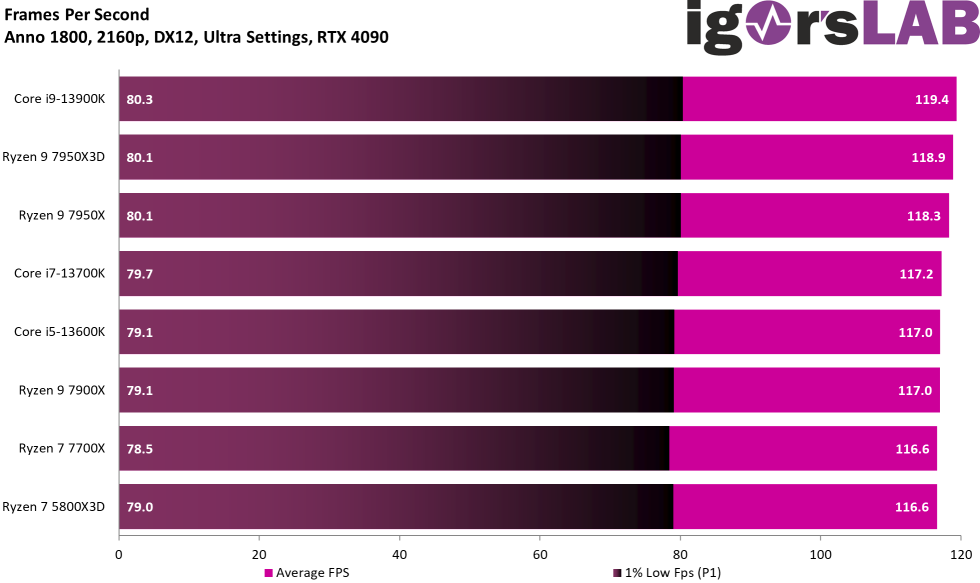
Performance metrics of the individual tests

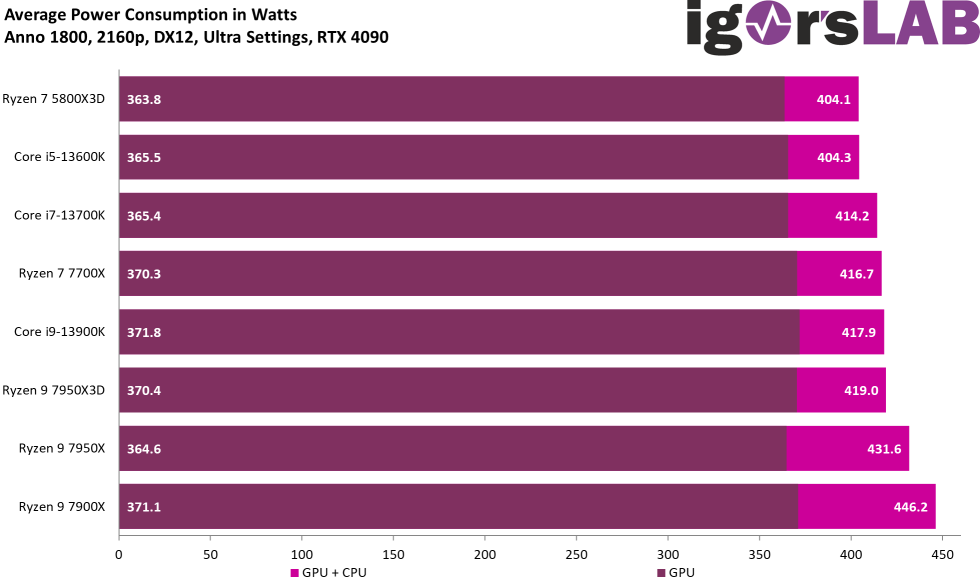
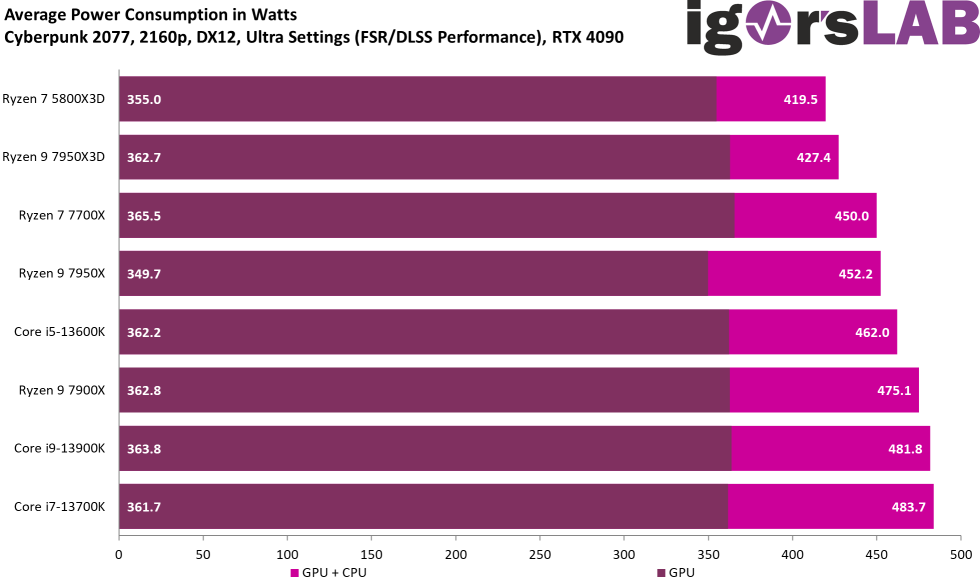
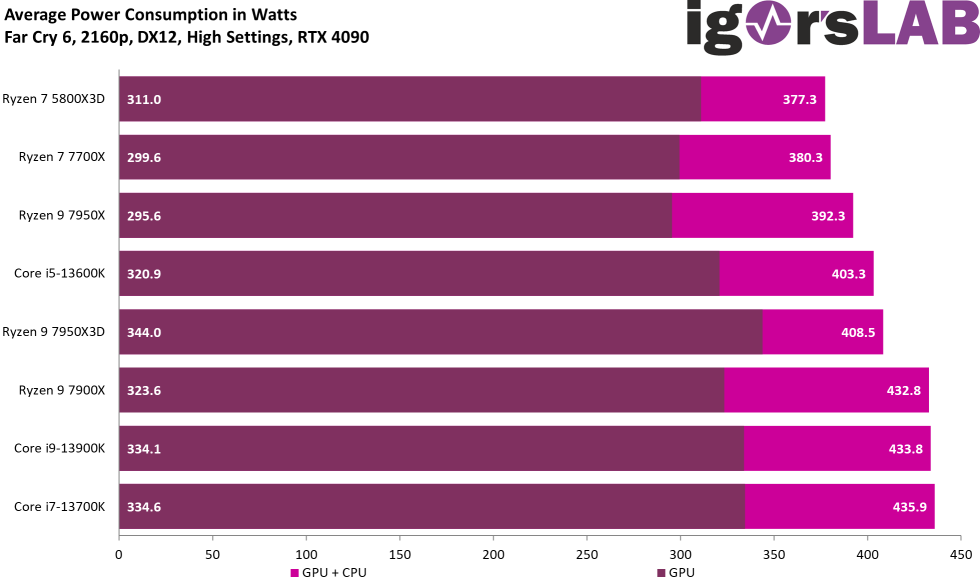
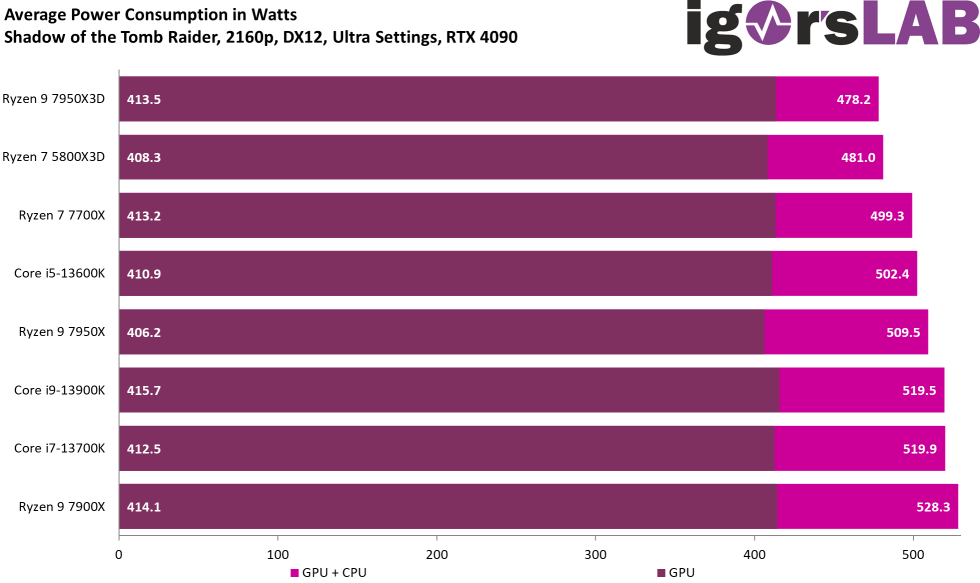
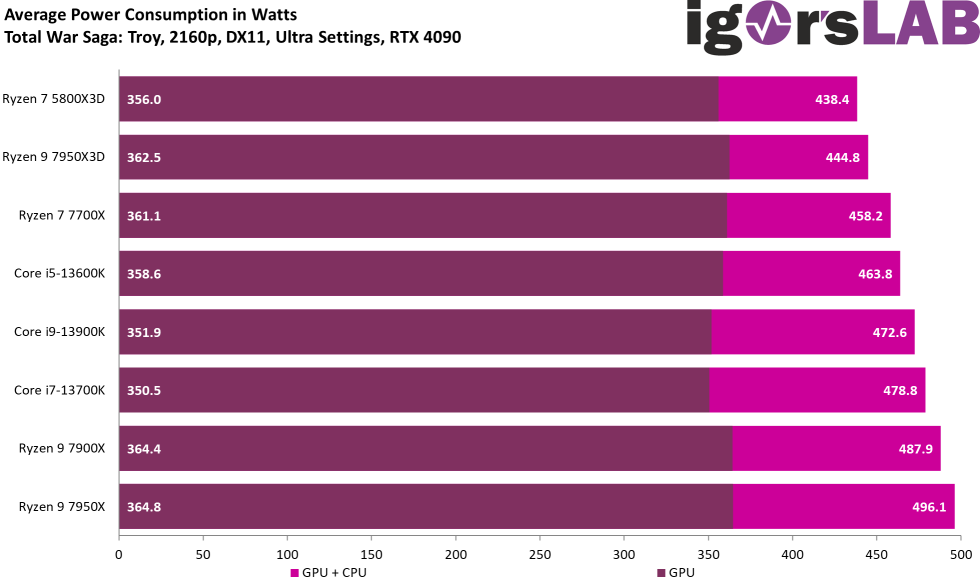
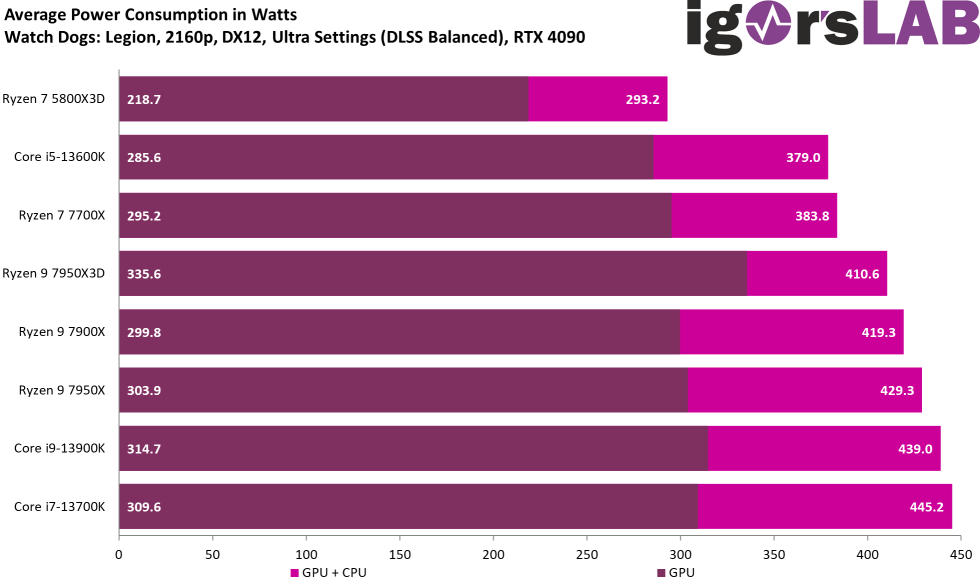
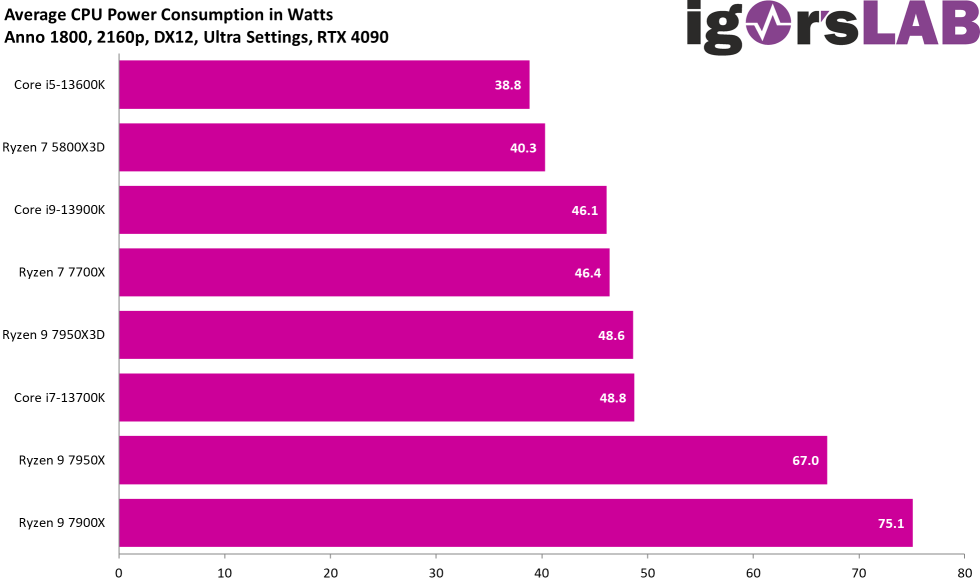
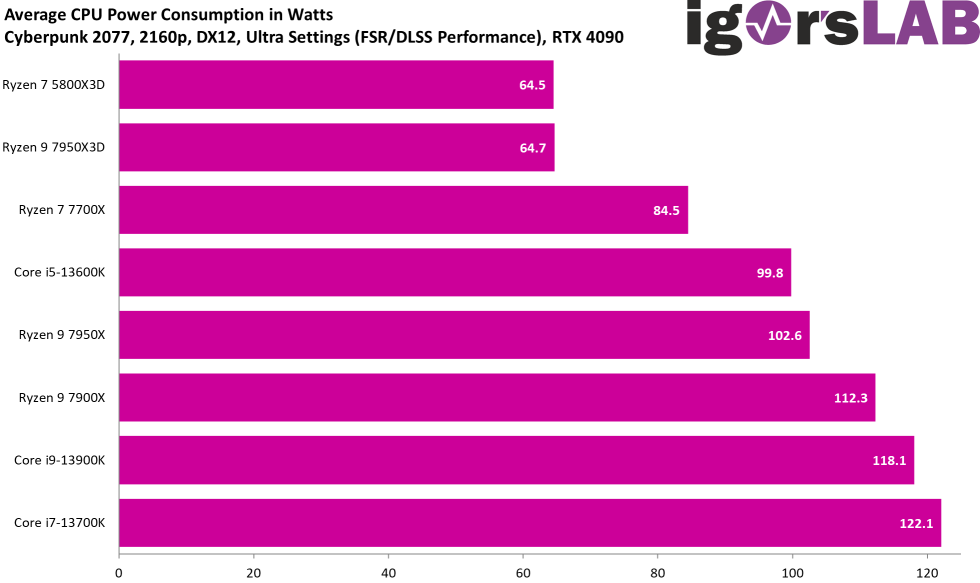
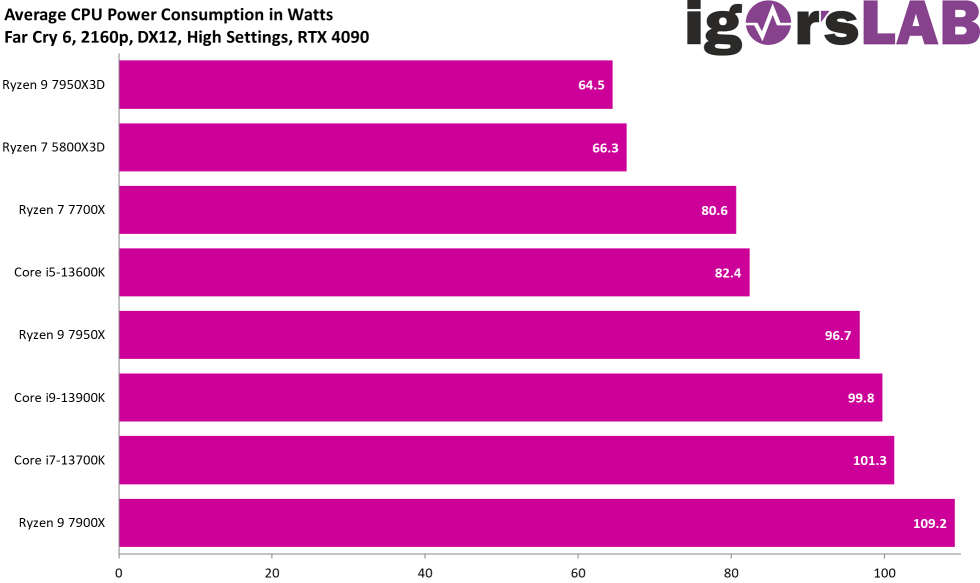
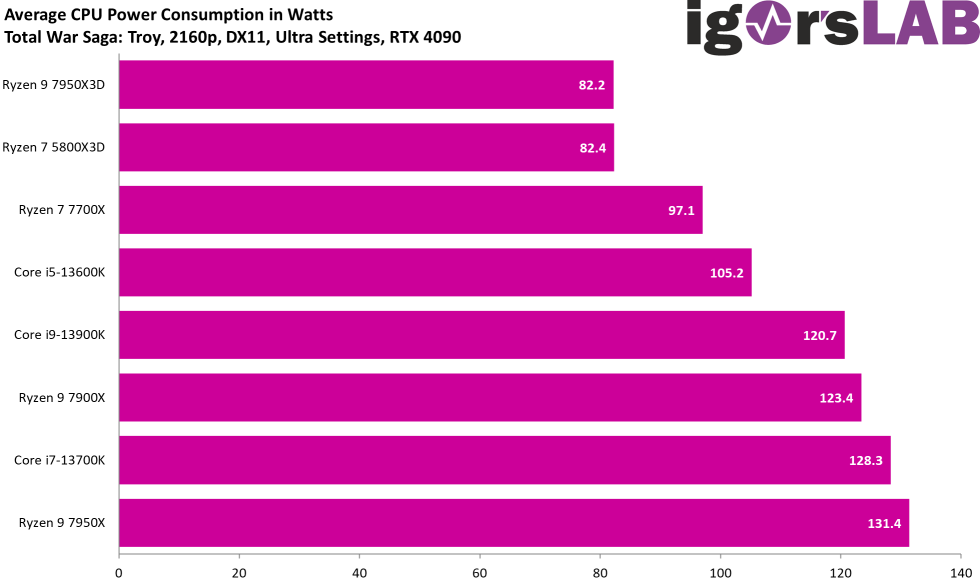
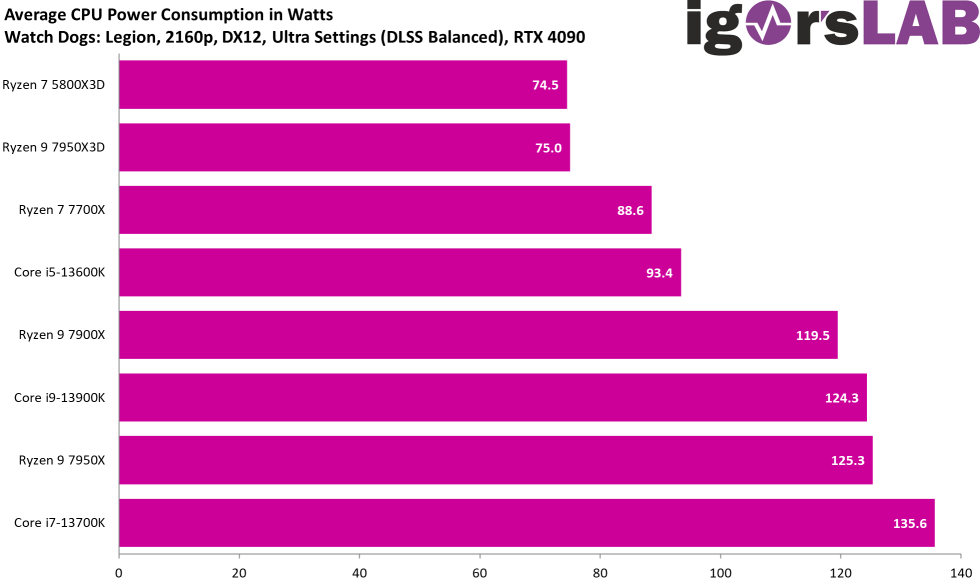
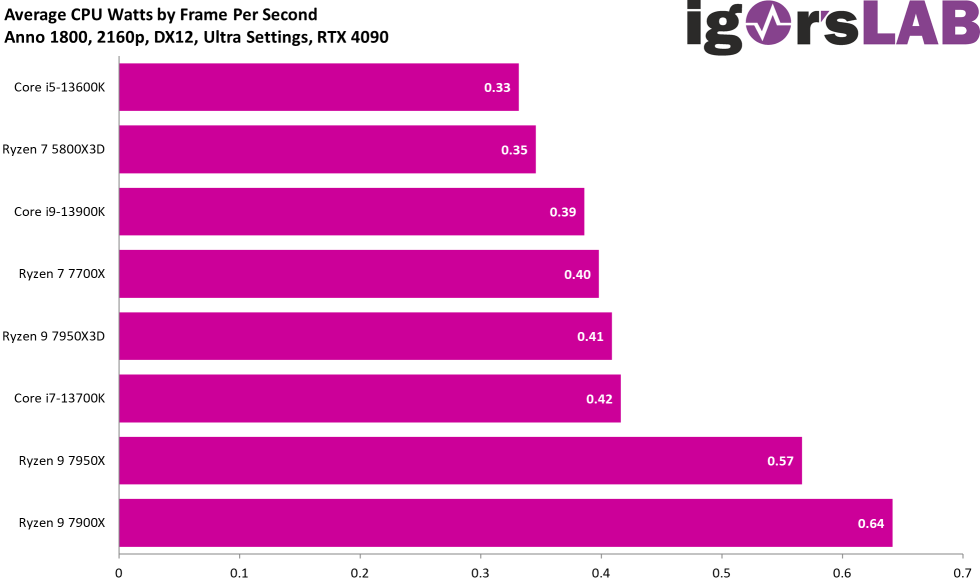
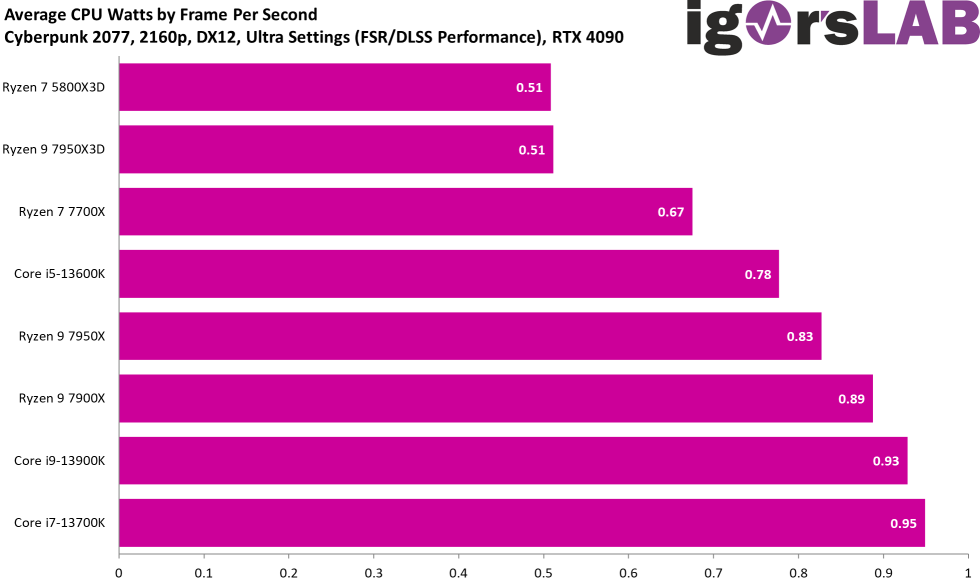
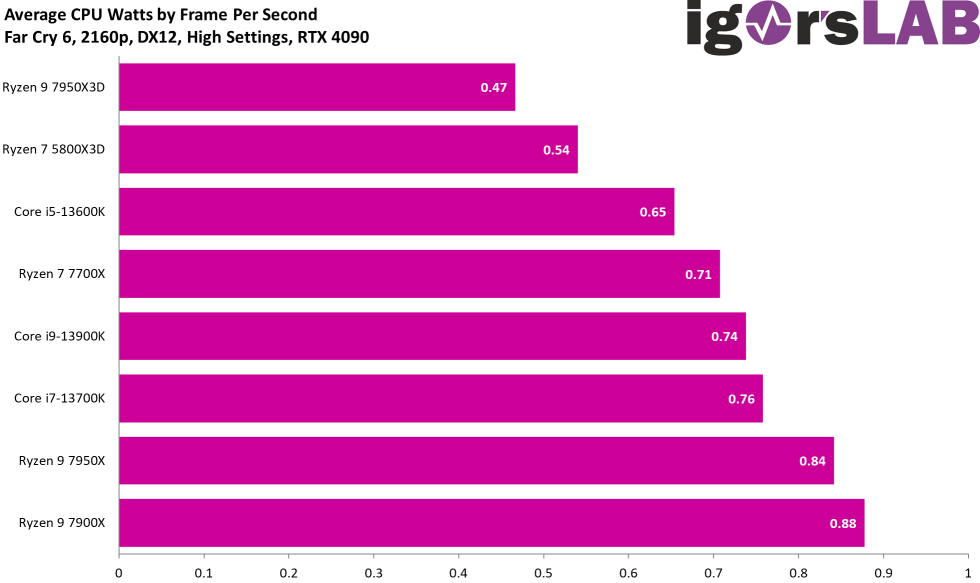
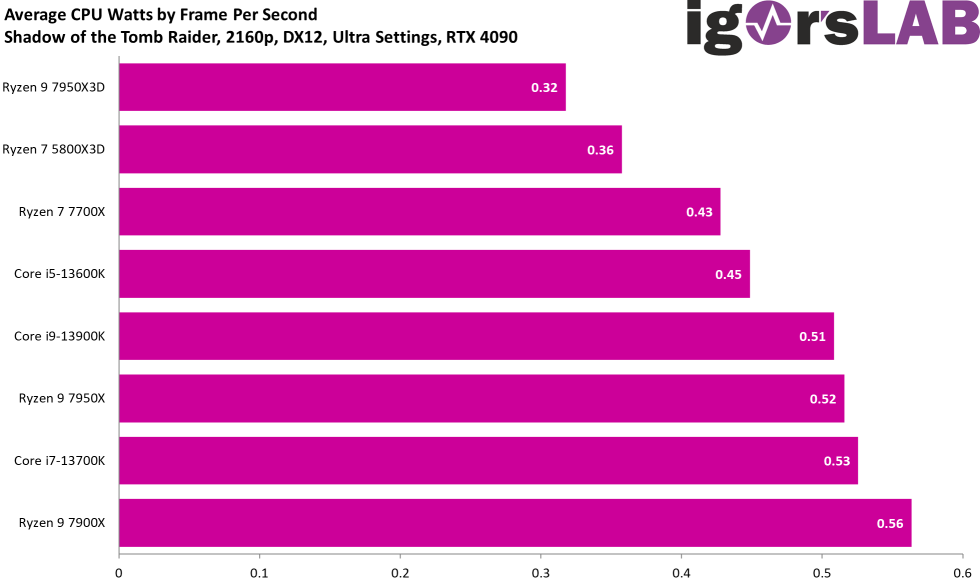
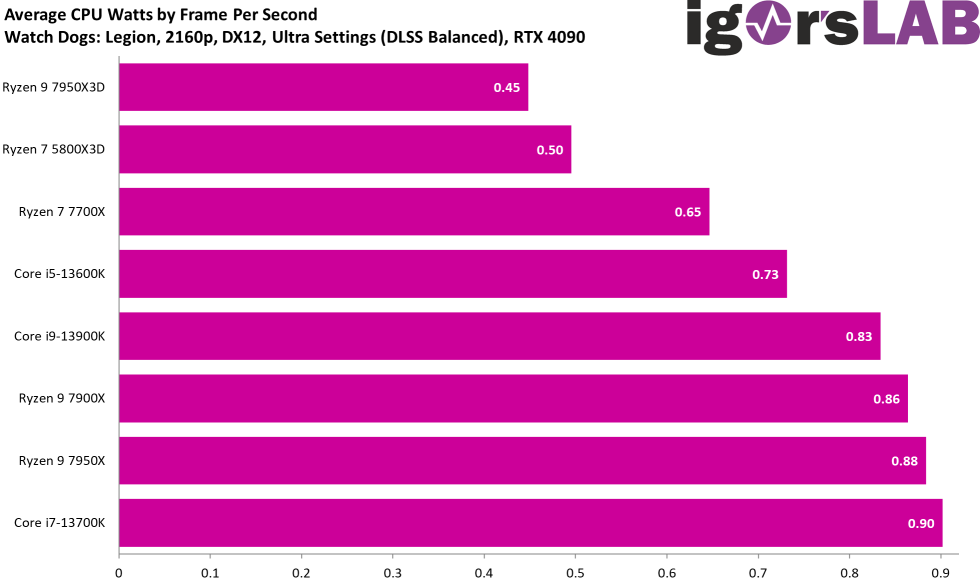
Power Draw and Single Efficiency


- 1 - Introduction, installation and technical data
- 2 - Chipset, motherboard and test bench
- 3 - Gaming Performance HD Ready (1280 x 720 Pixels)
- 4 - Gaming Performance Full HD (1920 x 1080 Pixels)
- 5 - Gaming Performance WQHD (2560 x 1440 Pixels)
- 6 - Gaming Performance Ultra-HD (3840 x 2160 Pixels)
- 7 - Autodesk AutoCAD 2021
- 8 - Autodesk Inventor 2021 Pro
- 9 - Rendering, Simulation, Financial, Programming
- 10 - Scientific and math workloads
- 11 - Power consumption and efficiency
- 12 - Summary and conclusion


229 Antworten
Kommentar
Lade neue Kommentare
Mitglied
1
Urgestein
1
Urgestein
Mitglied
Urgestein
Mitglied
Neuling
Urgestein
Urgestein
Veteran
Neuling
Urgestein
Urgestein
1
Mitglied
Urgestein
Alle Kommentare lesen unter igor´sLAB Community →