


Gaming performance in FPS and percentiles
Now we come to the separately tested use of different super-sampling methods. Today I run the NVIDIA cards with DLSS 2.3 and the AMD cards with FSR or XeSS, depending on the game and the possibility. A detailed comparison of DLSS 2.x with DLSS 3.0, FSR and XeSS on the GeForce RTX 4080 will be available the day after tomorrow, as Fritz Hunter has prepared quite a bit. I’ve also covered Cyberpunk 2077 and DLSS 3.0 separately in this article and moved them to the next page, because it’s worth taking a closer look.
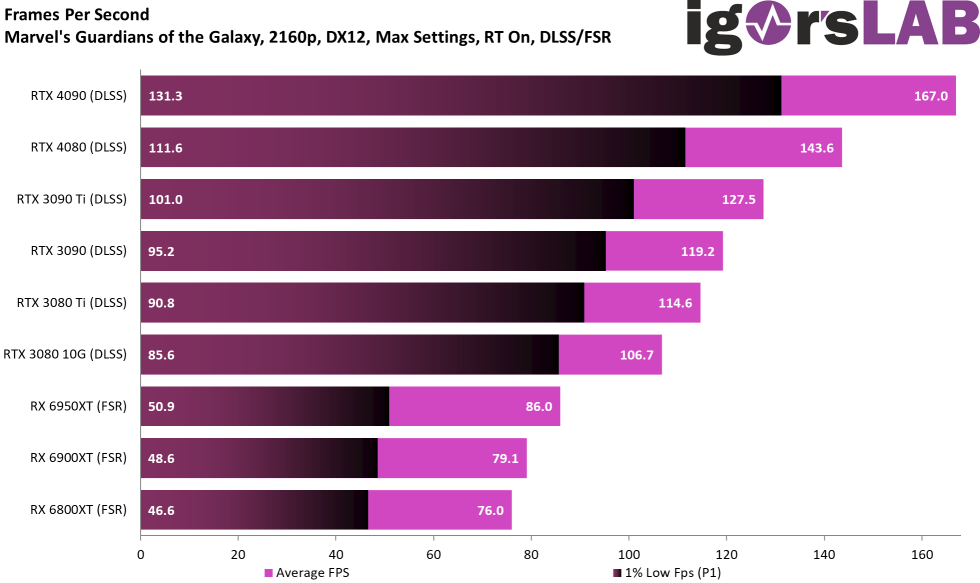
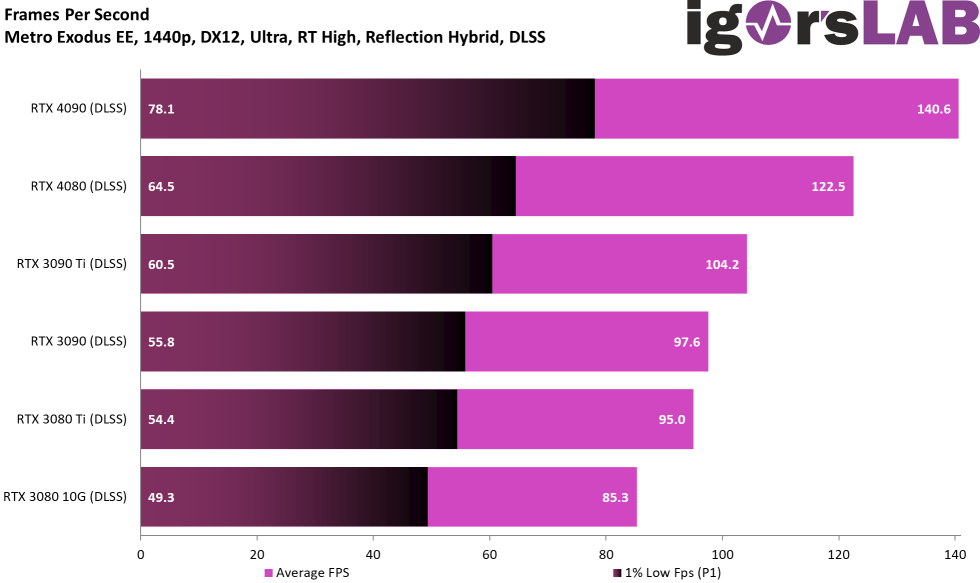
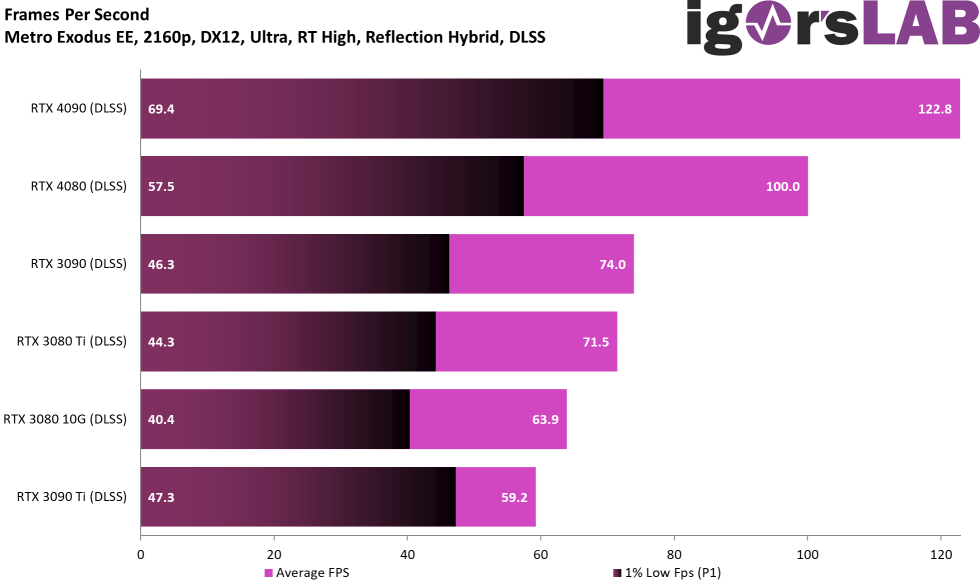
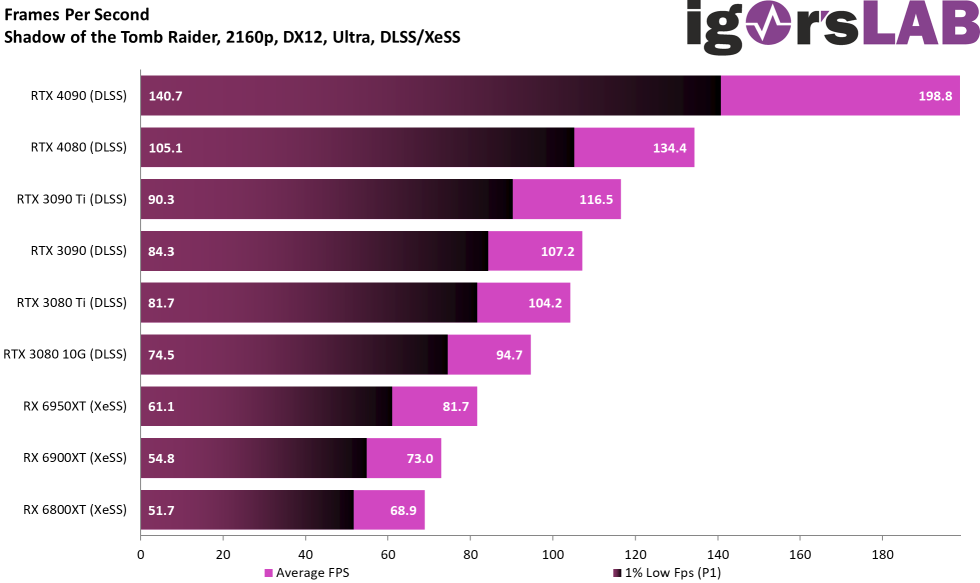
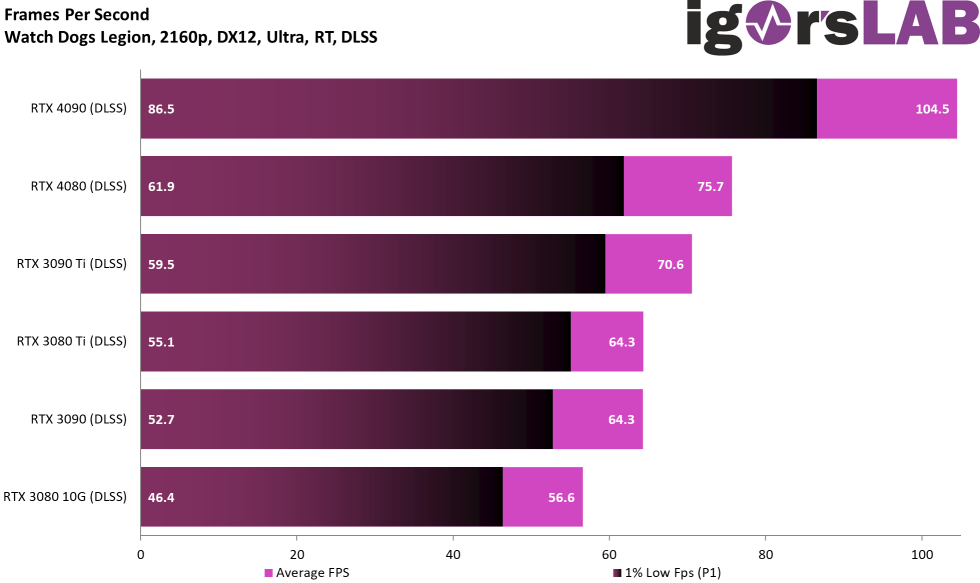
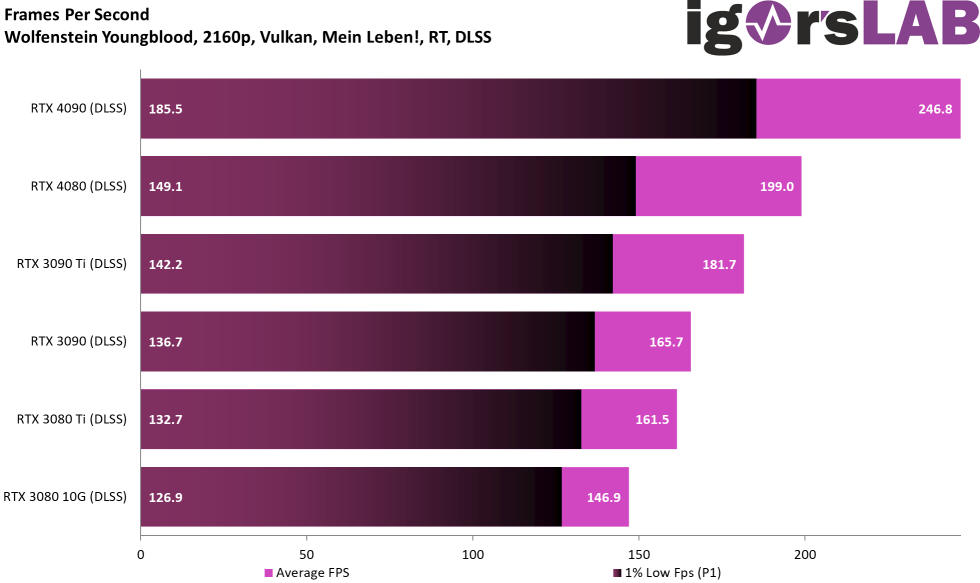
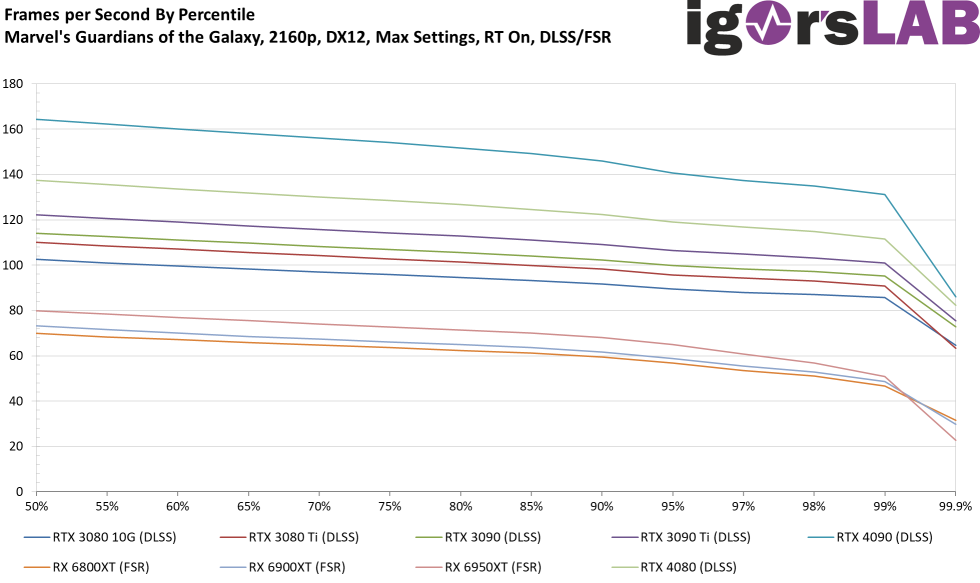
For now, here are the other games along with the different procedures. The percentage evaluation of the cards among each other can be found at the end of the article in the summary. However, we also see that the lead of the GeForce Radeon RTX 4090 and even the RTX 4080 with DLSS continues to increase, it doesn’t even need DLSS 3.0. The P1 Low, i.e. the min FPS, also shows that the RTX 4090 is likely to be partially slowed down by the CPU again (like in QHD), but the RTX 4080 is no longer.
For the games I use the “Quality” preset, although it has to be said honestly that FSR doesn’t look as good as DLSS or XeSS at this level. The latter delivers surprisingly good images, but is not as good as DLSS in terms of performance. However, it is good that XeSS also works vendor-independently, which helps AMD a bit further if a game does not yet support FSR 1 or 2.
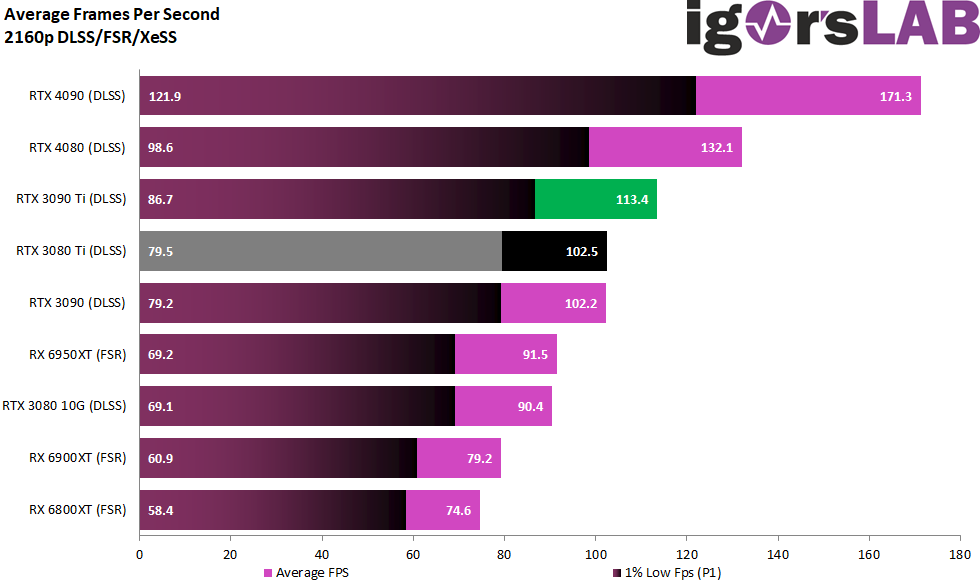
You can see the whole games first with the FPS and P1 bars in the individual overview. Instead of the classic Min-FPS, the average value of the one percent of the slowest rendered frames is shown here.

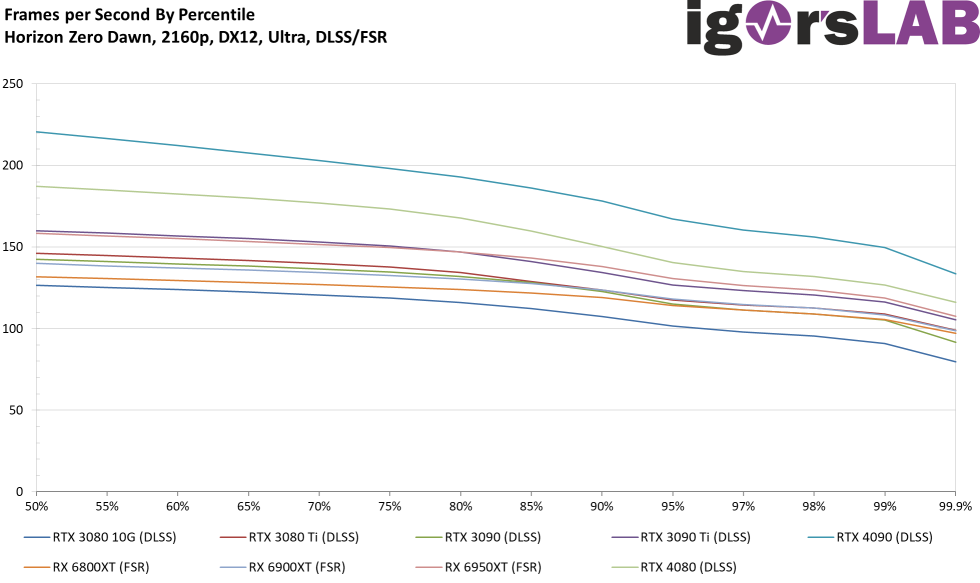
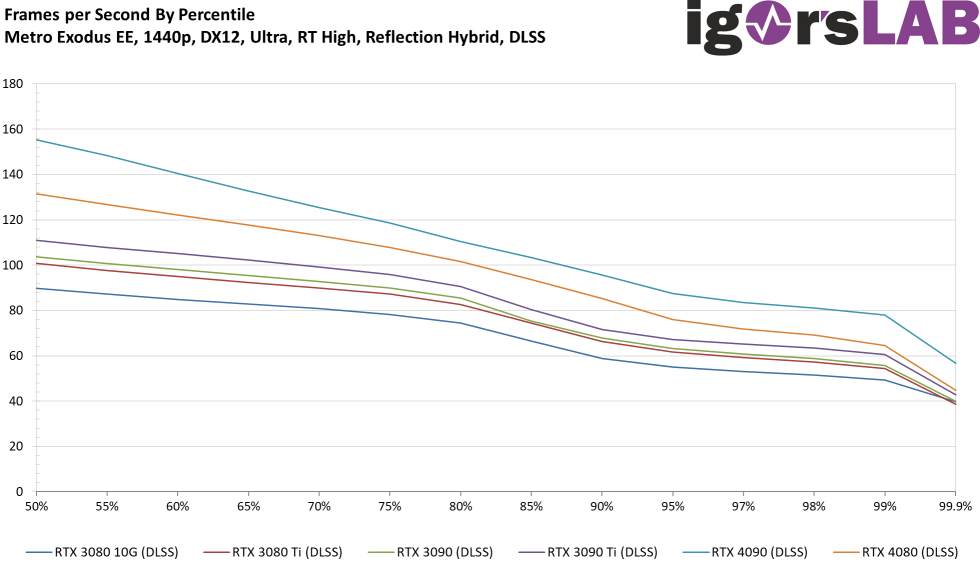
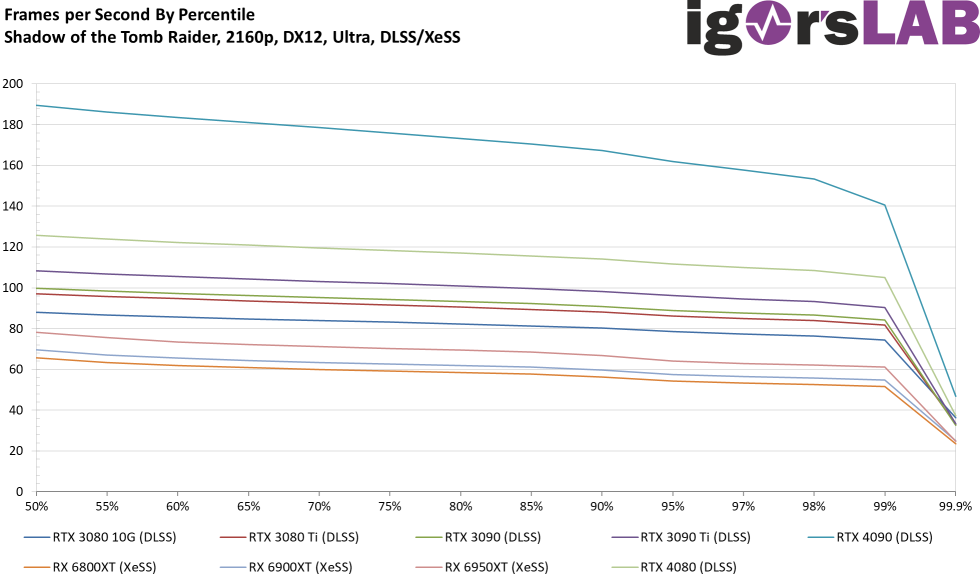
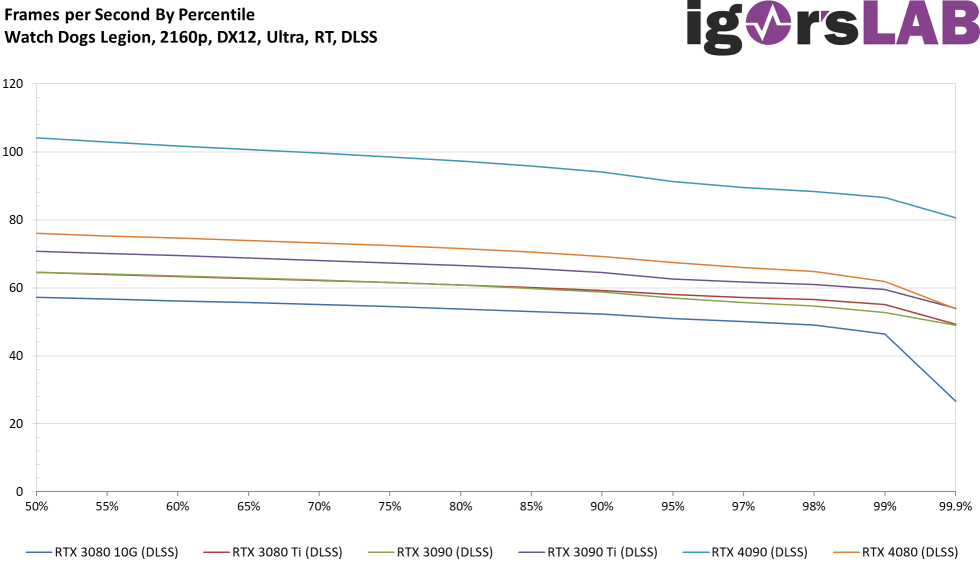
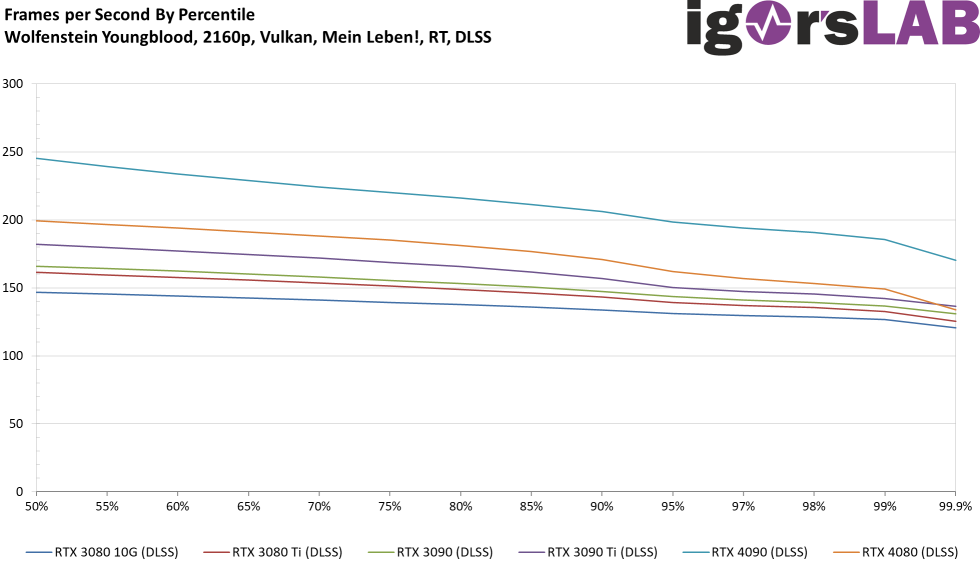
But how do all percentiles shape up as a curve, because there is not just the one percent? For this, too, there are the curves game by game:

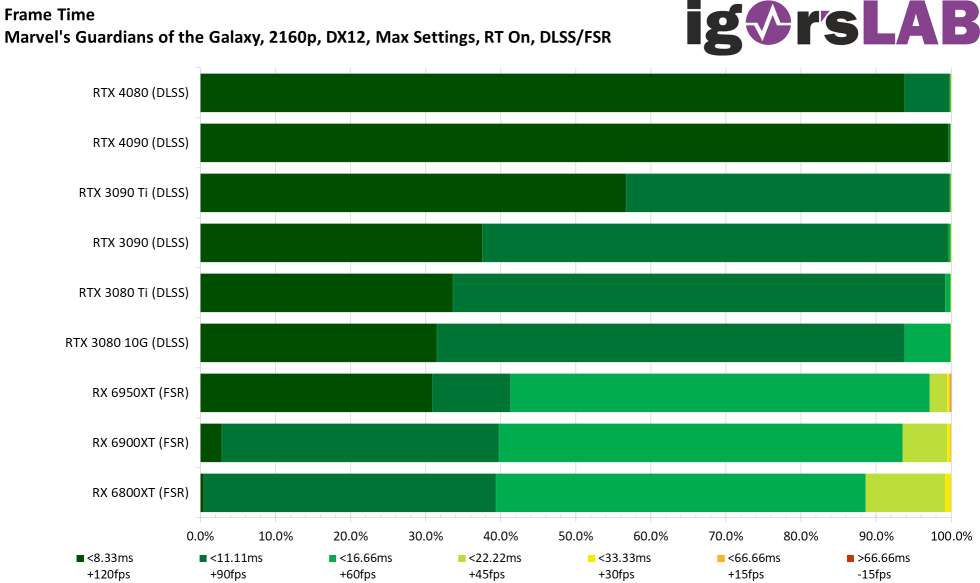
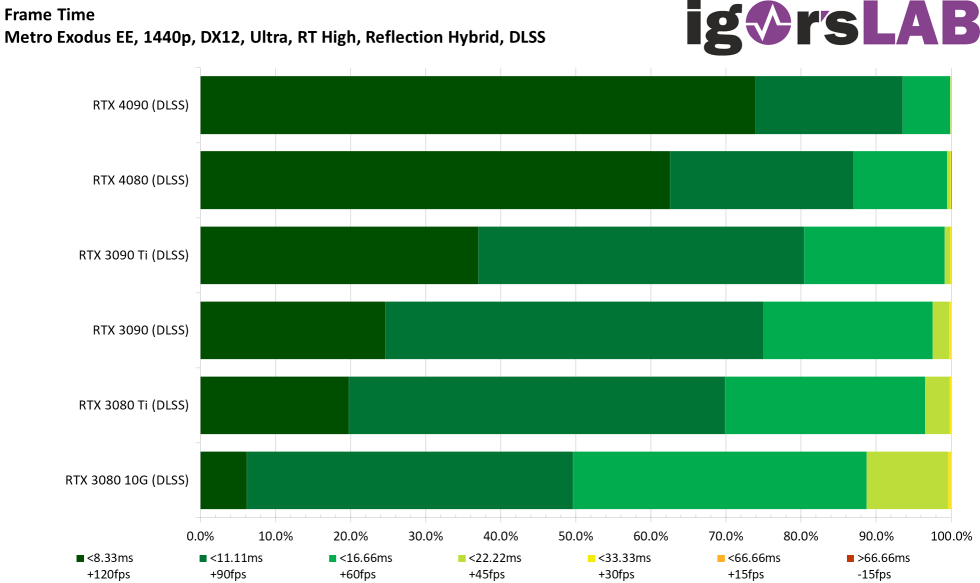
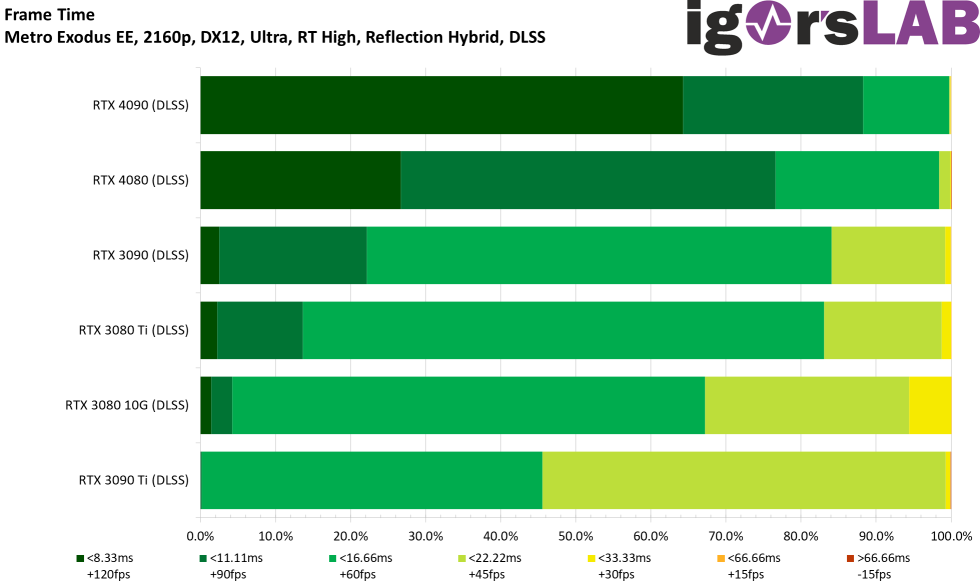
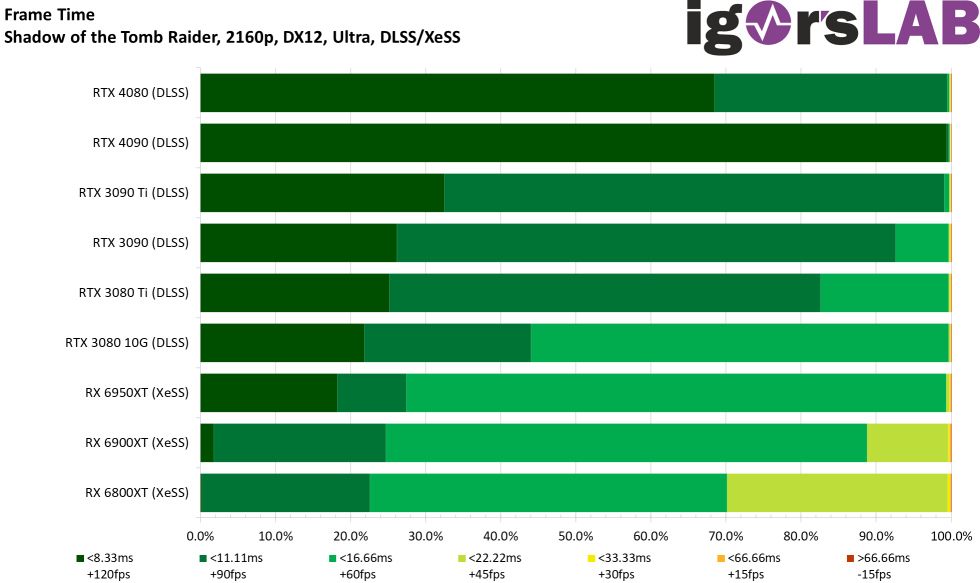
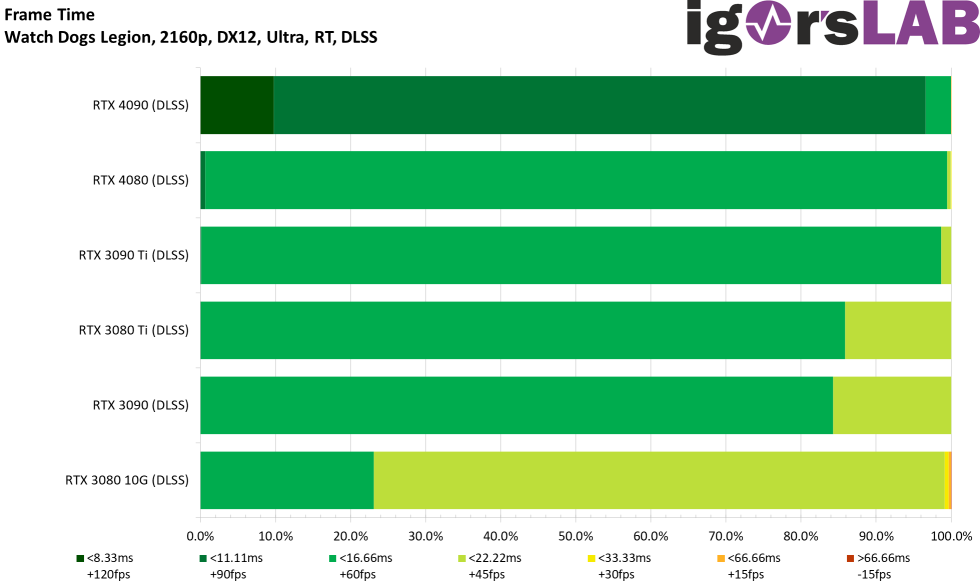
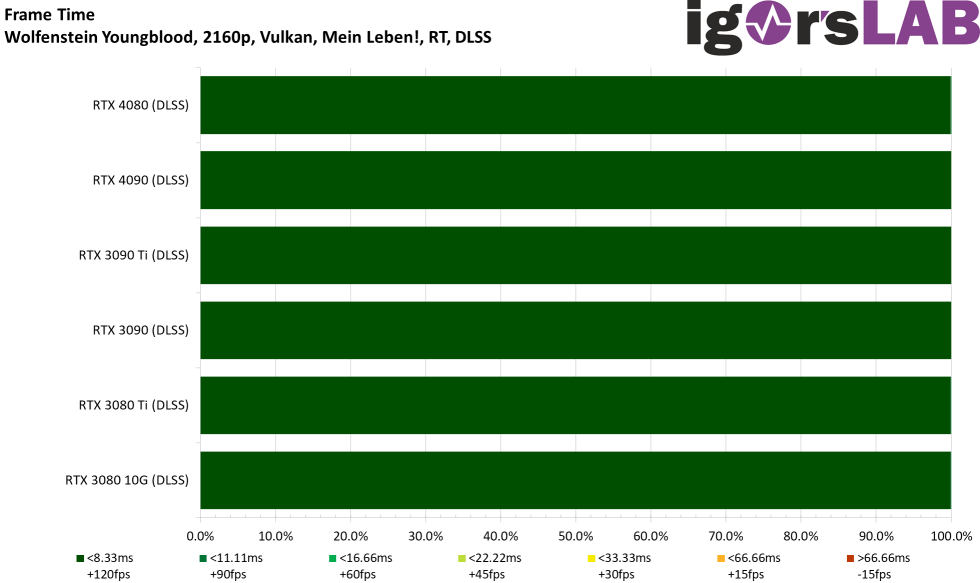
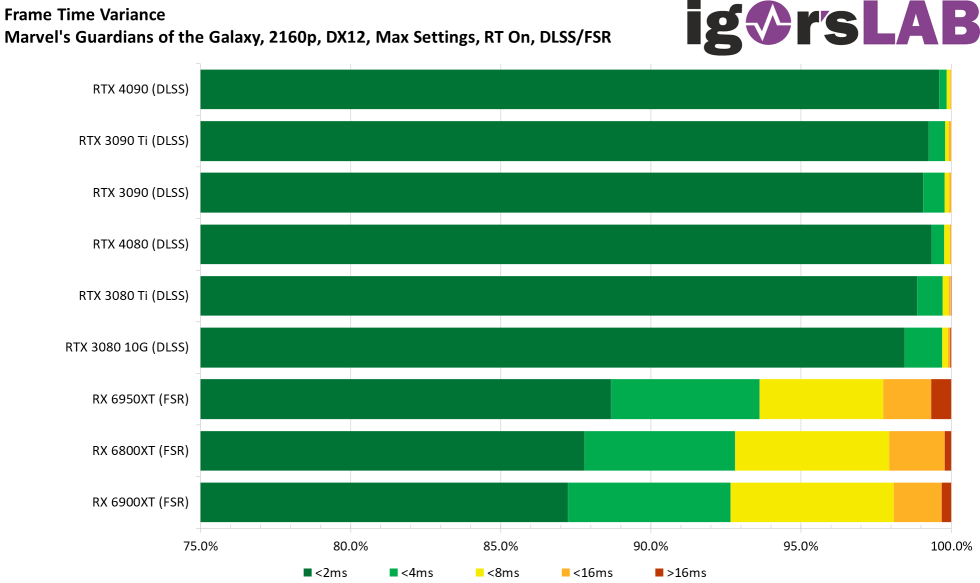
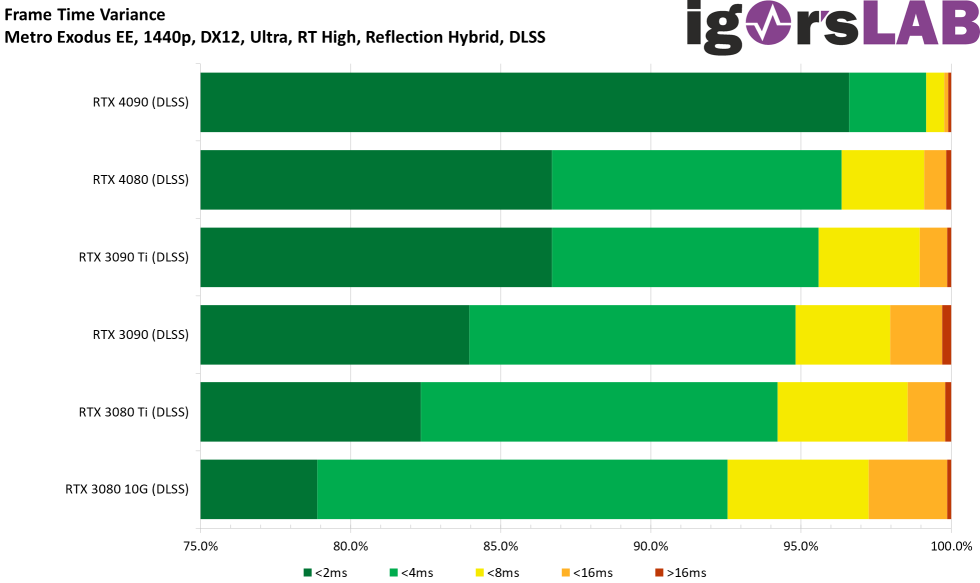
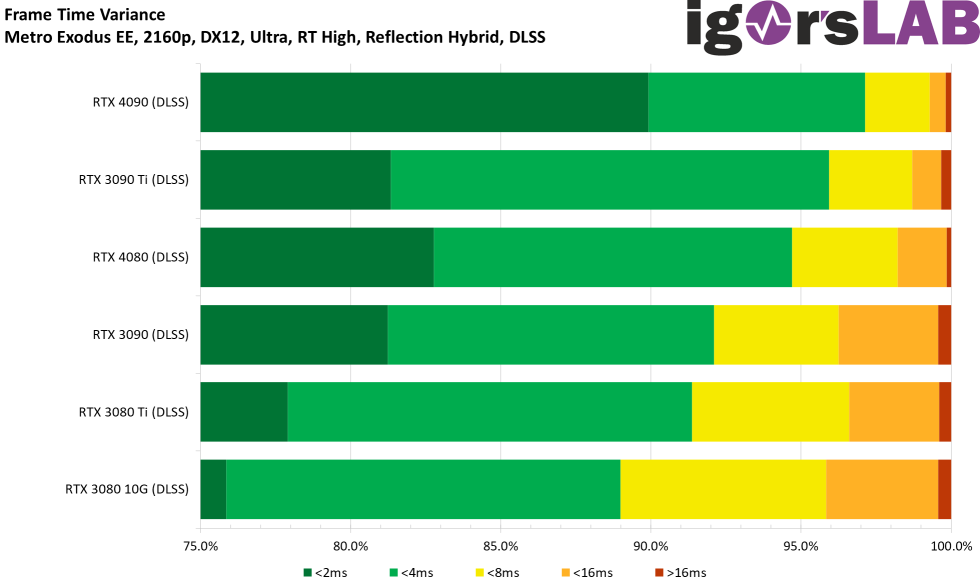
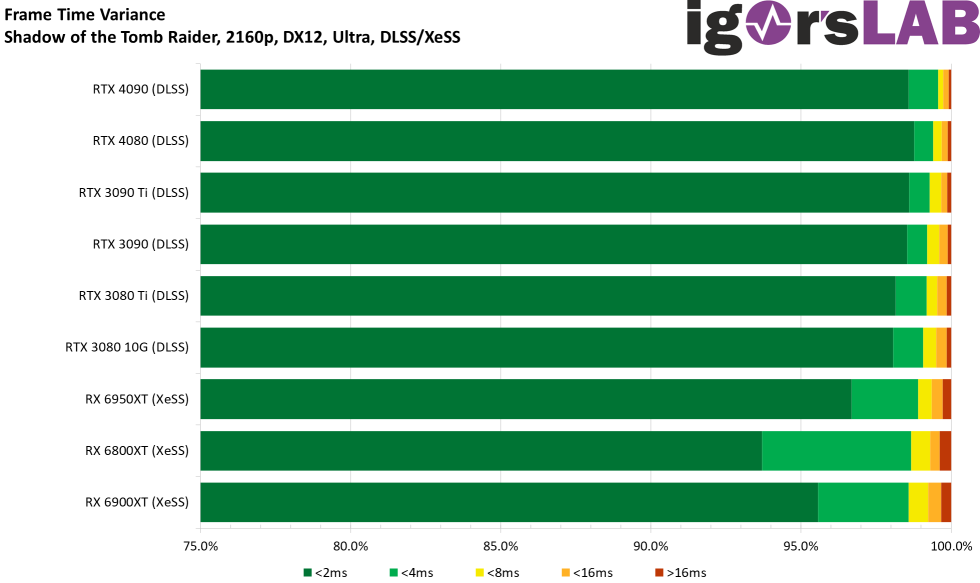
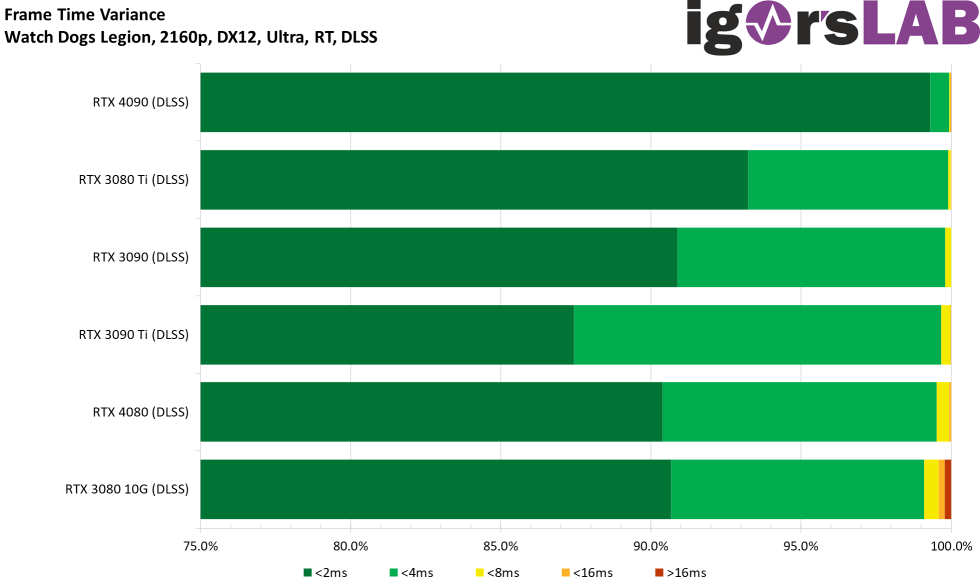
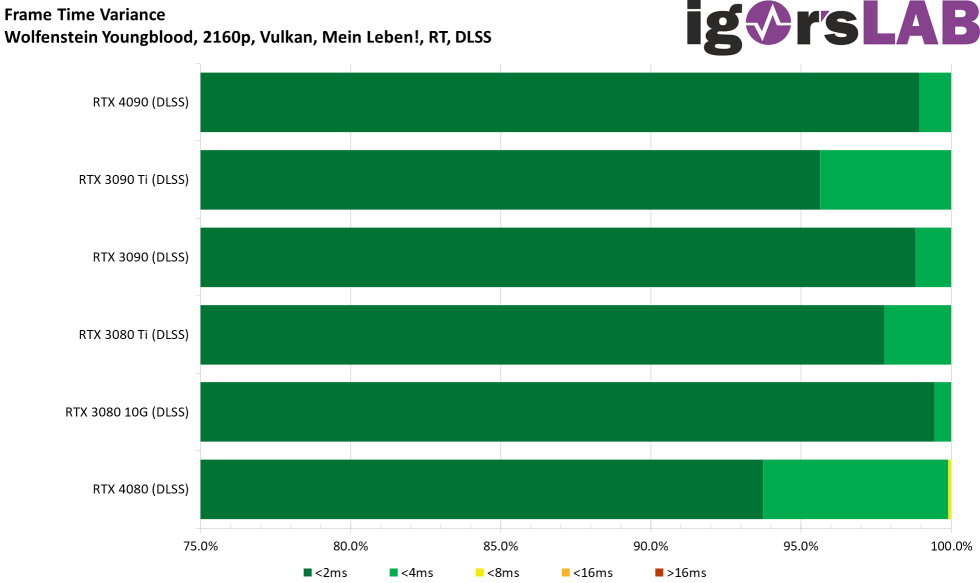
Frame Time and Variances
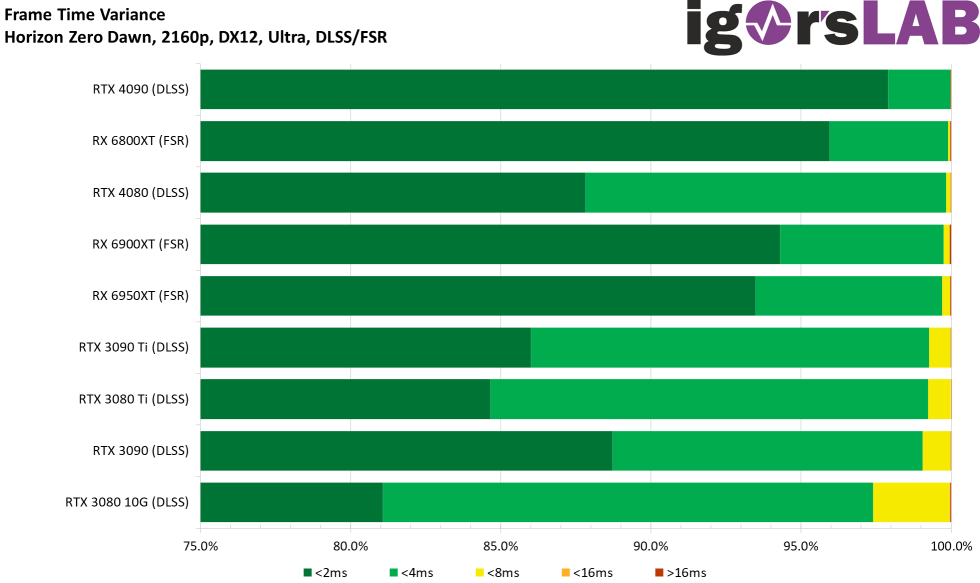
For frame times in percentage progression, DLSS is now king, although there is a very clear exception in Horizon Zero Dawn. However, FSR offers the significantly worse graphics experience here.

The variances also speak for themselves, where AMD or NVIDIA leads depending on the game:
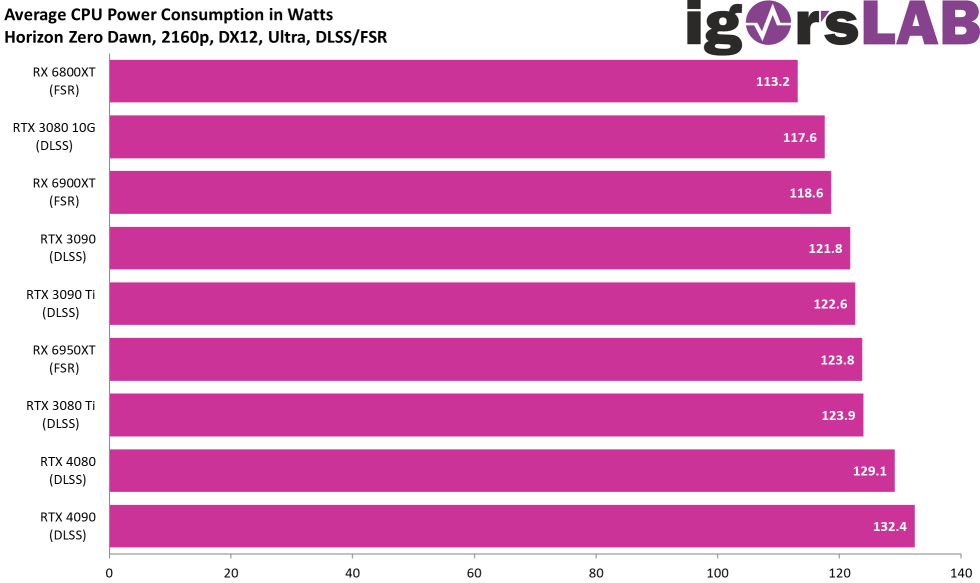
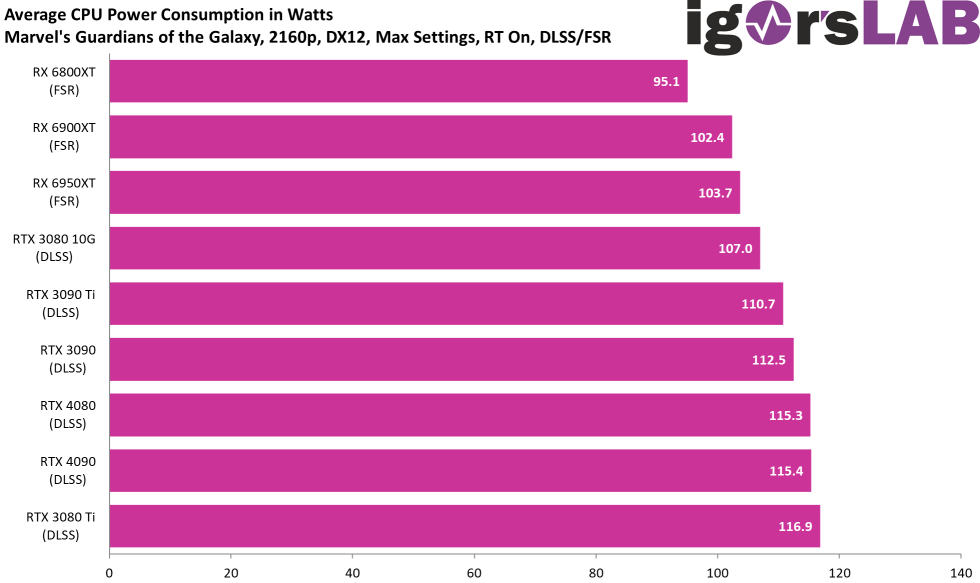
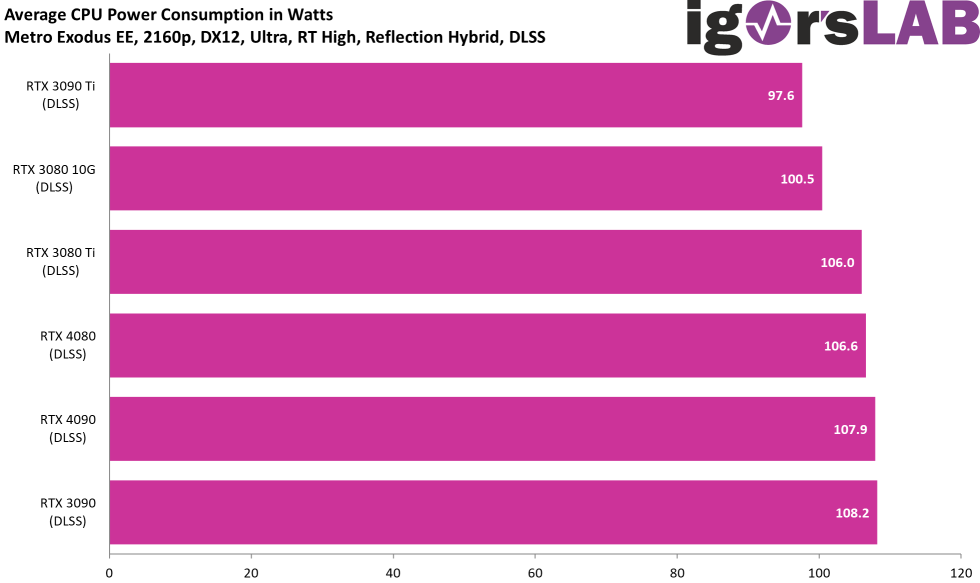
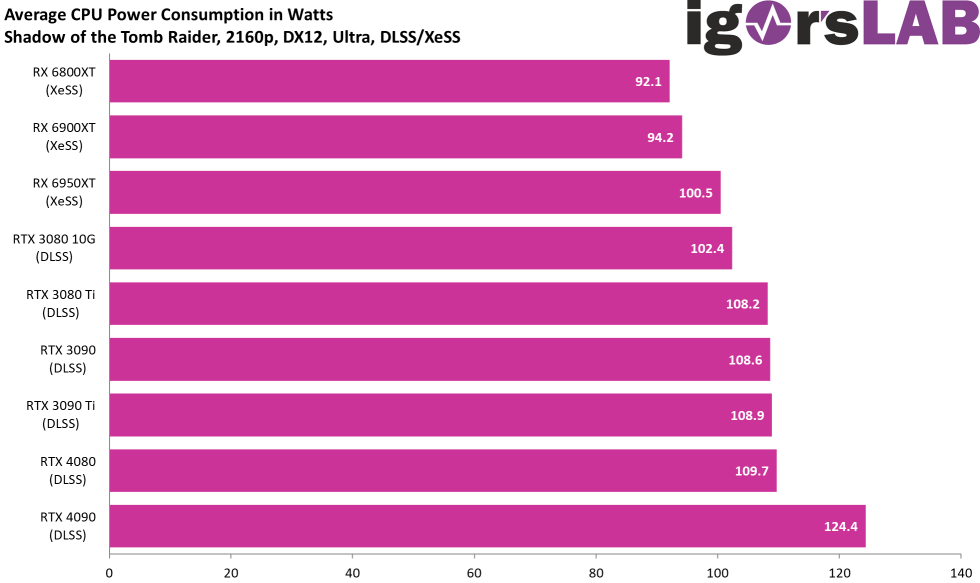
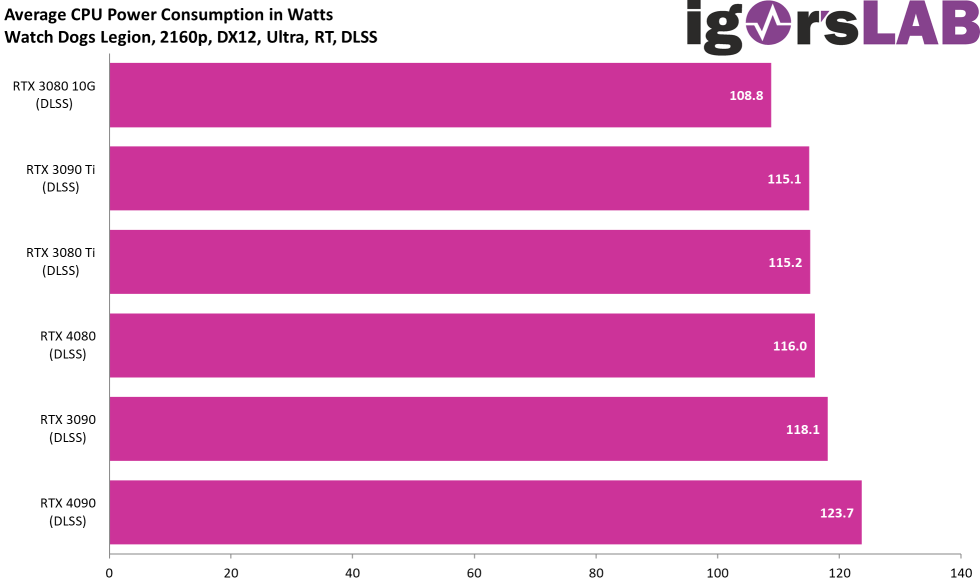
Power consumption and efficiency
I have linked the individual measurements here, also with the respective values of GPU or GPU and CPU together, as well as the load generated at the CPU. Of course, there will also be a cumulative evaluation later, but here it is first of all about completeness and transparency, because in the end you also want to know where my data comes from:
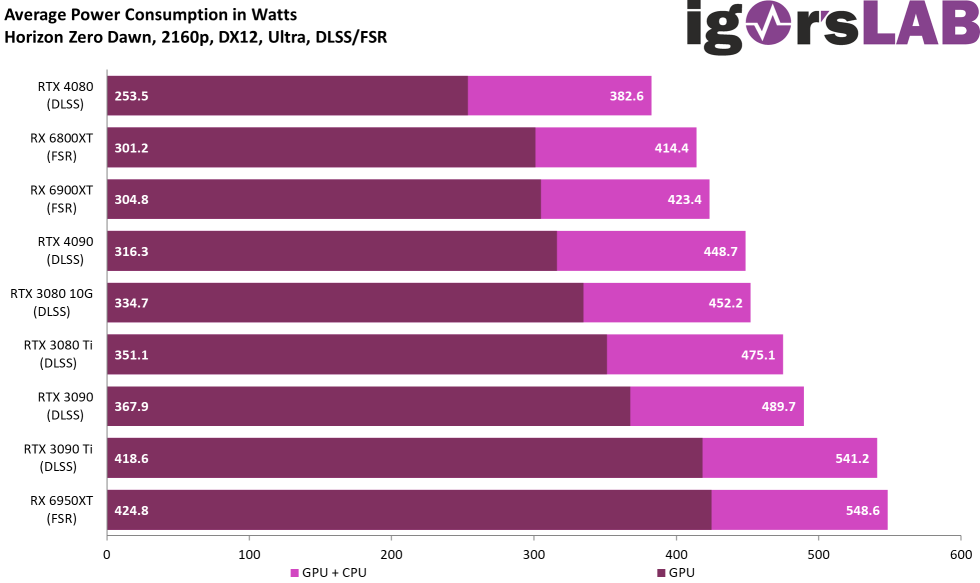
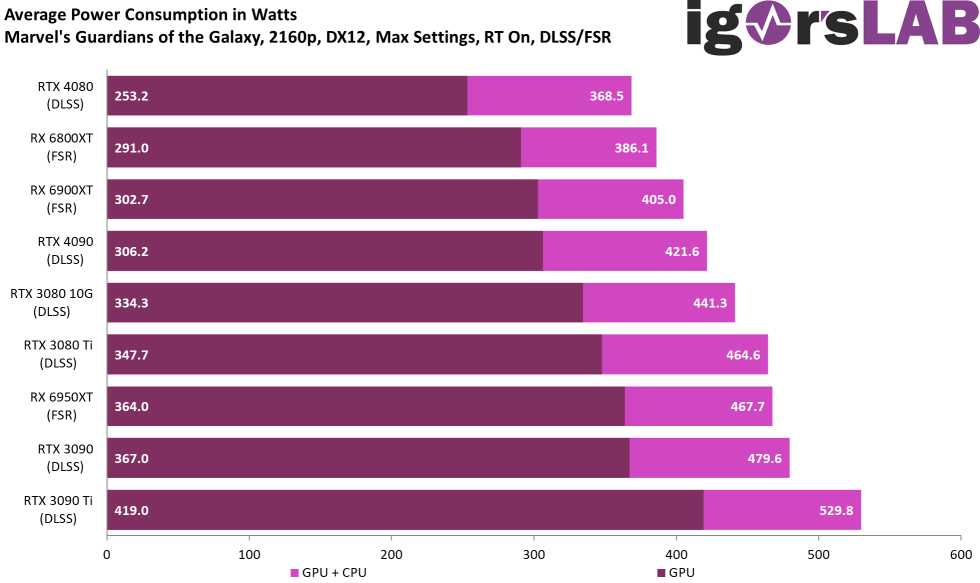

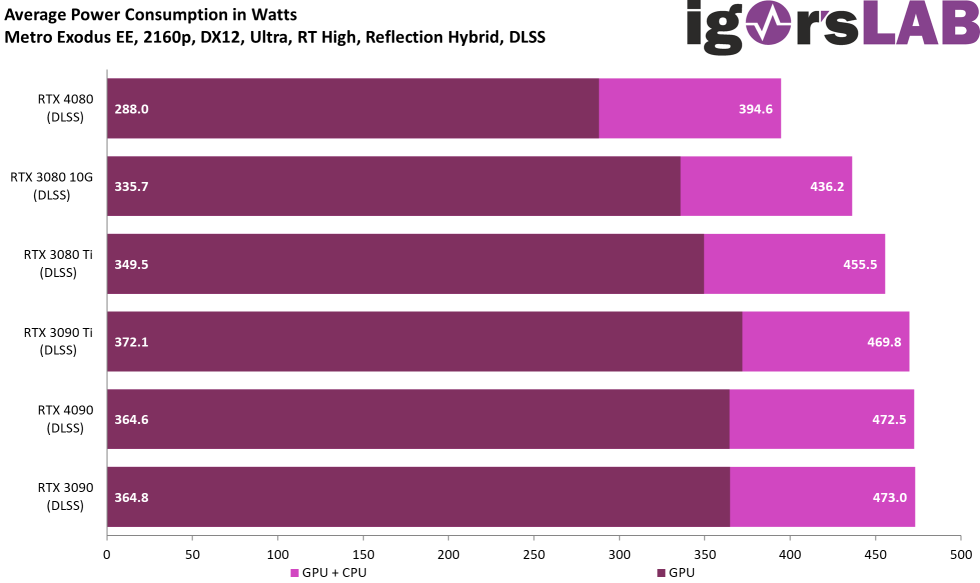
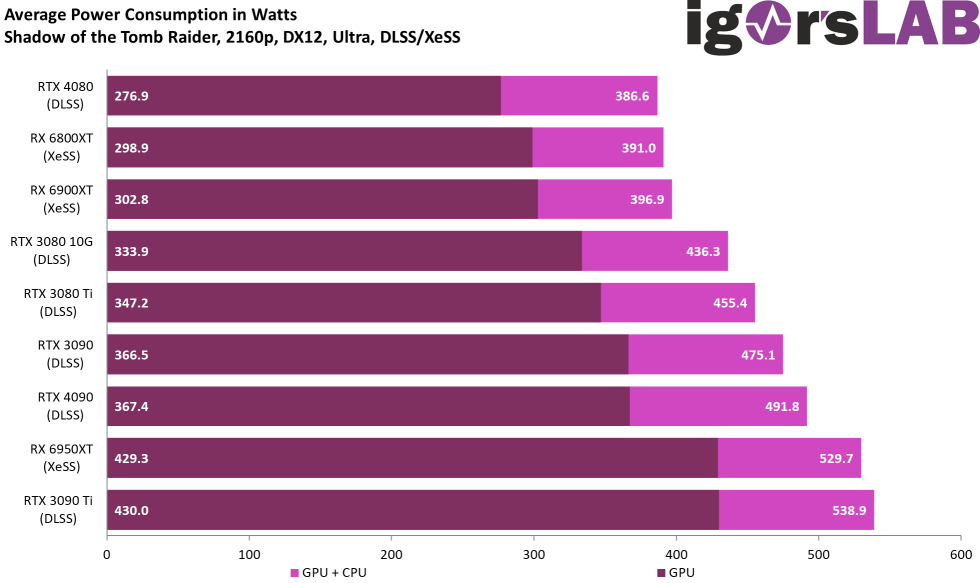

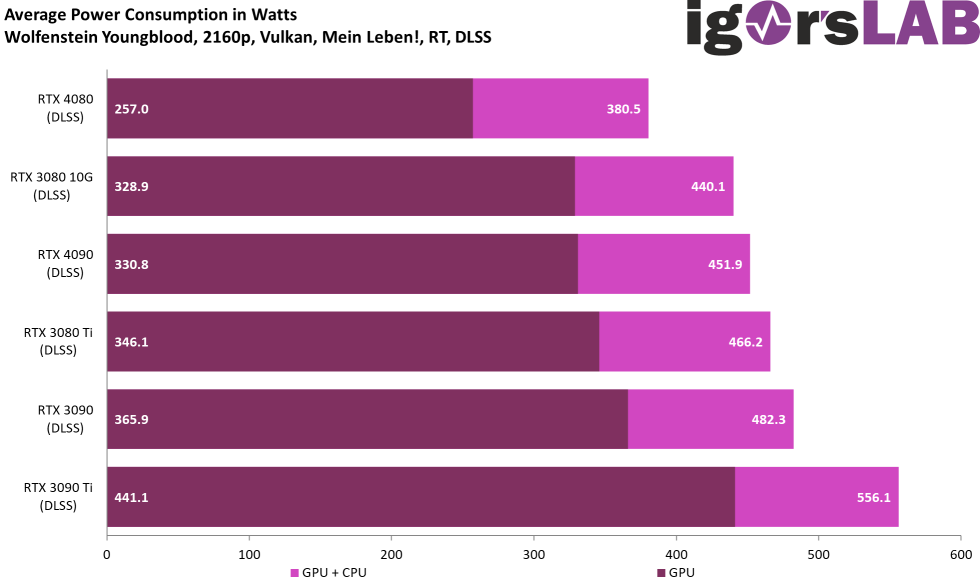
Of course, the fastest GPU also drives up the CPU’s power consumption, although less fodder is needed in super-sampling methods.


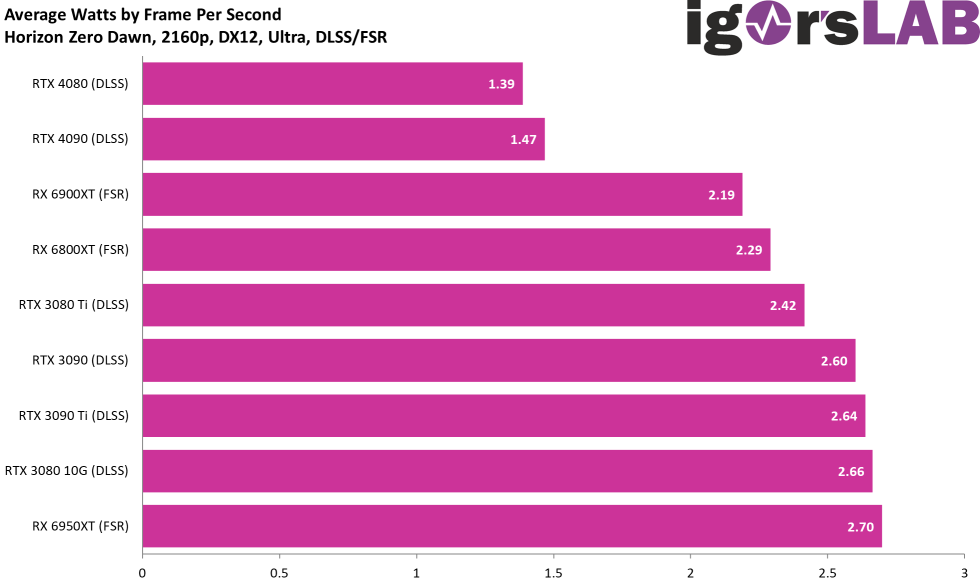
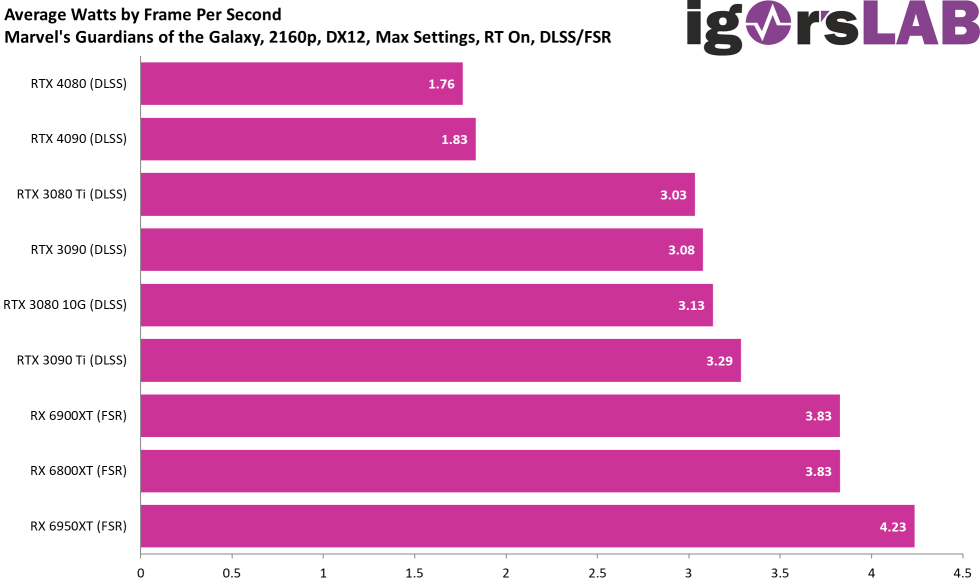
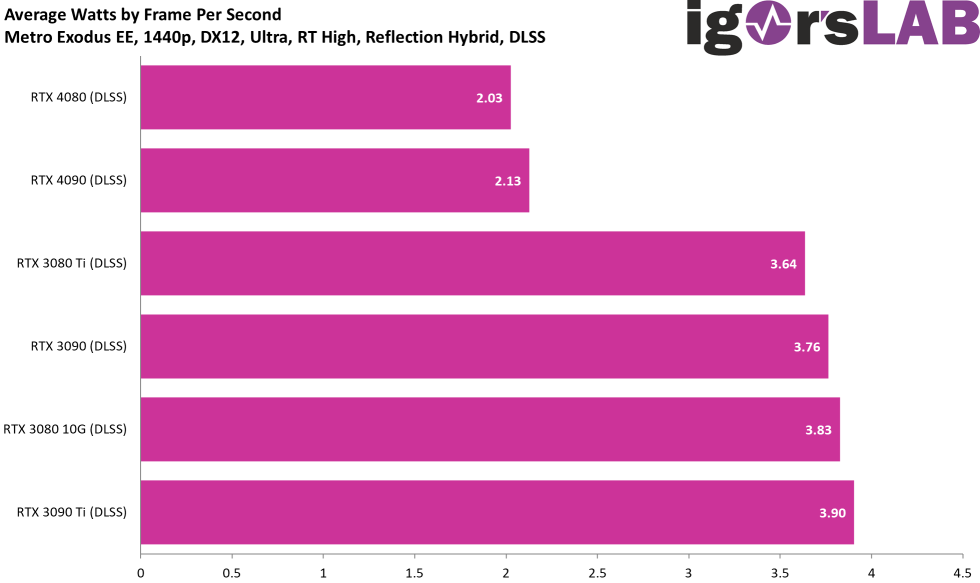
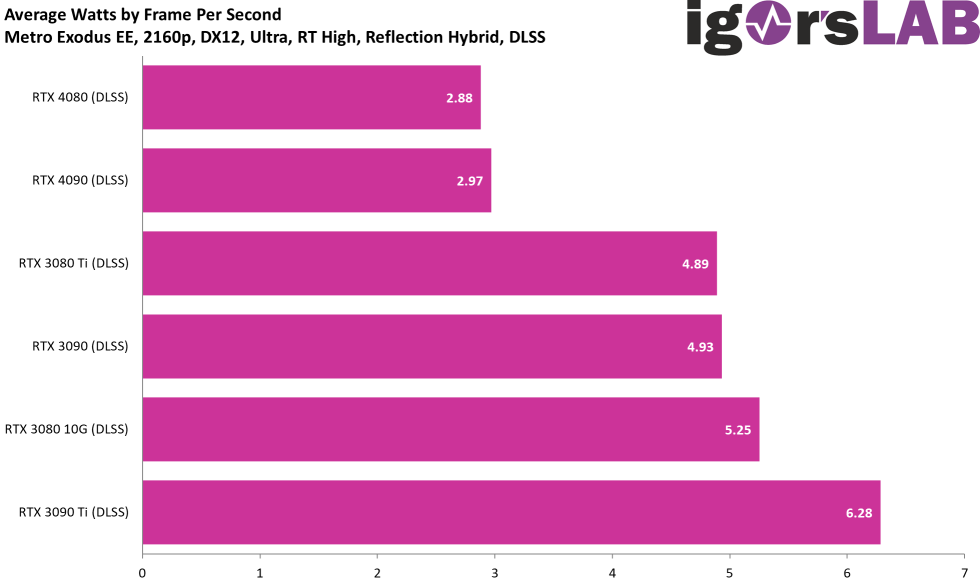
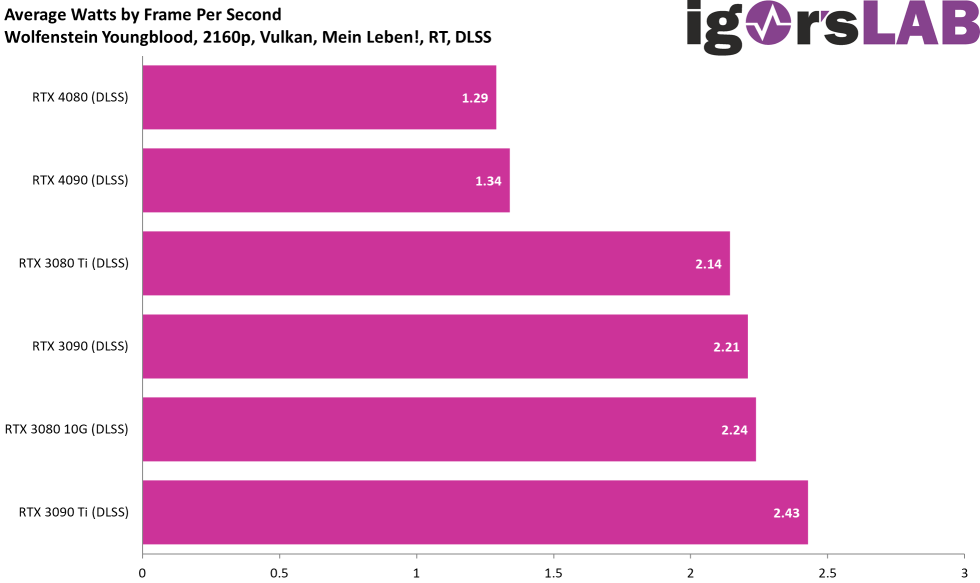
Finally, we’ll also take a look at which GPU delivers the most FPS per watt used in which game (efficiency)


- 1 - Introduction, technical data and technology
- 2 - Test system and the igor'sLAB MIFCOM-PC
- 3 - Teardown: PCB, components and cooler
- 4 - Gaming performance WQHD (2560 x 1440 Pixels)
- 5 - Gaming performance UHD (3840 x 2160 Pixels)
- 6 - Gaming performance UHD + DLSS/FSR/XeSS (3840 x 2160 Pixels)
- 7 - DLSS 3.0 and the longest benchmark bars
- 8 - NVIDIA Reflex and latencies
- 9 - Workstation performance
- 10 - Power consumption, load levels and standards
- 11 - Transients and PSU recommendation
- 12 - Temperatures, clock rates, OC, fans and noise
- 13 - Summary and conclusion


168 Antworten
Kommentar
Lade neue Kommentare
Urgestein
Veteran
1
Veteran
Mitglied
Urgestein
Veteran
Moderator
Veteran
Urgestein
Mitglied
Veteran
Urgestein
Veteran
Mitglied
Neuling
Urgestein
Urgestein
Alle Kommentare lesen unter igor´sLAB Community →