


Temperatures and boost clock
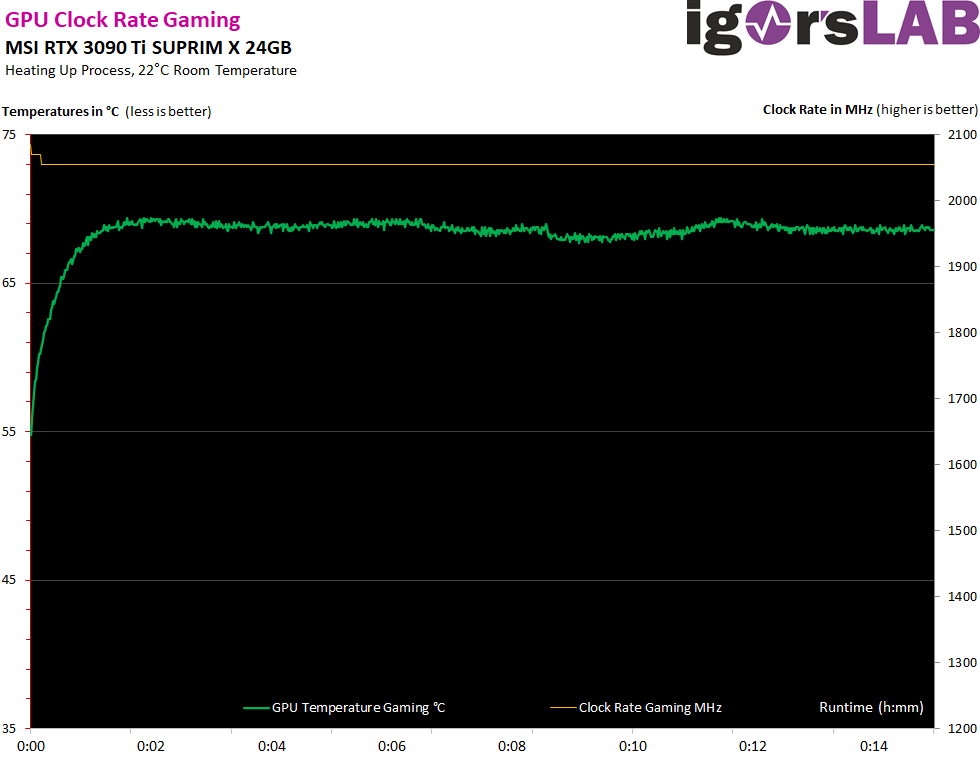
The card boosted almost constantly to 2050 MHz in gaming mode and while gaming, which is just over 2 GHz. Thus, it is significantly higher than what NVIDIA officially states for the boost. The memory, on the other hand, can hardly be overclocked. Like the GeForce RTX 3090, the GPU could not even be stably overclocked by more than 100 MHz, which then resulted in about 30 MHz more clock after warming up. Effort and benefit? The dog-tail principle, because more waste heat causes the boost clock to drop again.
Here you will have to hope for the GPU lottery and the best possible manual voltage adjustment in the Curve Editor. That again depends on the chip grade. But it remains to be seen whether it really does any good. By the way, the 2 GHz cannot be reached in silent mode. The card then gets too warm and loses important boost steps. However, the power consumption does not drop (leakage currents), so the volume advantage is expensive and only bought with heat. That’s exactly why I deliberately chose not to use this mode.
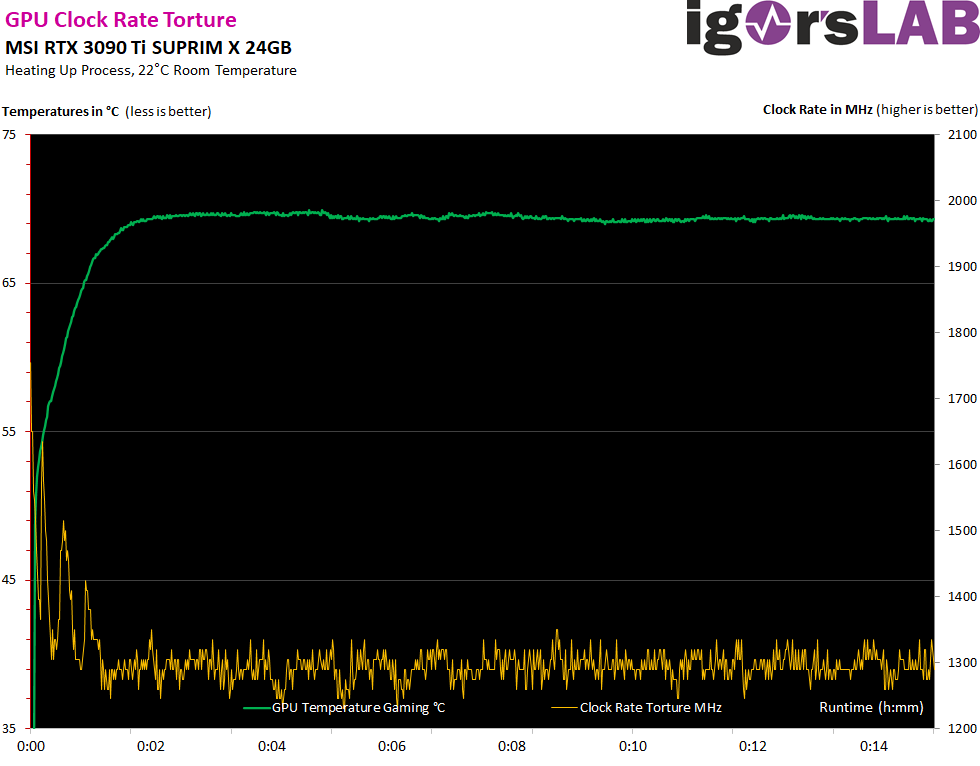
The clock then drops dramatically in the stress test and even only fluctuates around 1.3 GHz. Thus, the clock is even far below the specified base clock.
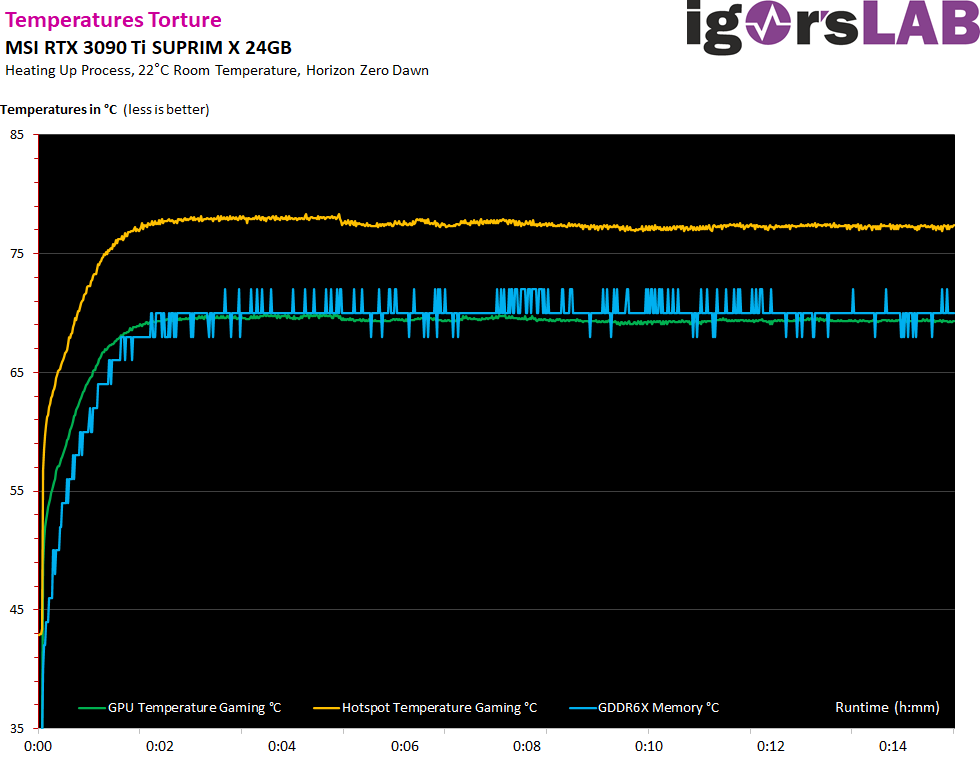
The board temperatures are really outstanding, including the newly added hotspot. Under 68 °C for the GPU (hotspot < 78 °C) is really an achievement for the up to 500 watts of waste heat and air cooling. Especially the RAM is really well cooled with up to 67 °C, despite the approx. 1.5 watt more power consumption for such a 2GB module with 21 Gbps.

The GPU temperature only increases marginally in the stress test, only the GDDR6X memory now gets up to 70 °C warm. This can also be considered sufficiently cooled, even if it already sounds more obvious on this card. But more on that in a moment.
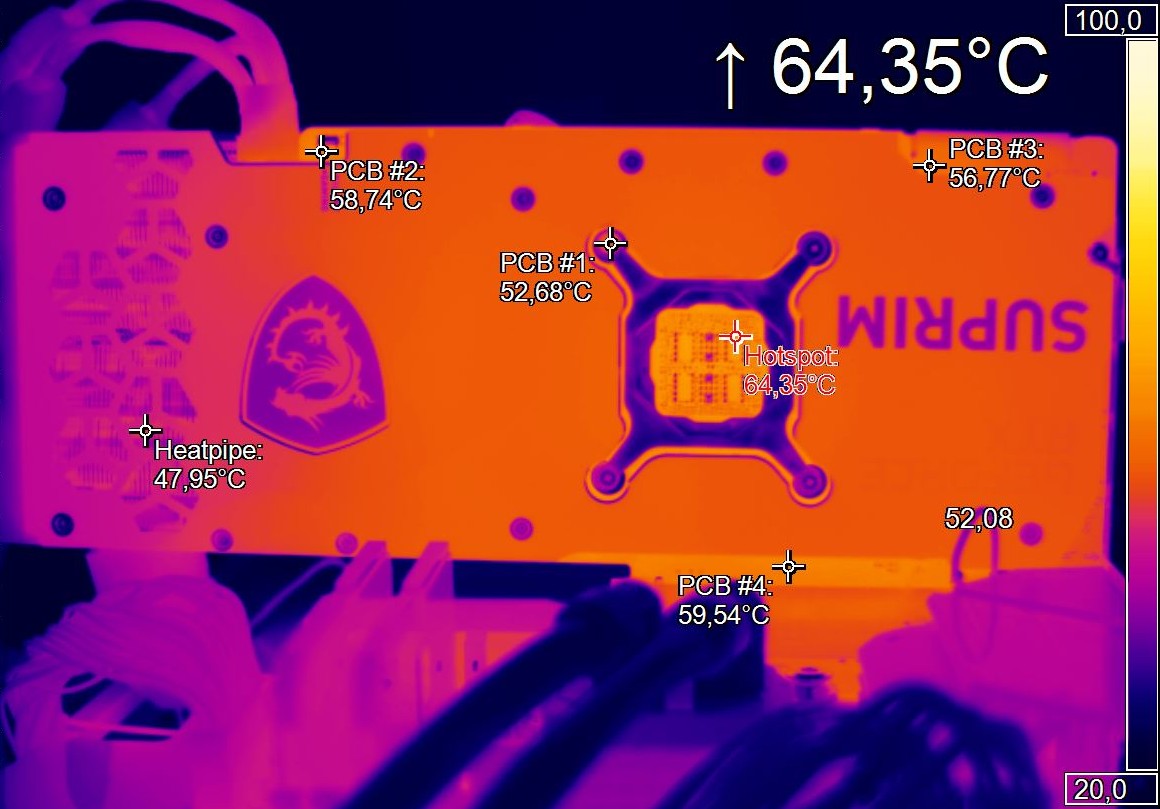
Now let’s move on to the recording with the high-resolution infrared camera. Optris’ PI640 features a true 640 x 480 pixel bolometer and records at up to 30 FPS. Here I use the normal lens and calibrated film with a known transmittance so that I can de facto see inside the closed housing. I deliberately do not remove the backplate because it is primarily involved in cooling. However, the temperatures of the exposed PCB areas are plausible and match the sensor readings.
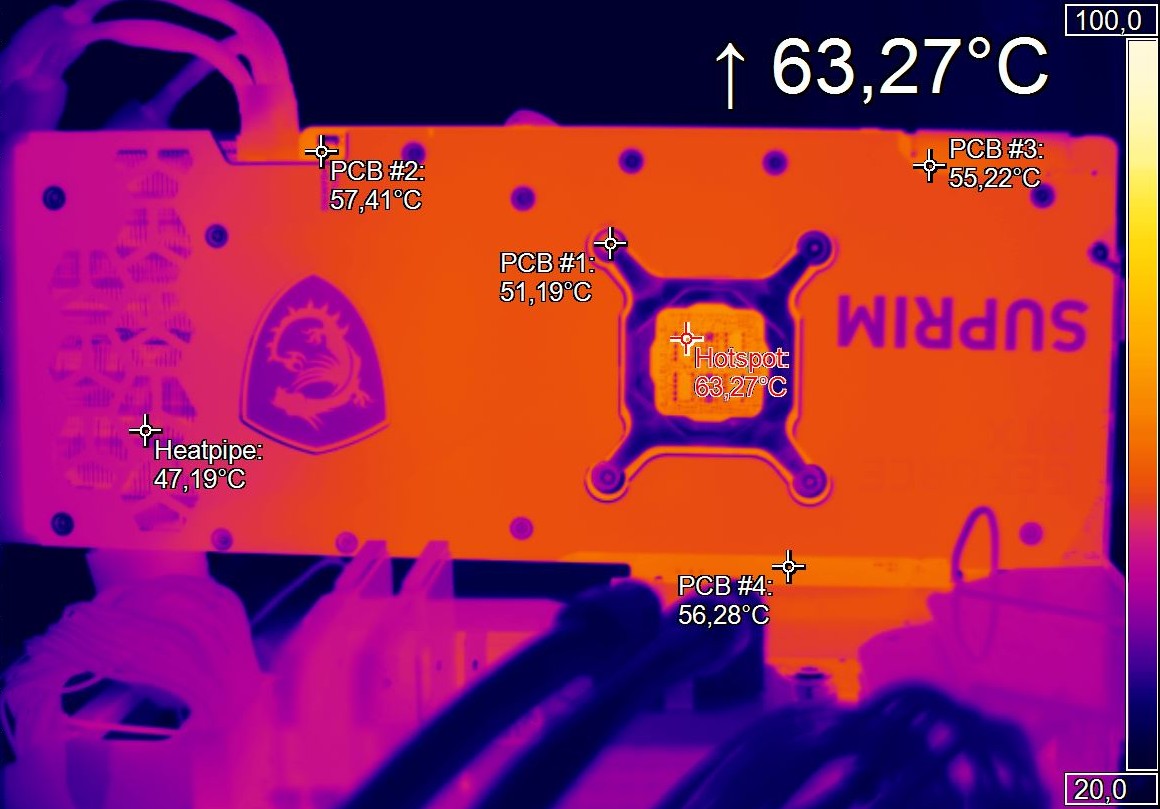
The picture hardly changes in the stress test; there is a maximum of 2 to 3 degrees more on the PCB.

- 1 - Introduction, Unboxing and Technical Data
- 2 - MSI's PSU, Test System and Test Methods
- 3 - Teardown, PCB Analysis, Components and Cooler
- 4 - Gaming Performance (Bars)
- 5 - Gaming Performance (Curves)
- 6 - Percentiles (Curves)
- 7 - Frame Times (Curves)
- 8 - Frame Times (Bars)
- 9 - Variances (Bars)
- 10 - Power Draw GPU in Detail (Each Game)
- 11 - Power Draw CPU in Detail (Each Game)
- 12 - Effiziency in Detail (Each Game)
- 13 - Power Consumption in Games and Applications (Average)
- 14 - Transients, PCIe Standard and PSU Recommendation
- 15 - Temperatures and Thermal Imager
- 16 - Fan Speed, Noise, Coil Whining
- 17 - Summary and Conclusion


52 Antworten
Kommentar
Lade neue Kommentare
Urgestein
Mitglied
1
Urgestein
Moderator
Veteran
Urgestein
Mitglied
Urgestein
Veteran
Urgestein
Urgestein
Veteran
Mitglied
Urgestein
Urgestein
Urgestein
Veteran
Mitglied
Alle Kommentare lesen unter igor´sLAB Community →