


What actually happens when you take away the e-cores? That’s right, Alder Lake suddenly becomes even more economical in gaming than already proven! However, this also elegantly counteracts the term efficiency core and once again shows that these cores are actually almost completely useless in many scenarios (but not all). Once again, they mutate into hungry blackheads that no one actually needs when gaming. Sounds drastic, but unfortunately it is the case. As always, the pure package power of the respective SKU was measured across all games and during each individual benchmark run. If the emulated CPU loses performance, it is almost exclusively due to the lower clock speed compared to the i5-12600K.
Power consumption compared to FPS
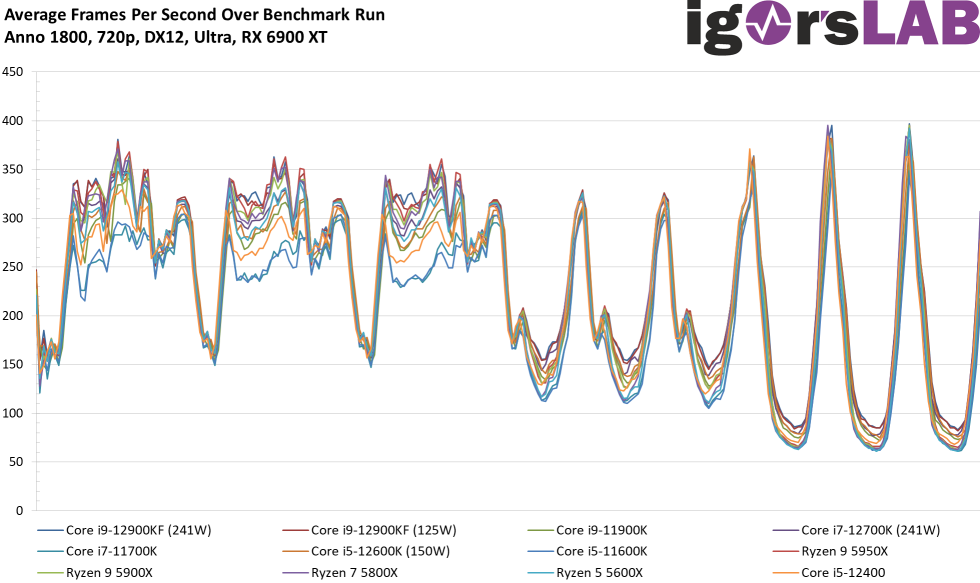
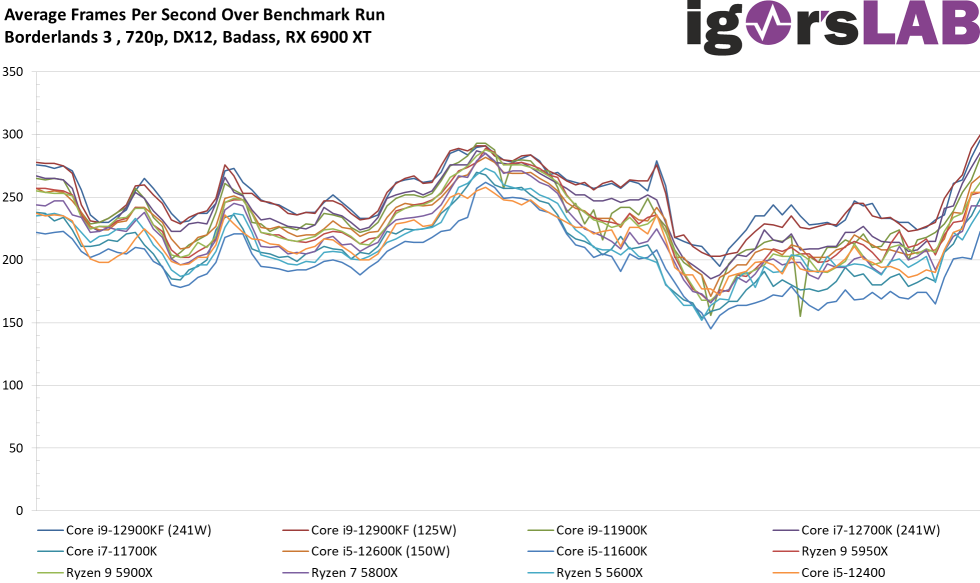
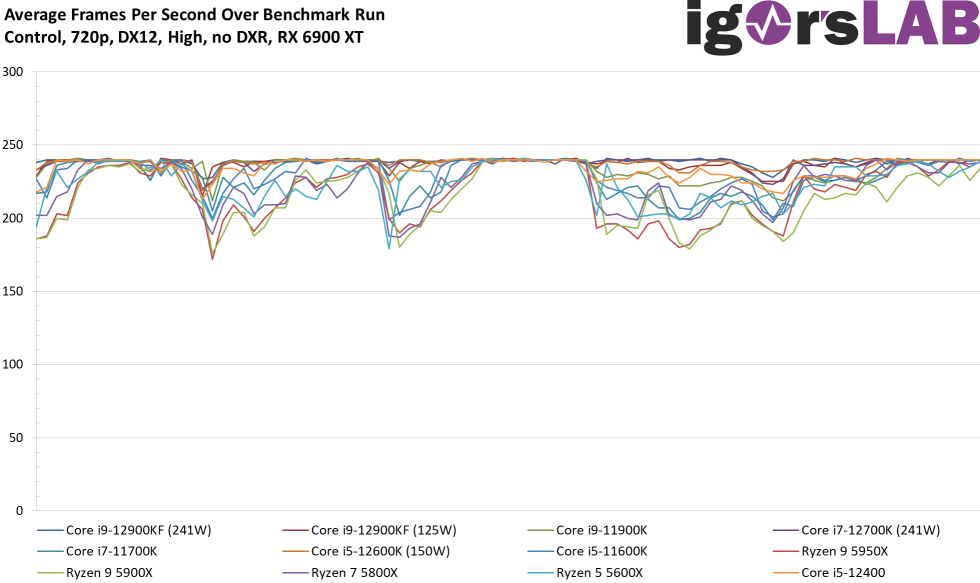
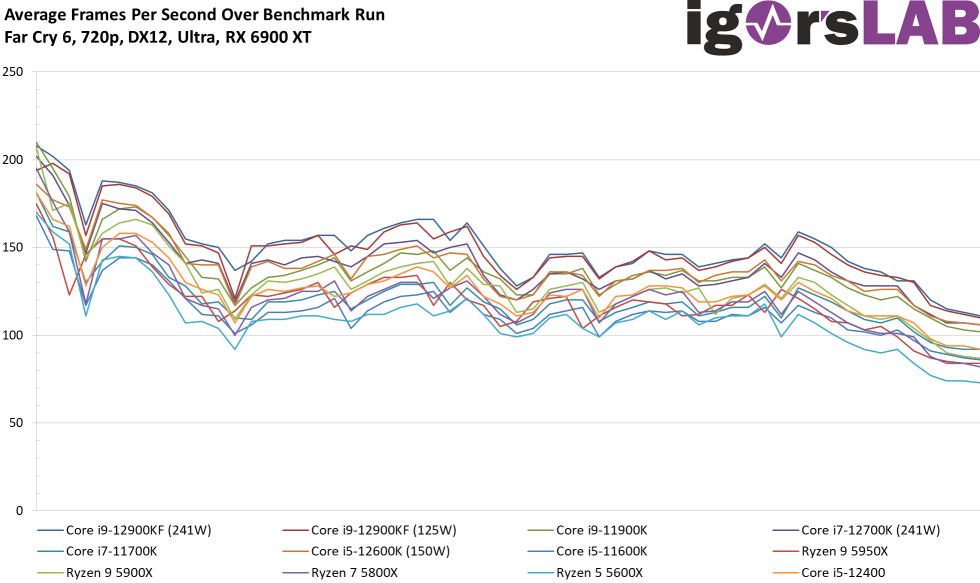
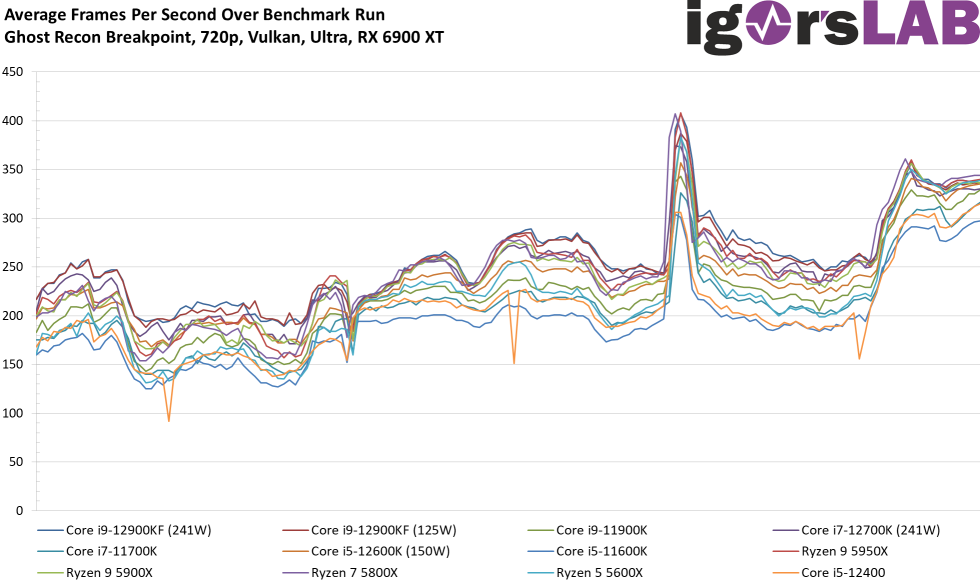
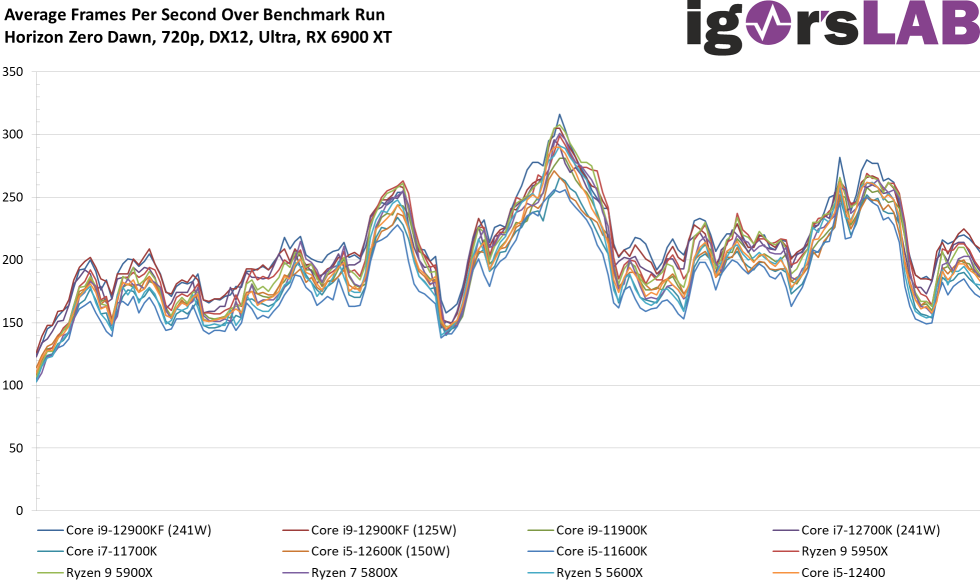
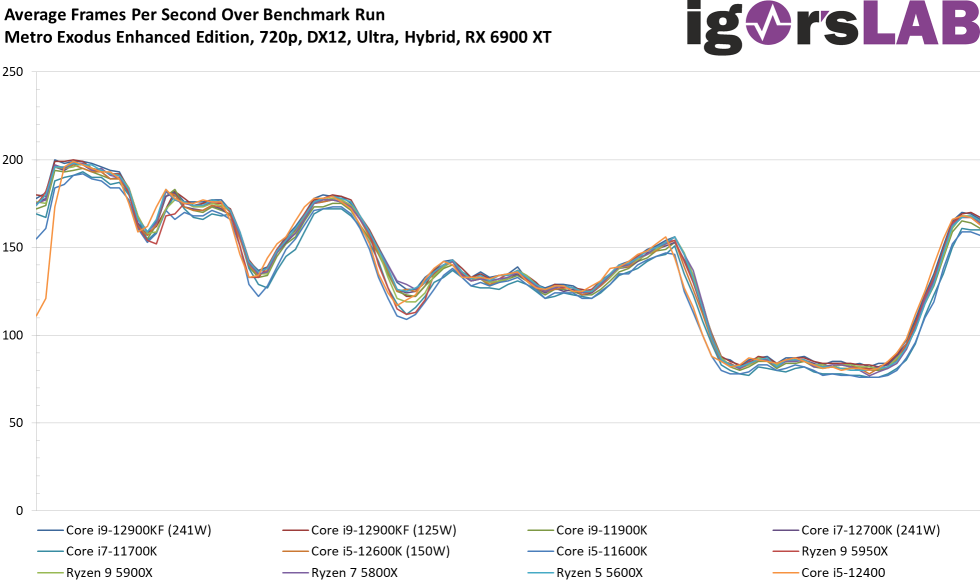
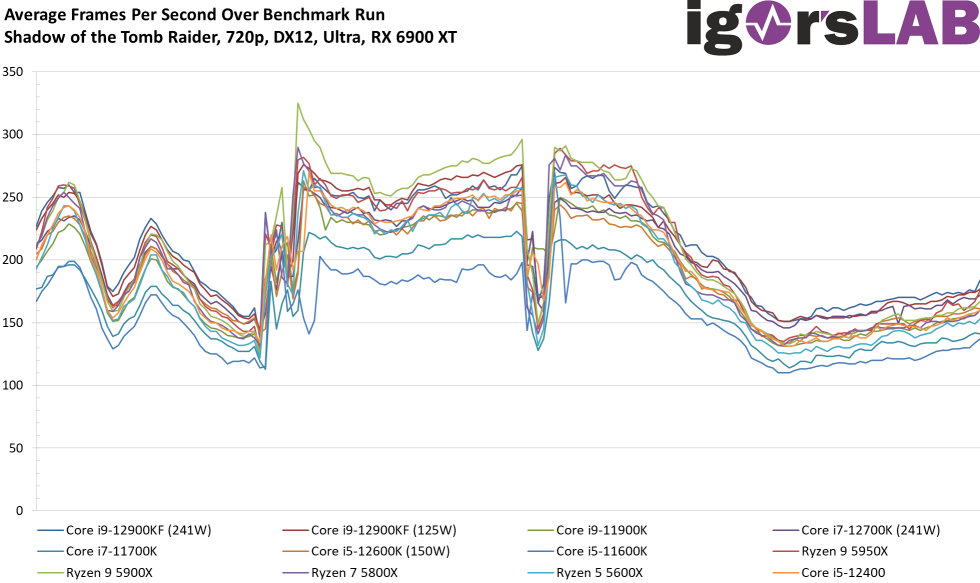
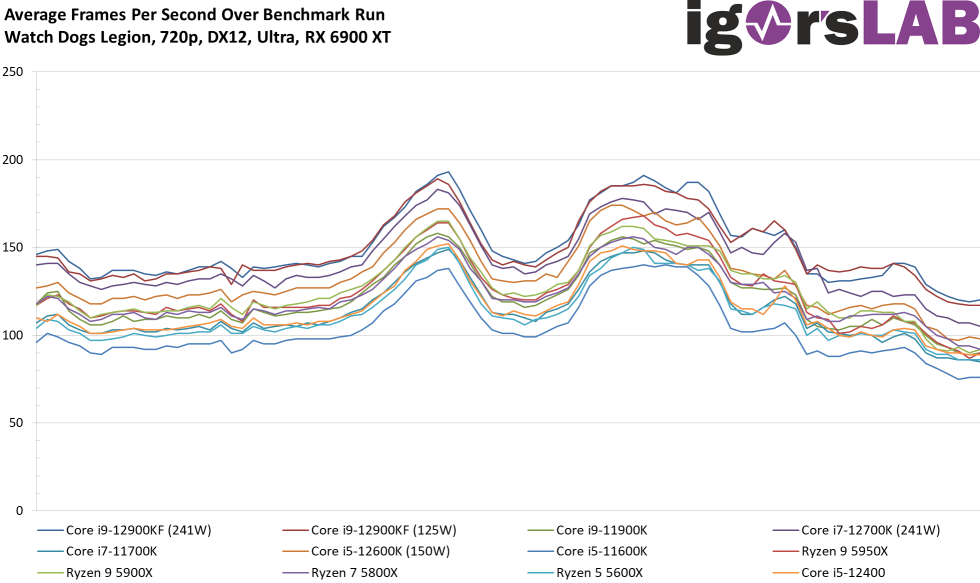
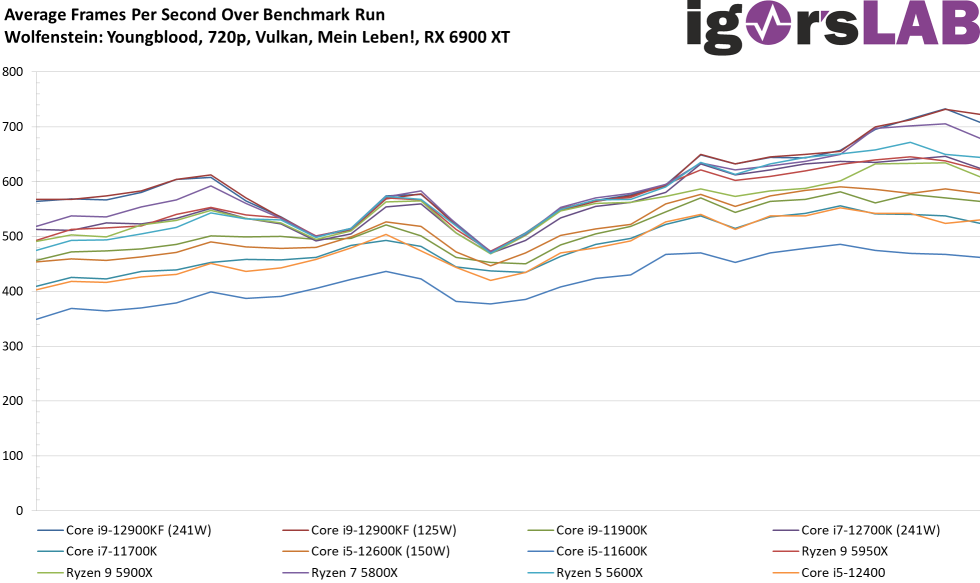
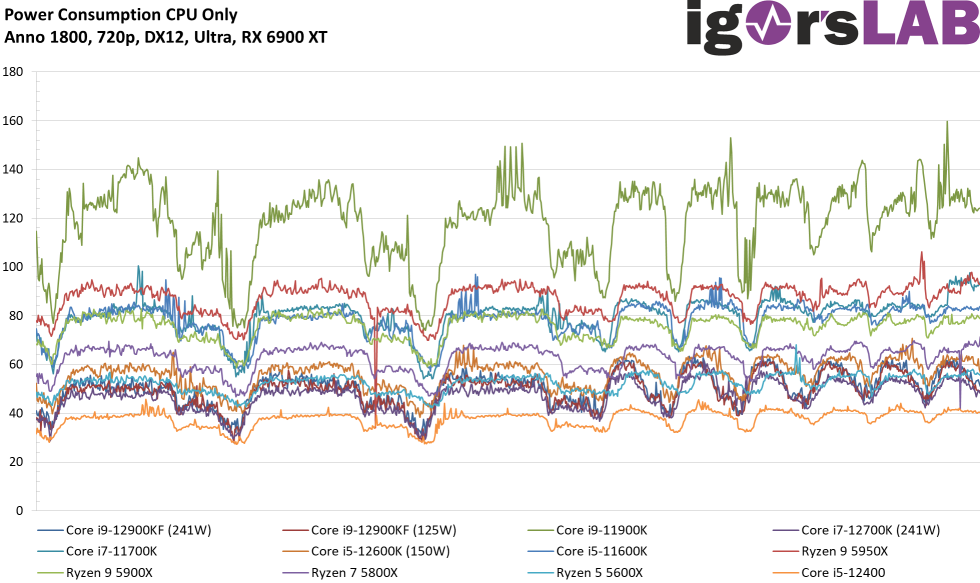
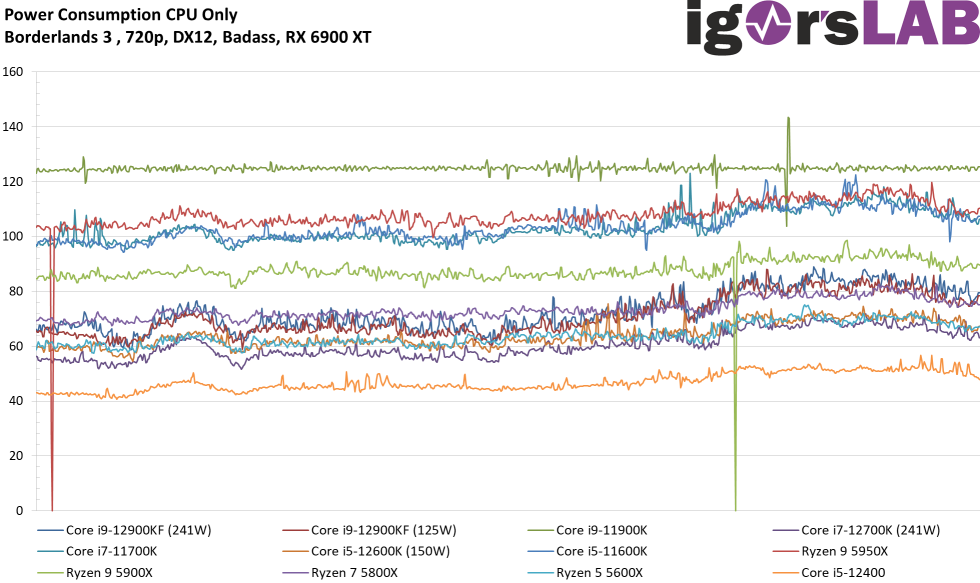
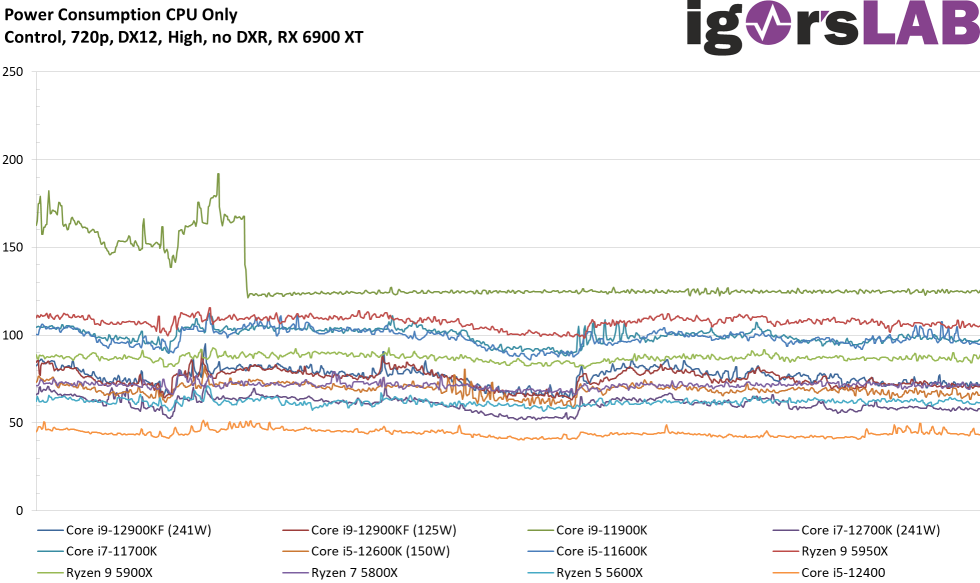
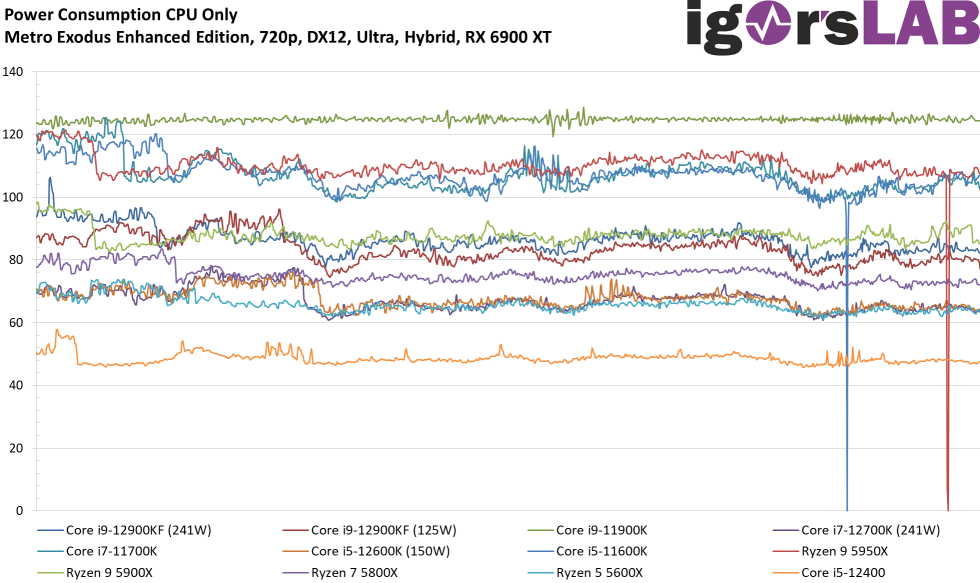
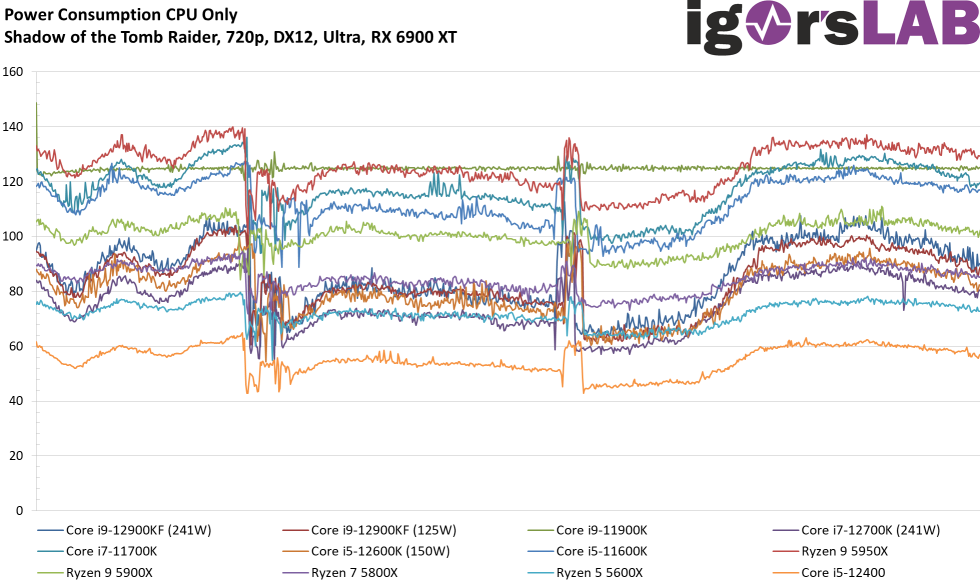
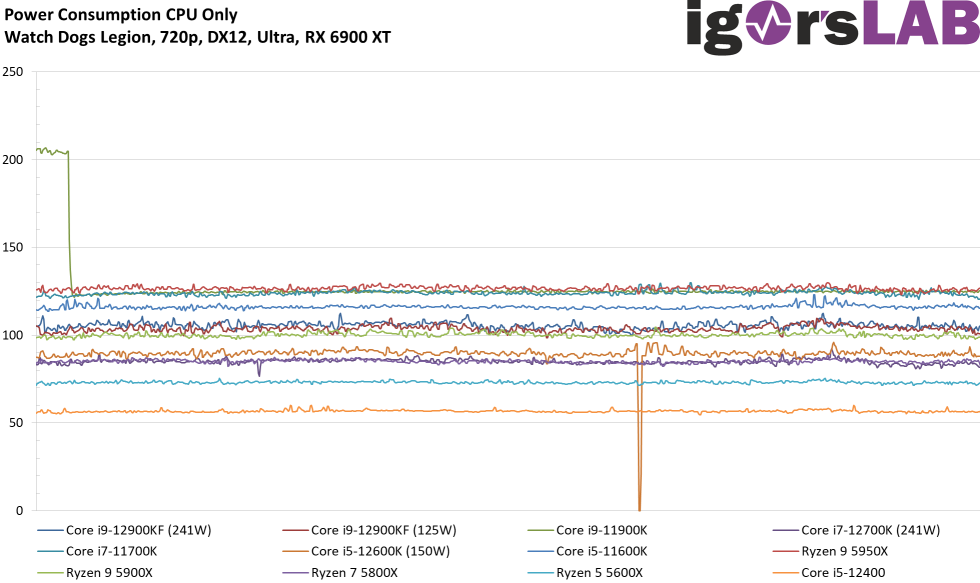
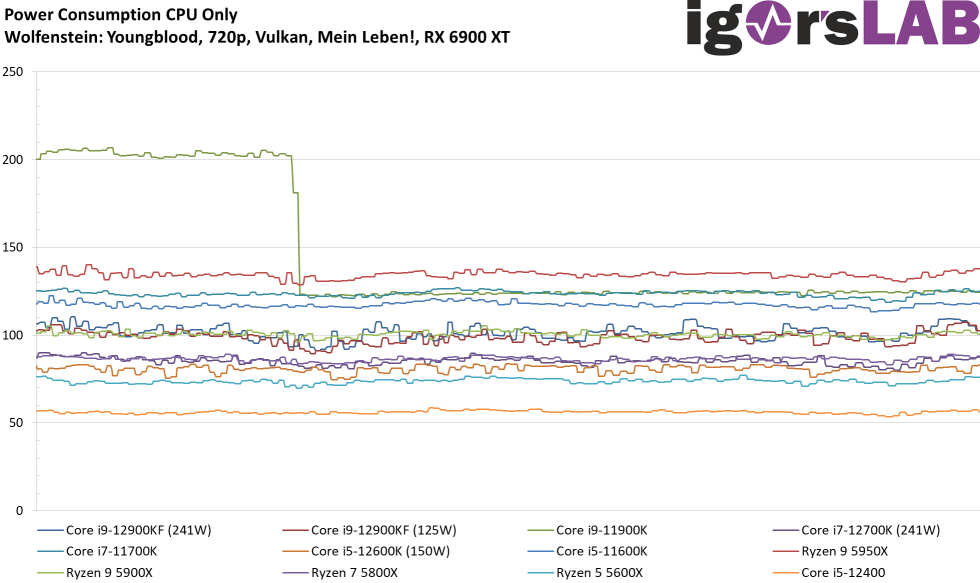
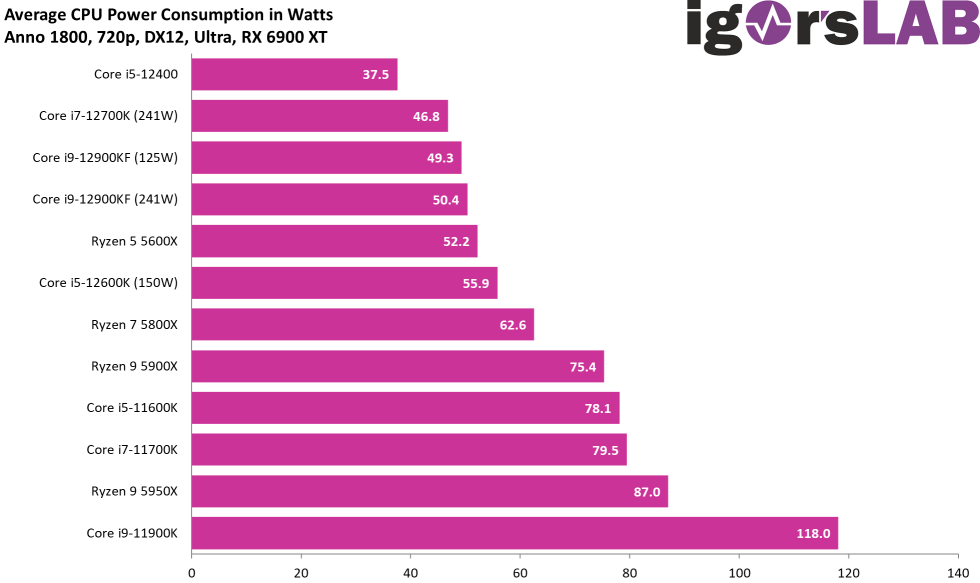
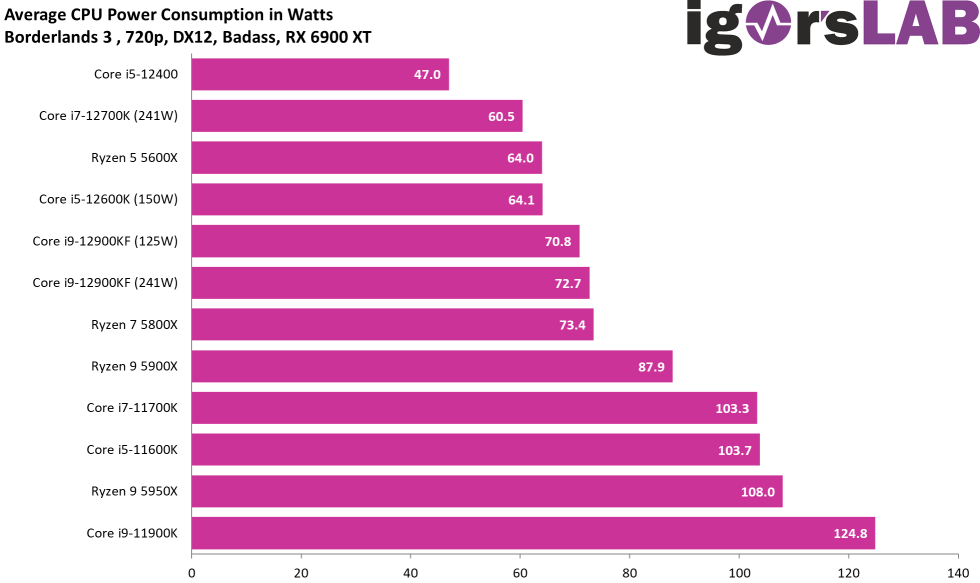
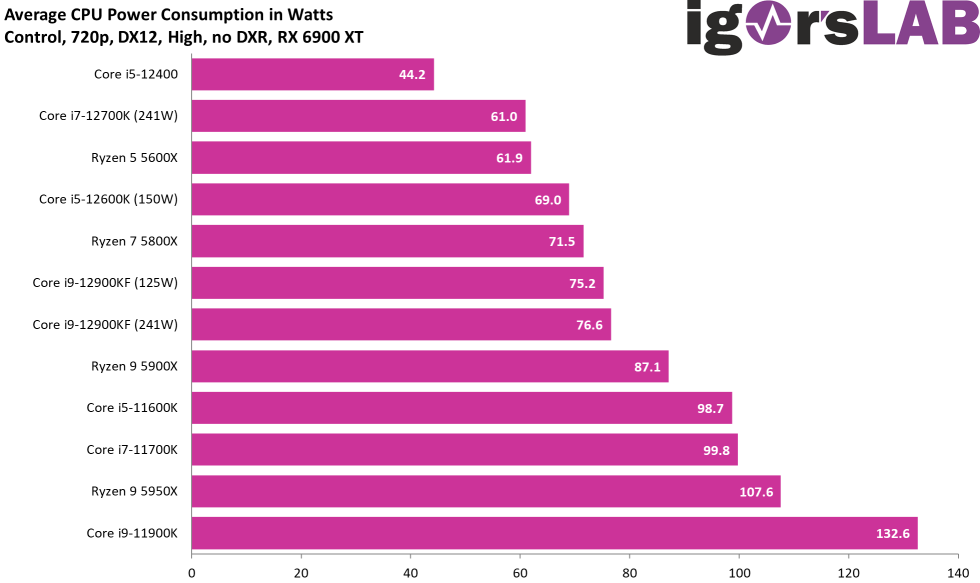
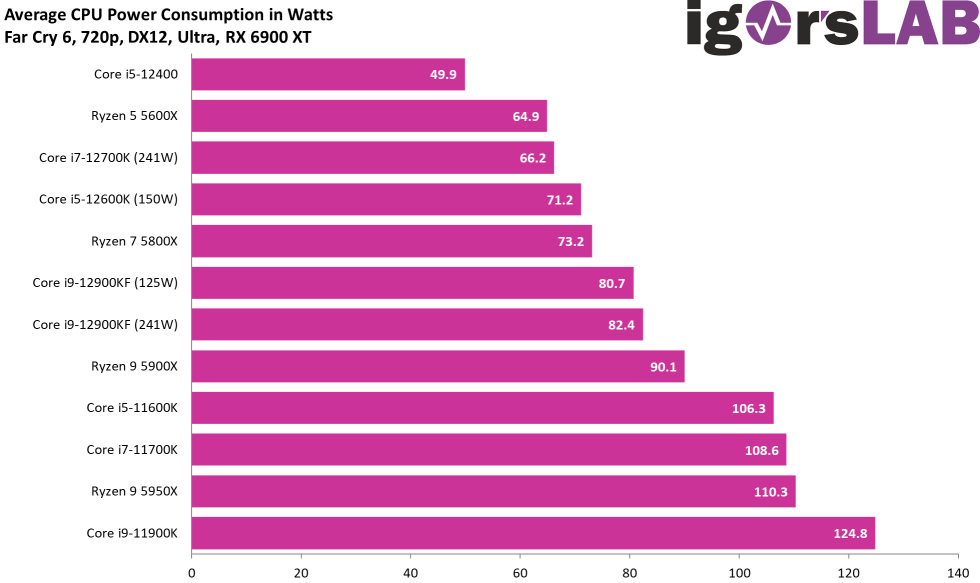
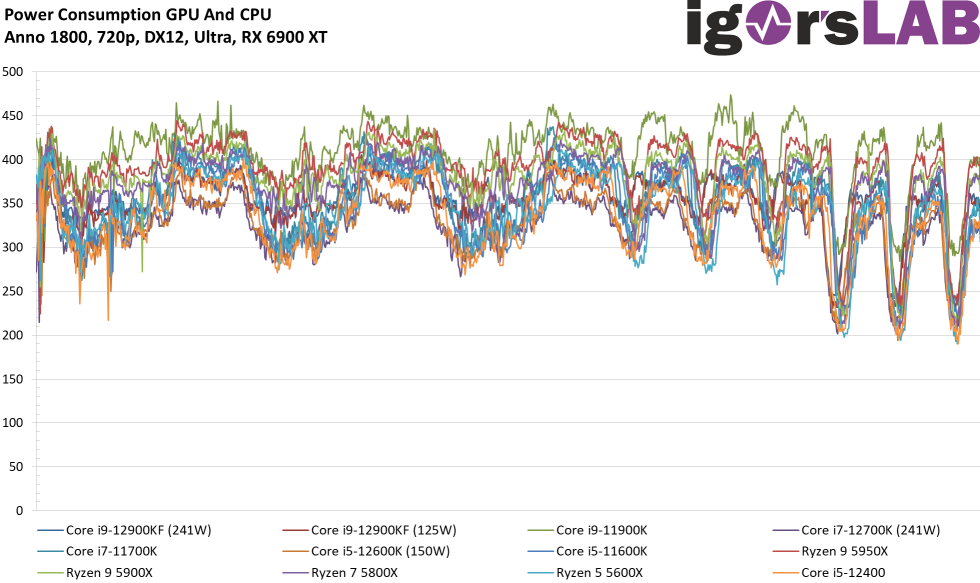
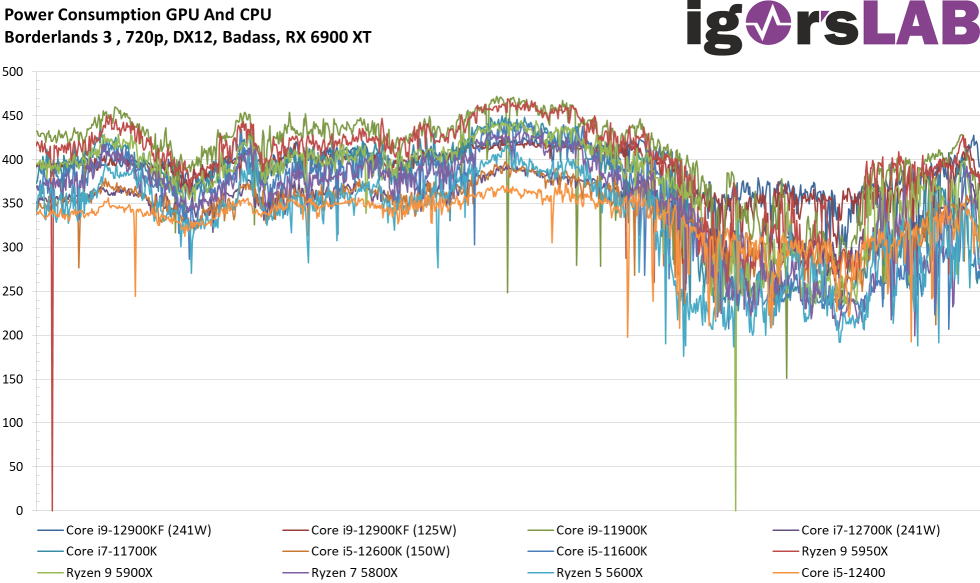
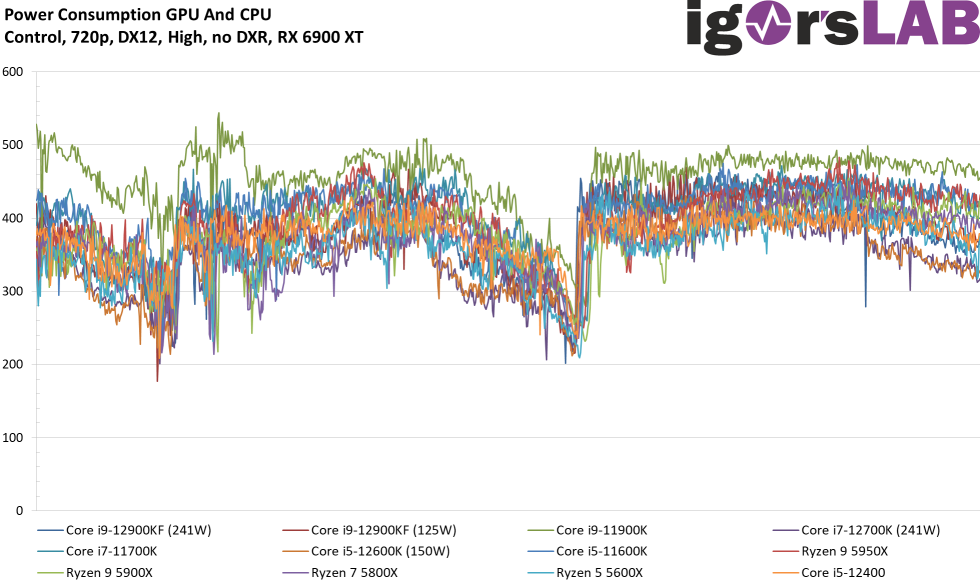
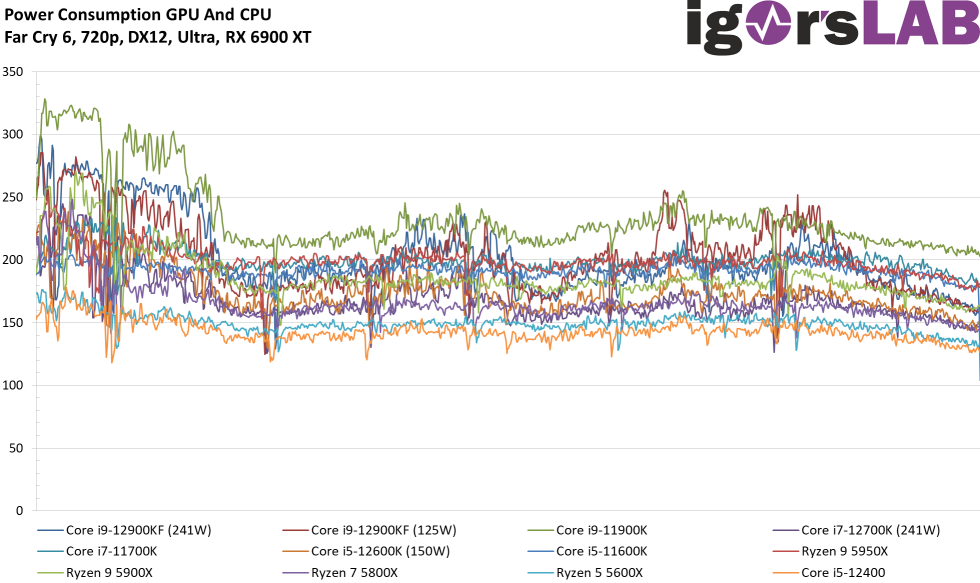
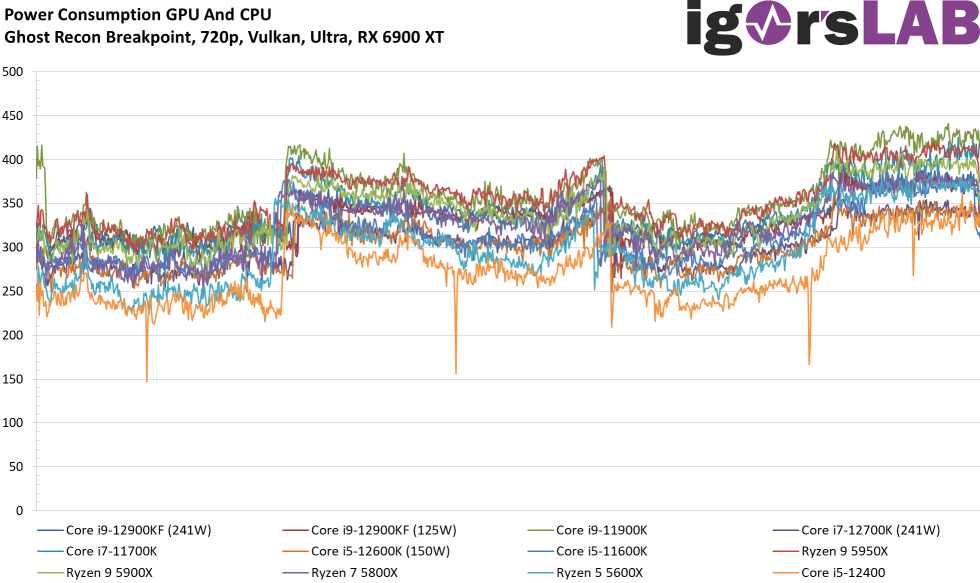
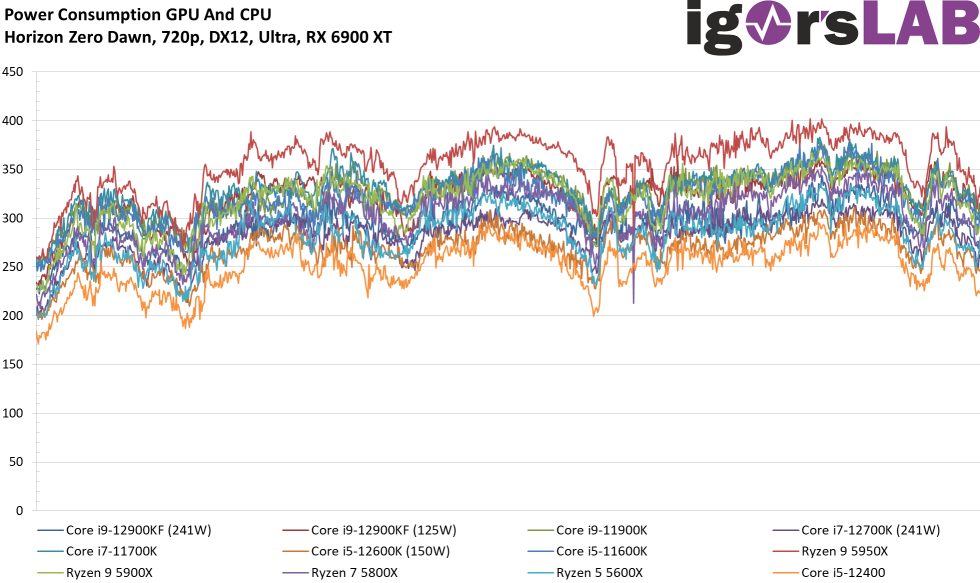
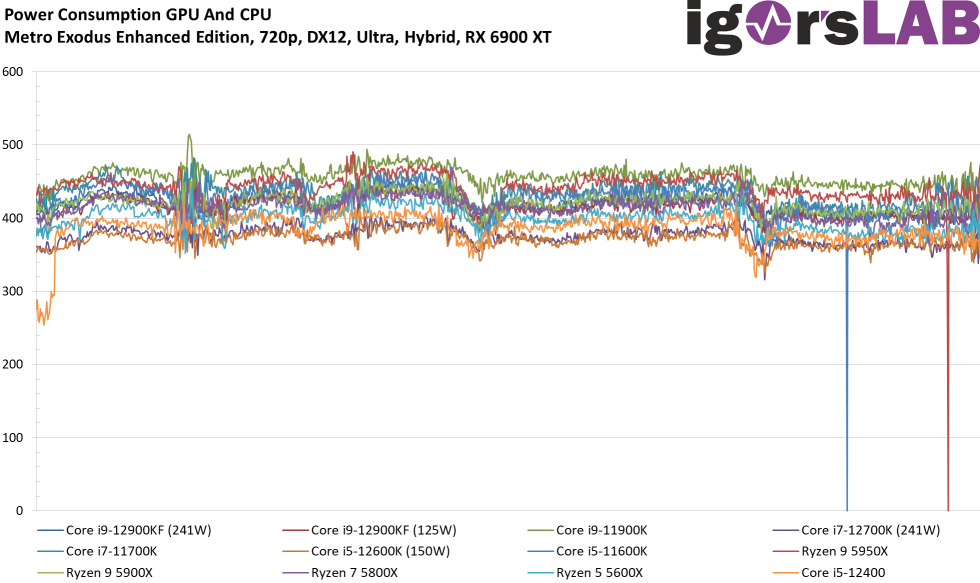
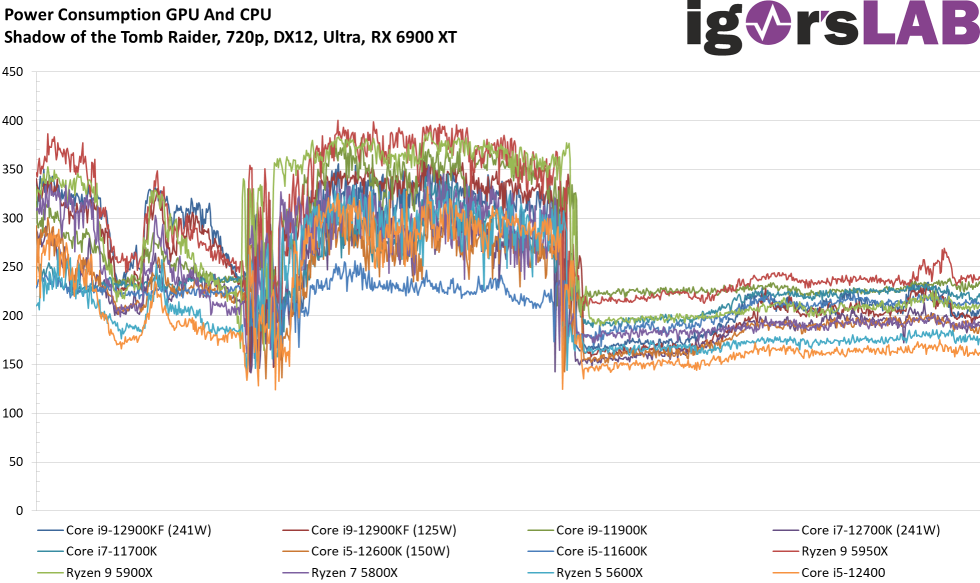
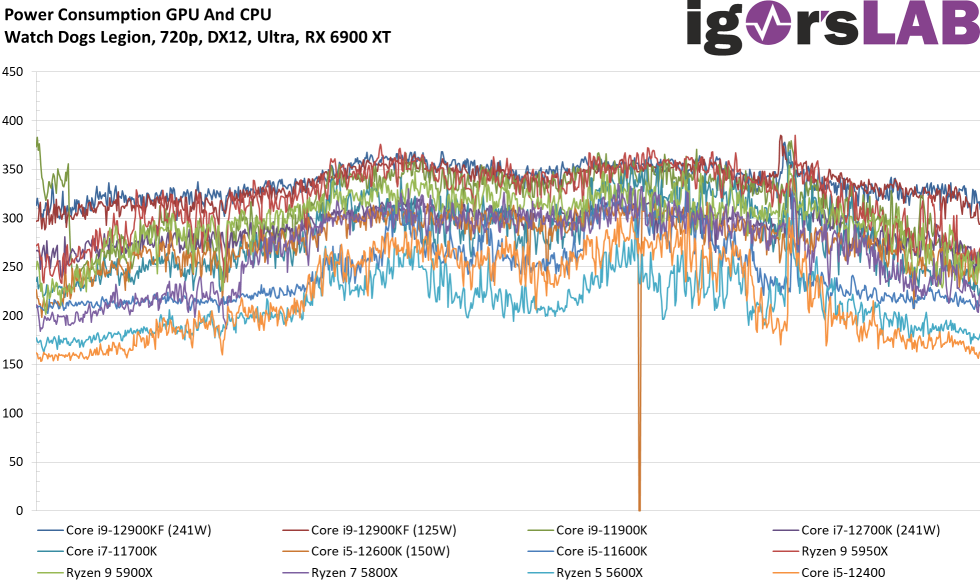
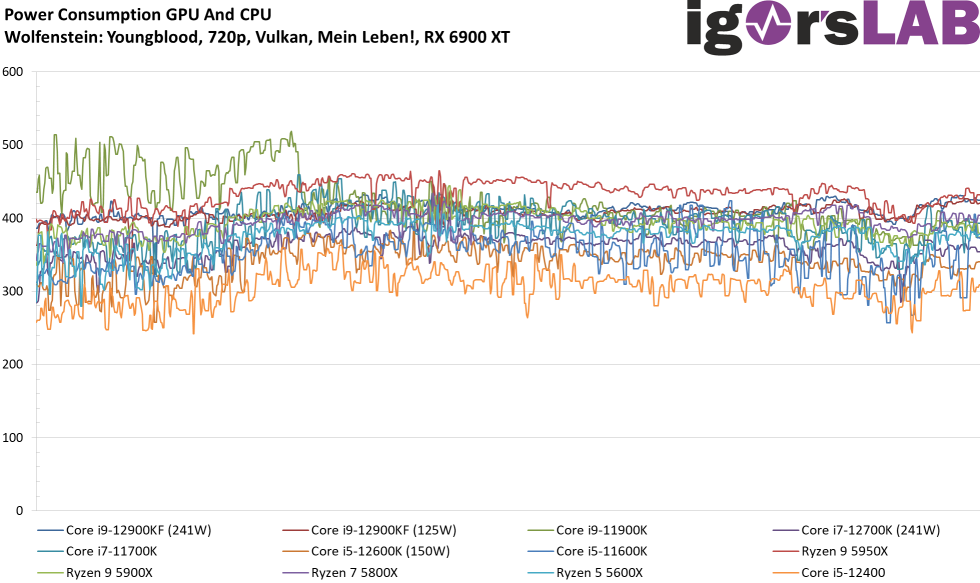
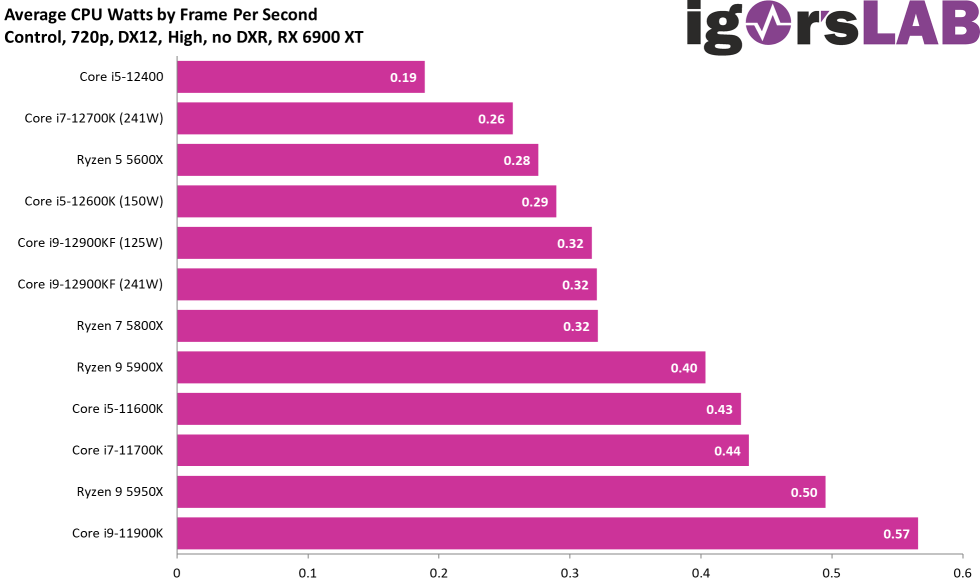
For a better illustration of the power consumption in relation to the FPS, I now show the already known FPS curves and the CPU power consumption in relation to each other. You can now select the same game you want in each of the galleries and then compare these curves. Very remarkable here is the curve of the Core i9-11900K, where you can see the PL1 and the drop of the curve after time very well. Now we know why Rocket Lake was so and rightly called a pompous sham giant. By the way, Control does not show any special saving effects but remains fully in line with the trend despite the limiter.
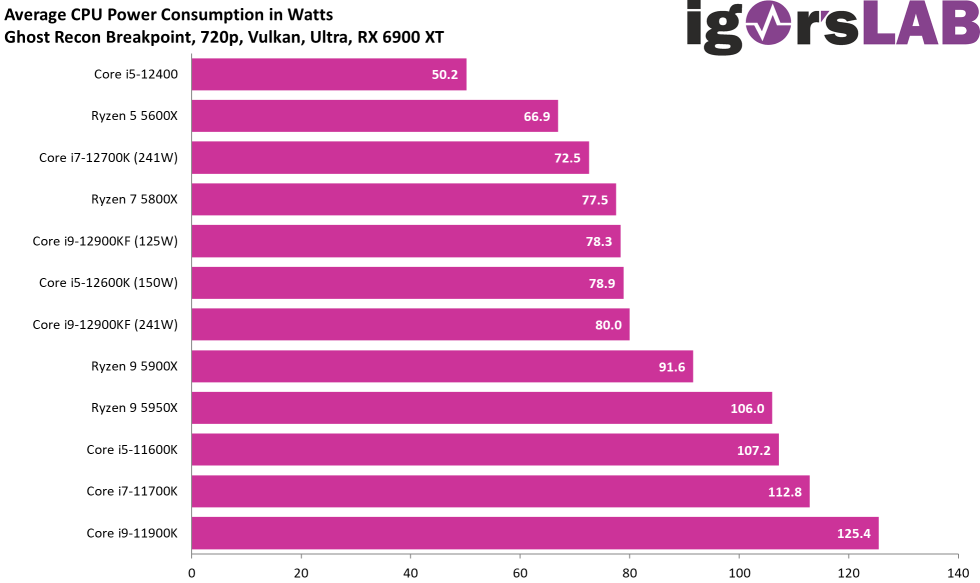
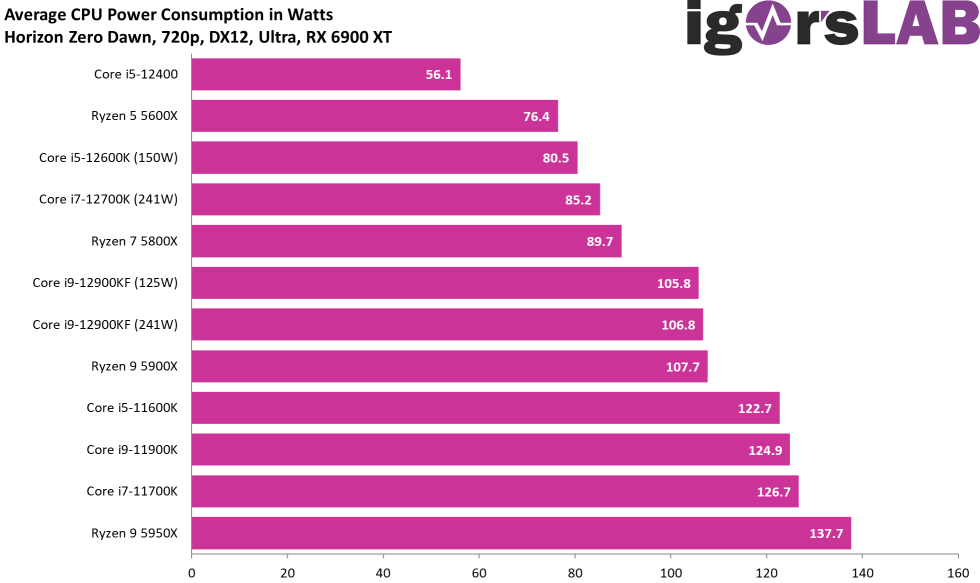
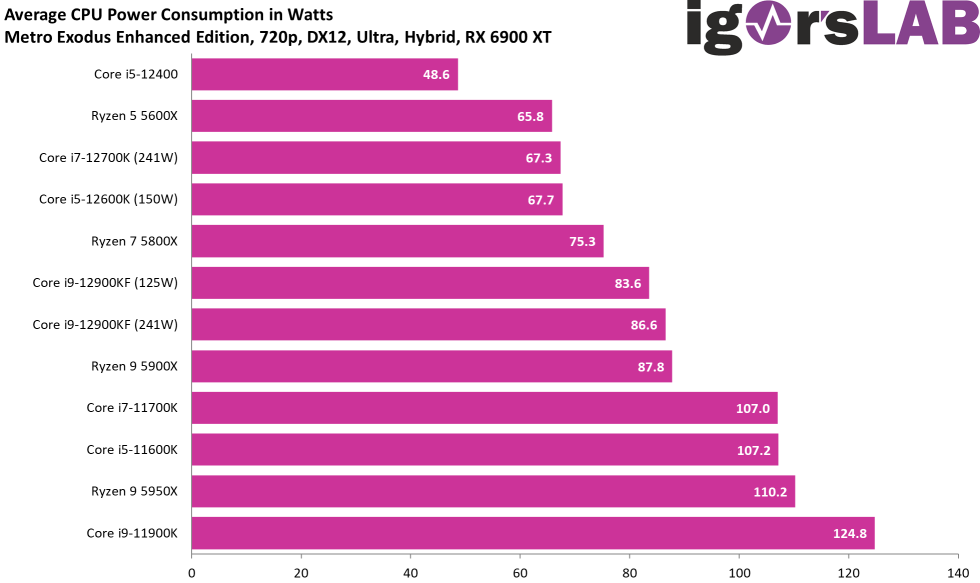
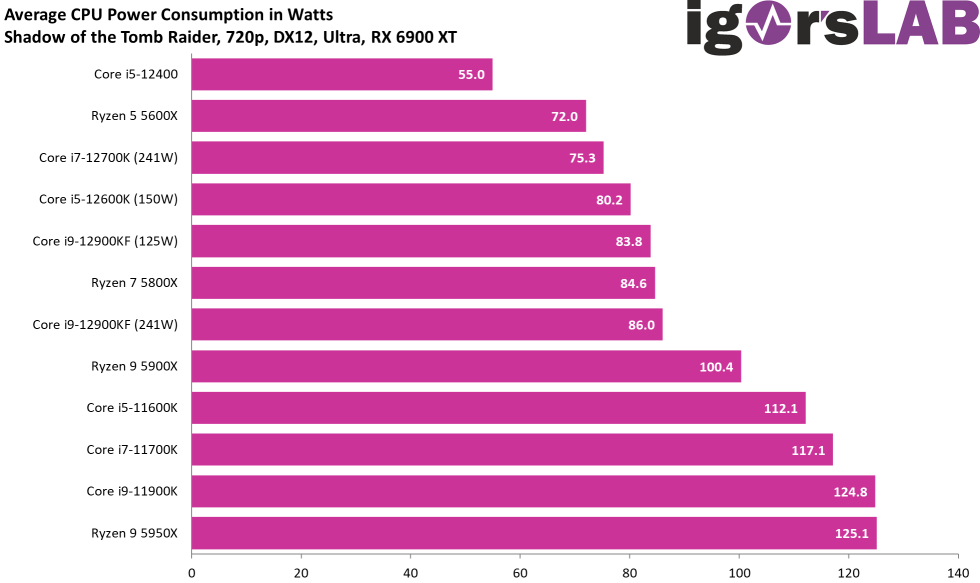
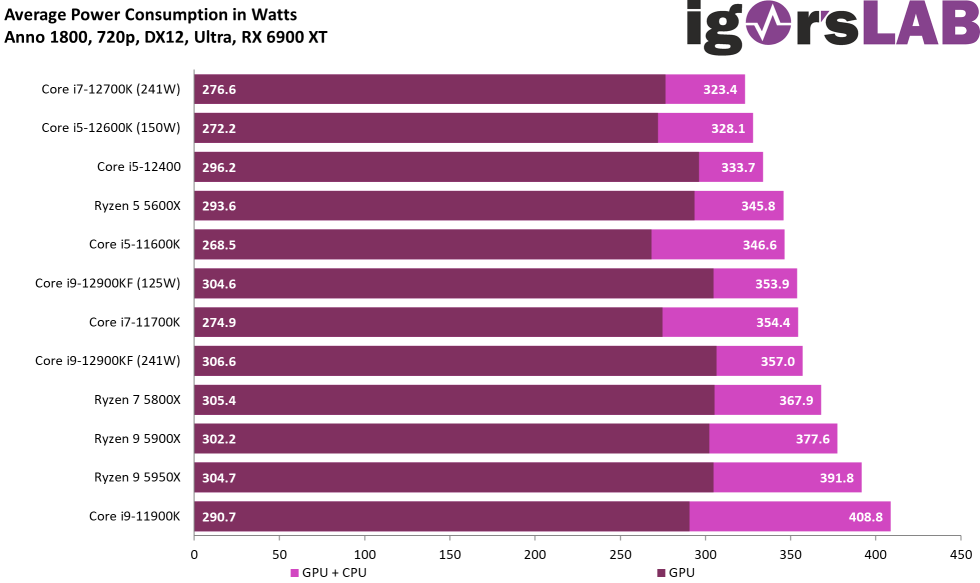
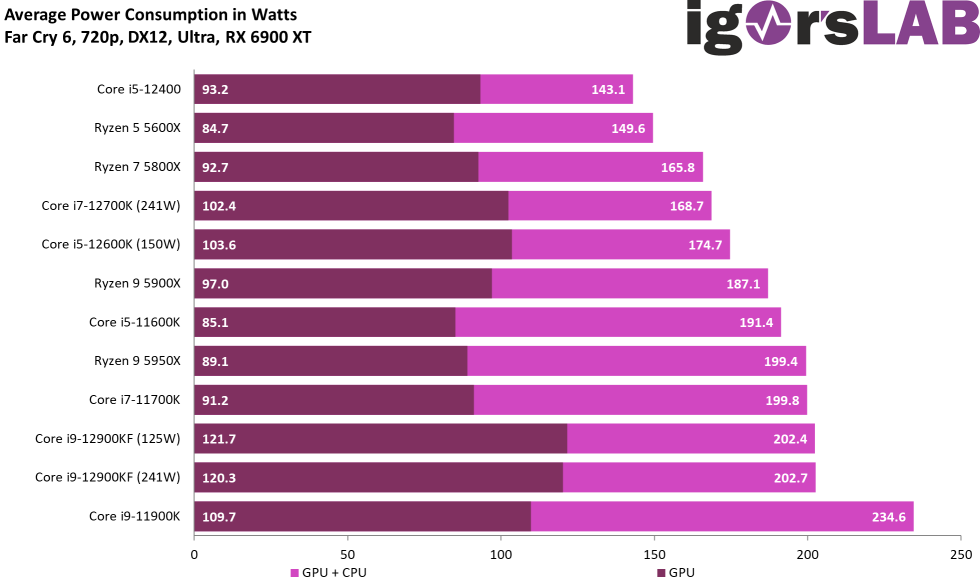
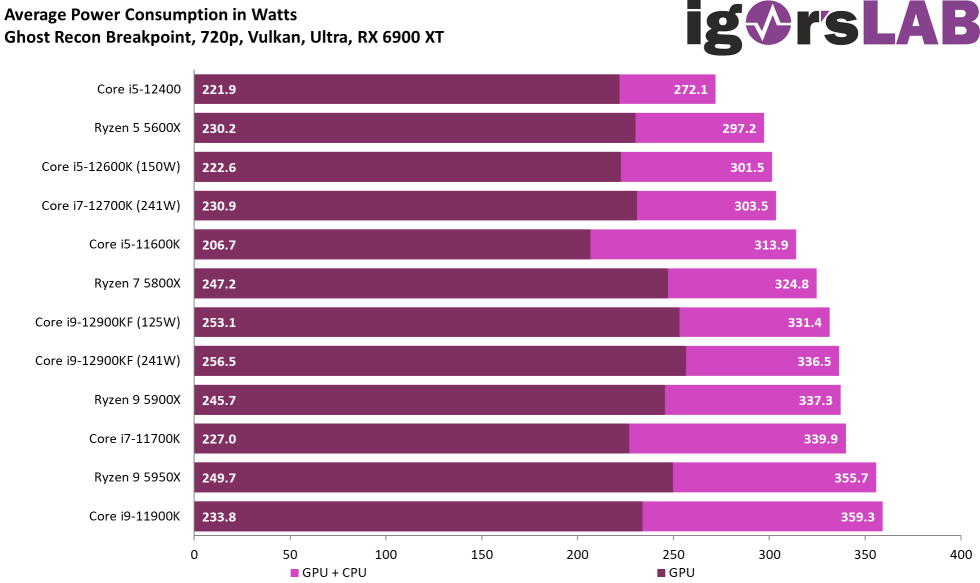
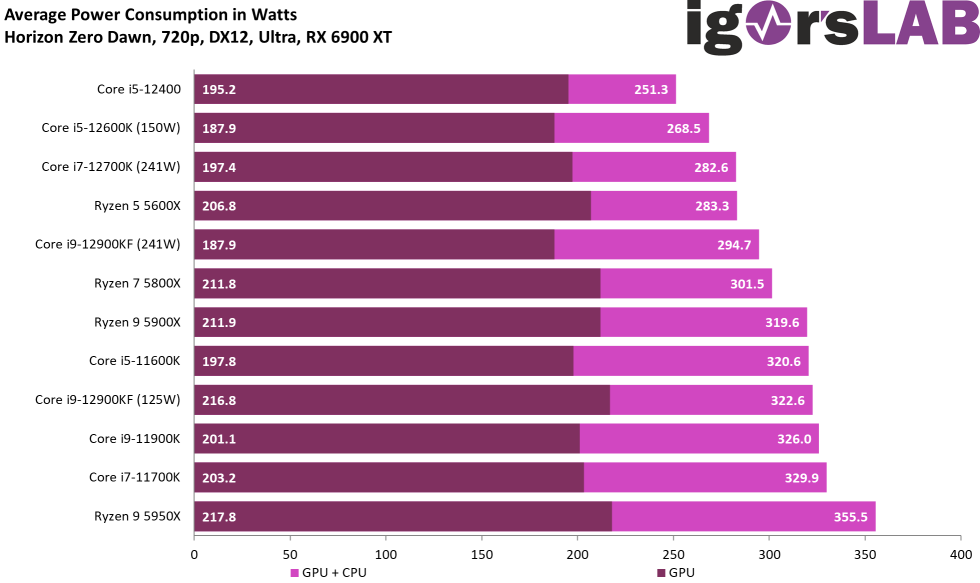
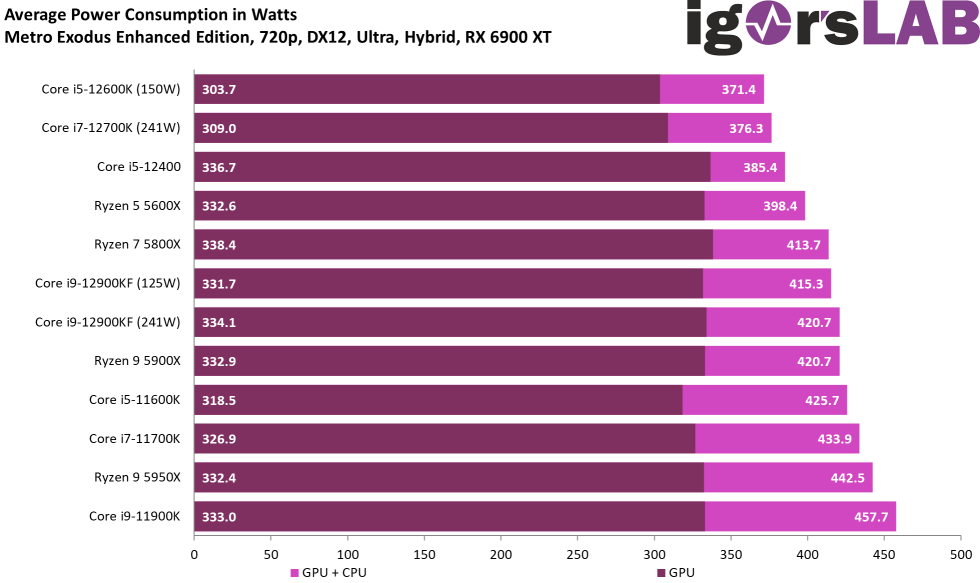
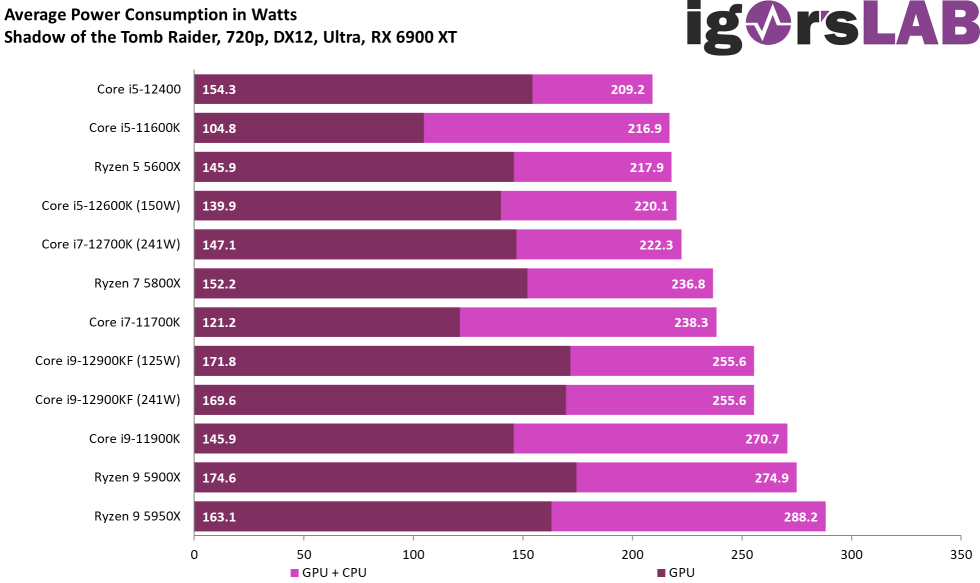
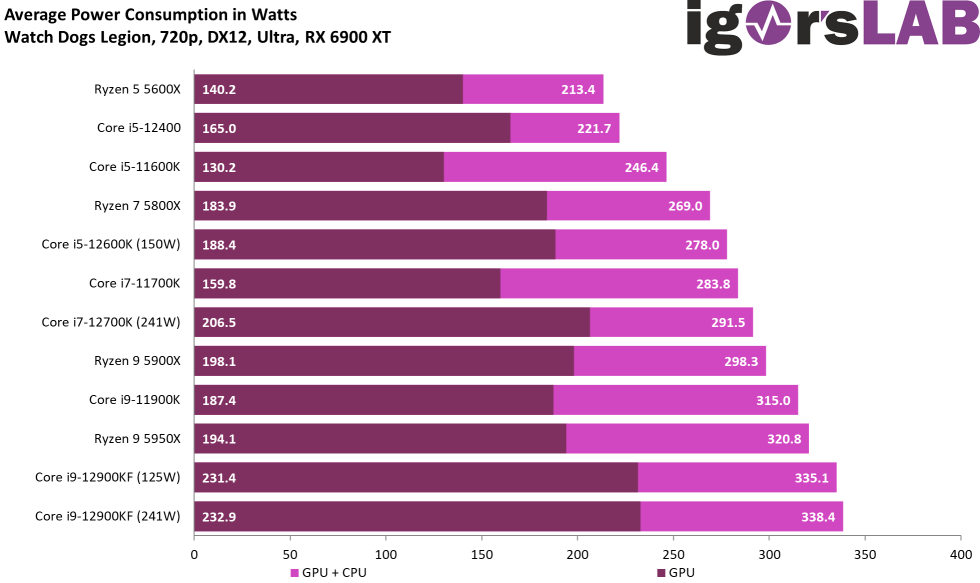
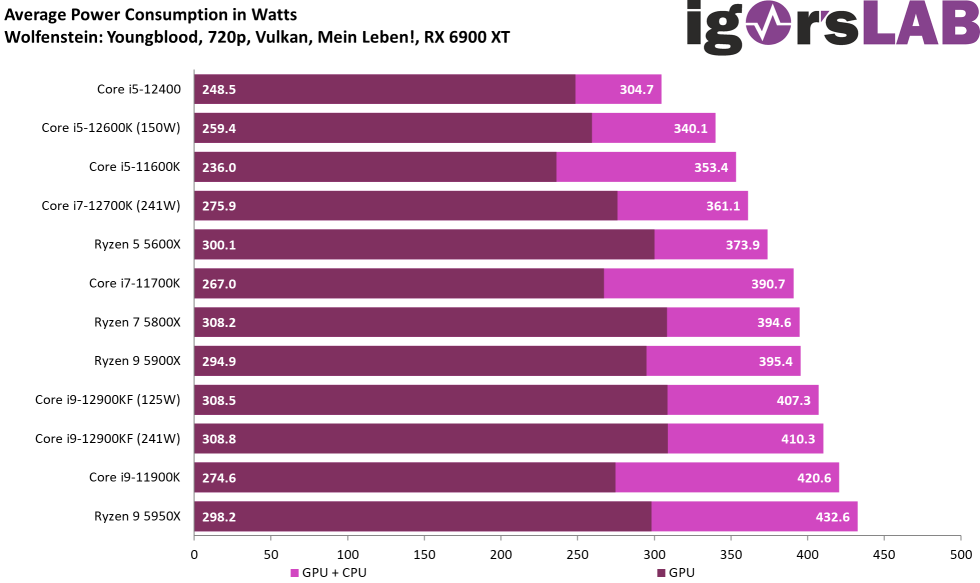
And the Core i5-12400? This is the most mannerly candidate at the electricity counter and thus also the coming hate object of all electricity producers. The values are, despite the still so high PL1, so low compared to the Ryzen CPUs that I forgot to close the jaw dropped in amazement again. And yet it is reality and exactly what I had already spoiled earlier with actual relevant bar length. Whoever believed that they would experience their blue miracle with Alder Lake S here: There it is, especially with the gutted i5-12400. And because it’s so nice, I first have the Package Power as a bar chart again:
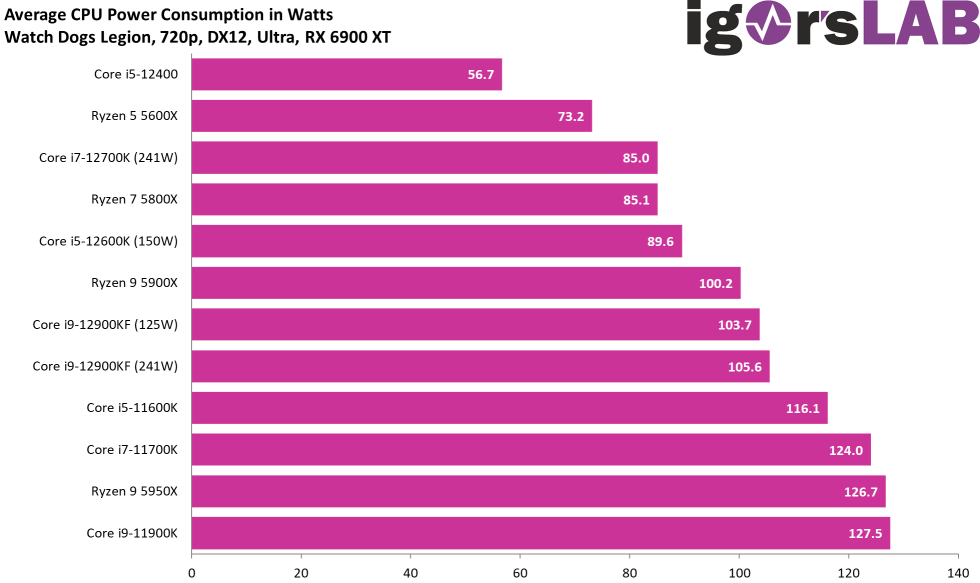
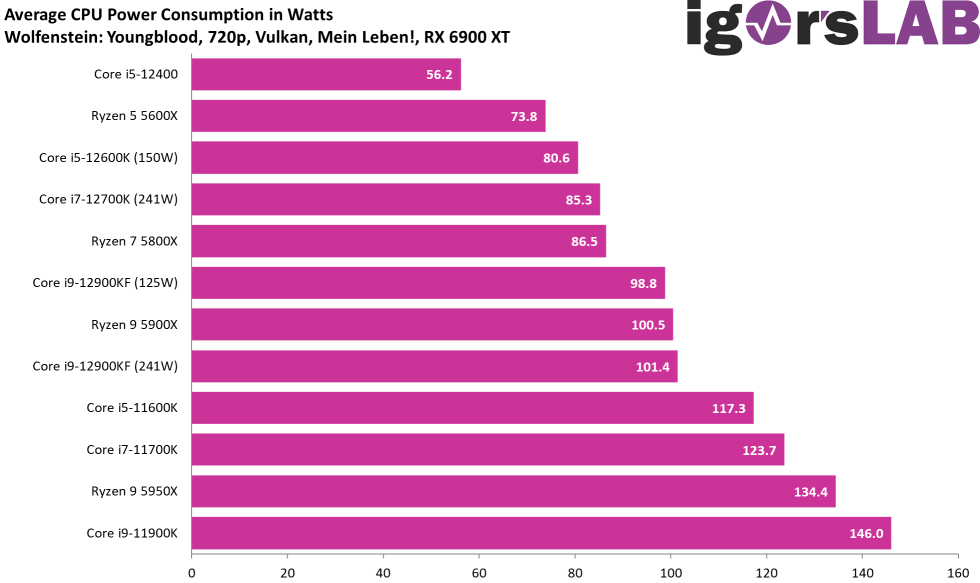
We also see in the sum of GPU and CPU (that belongs together, after all) that the faster CPUs naturally produce higher GPU power consumption. We already know the curves in a similar form from above and after that we also have the summary in the bar chart:


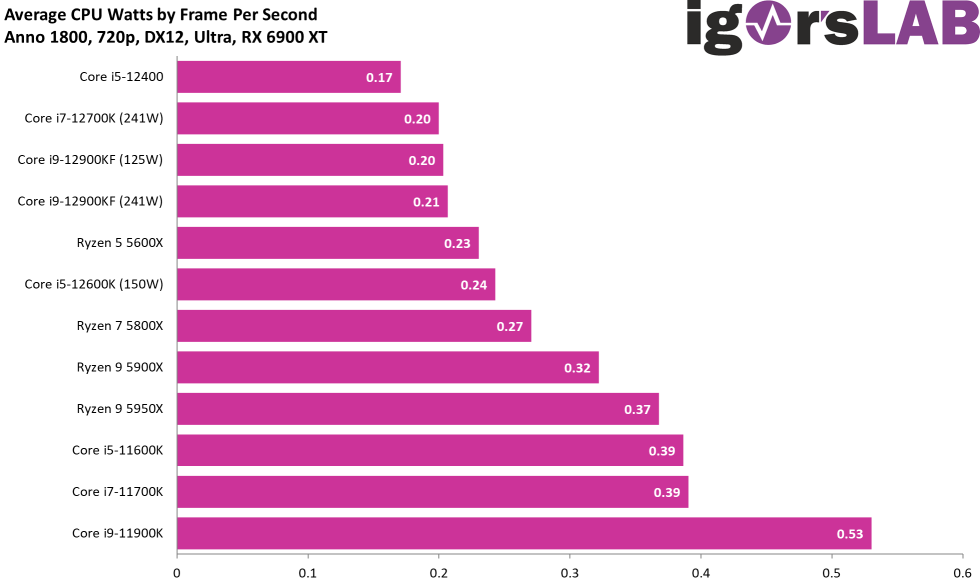
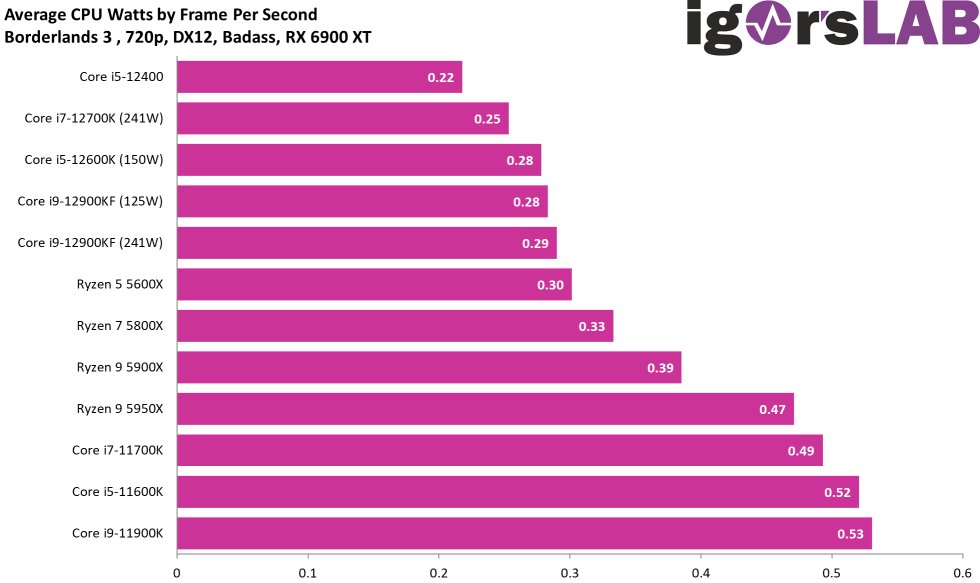
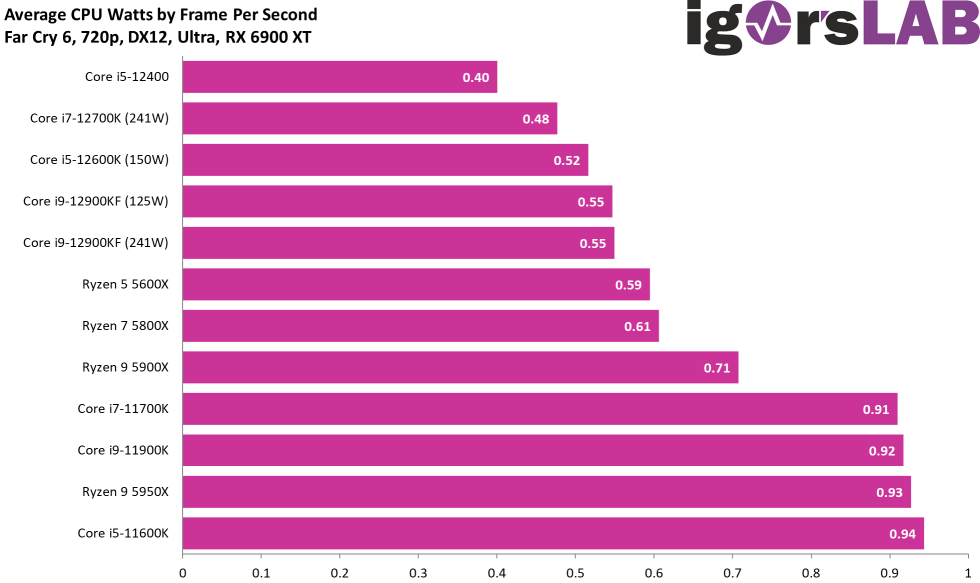
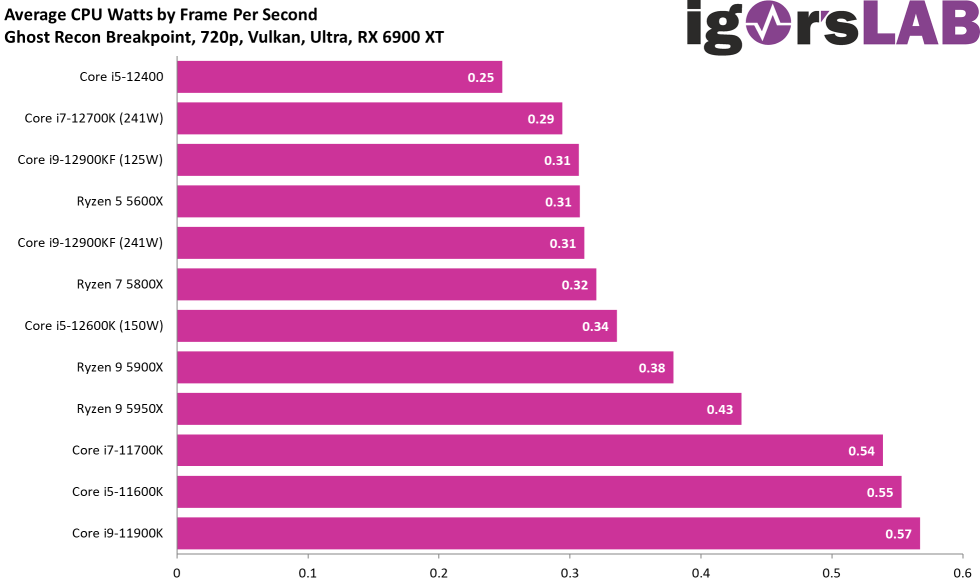
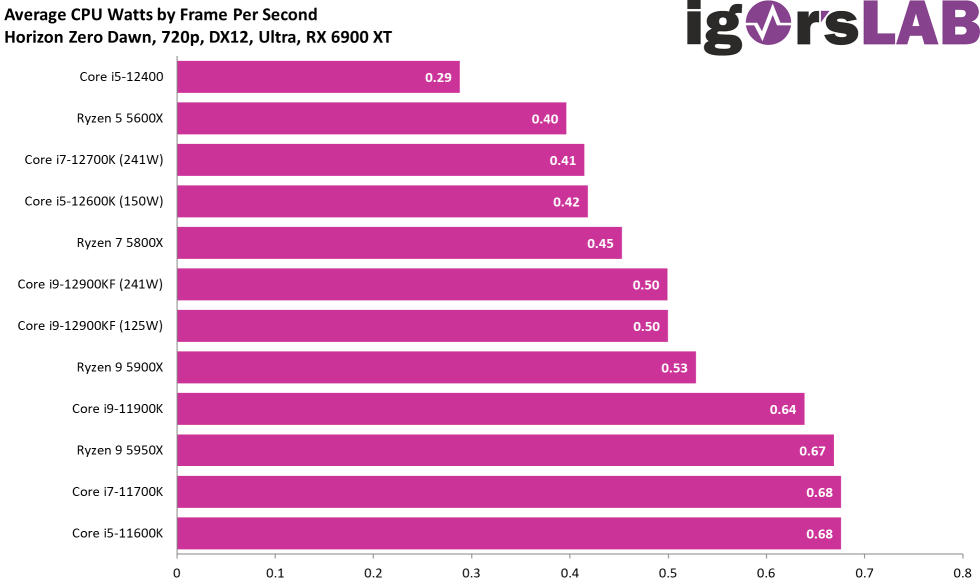
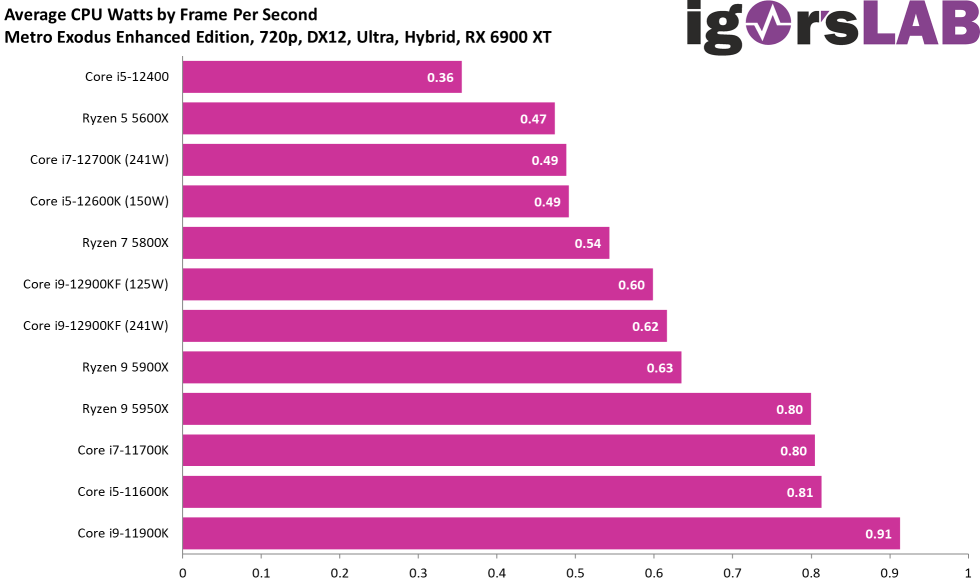
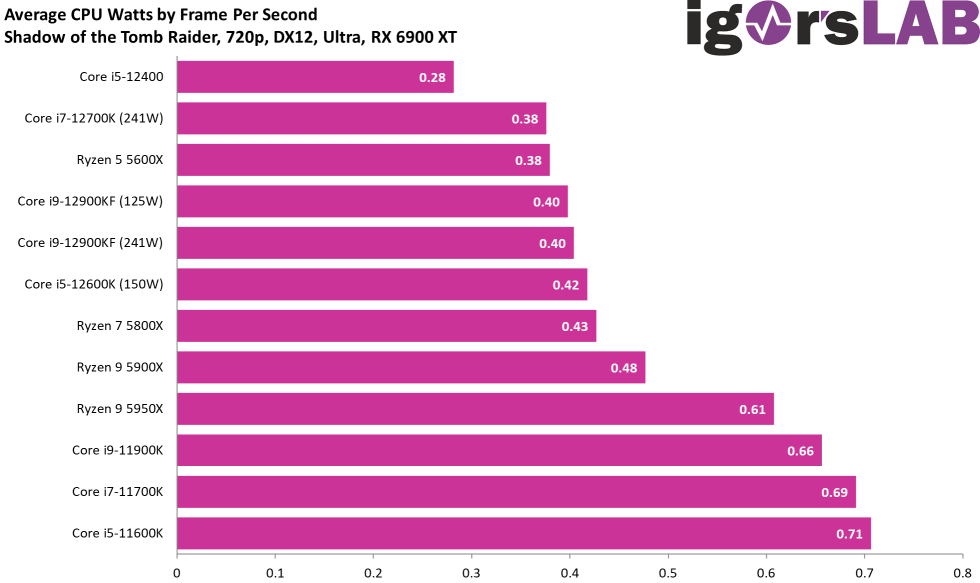
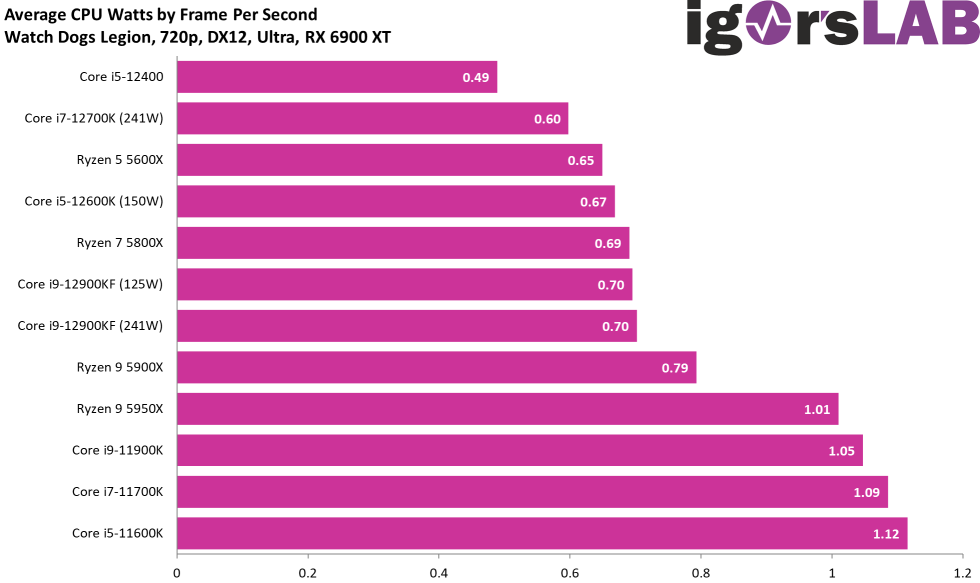
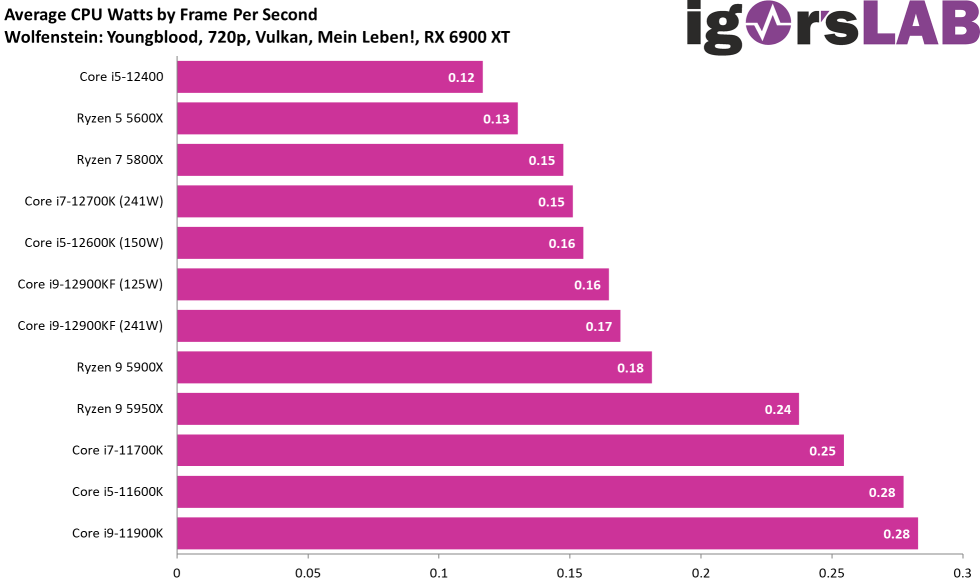
Efficiency of the CPU in Watt per achieved FPS
Of course, you always have to look at the power consumption in the context of gaming performance. Here I have simply calculated how many watts you have to spend per second for a single frame. The Core i5-12400 even beats the Ryzen 5 5600X by a long way, who would have thought that a few months ago!
So I’m done with 720p for now and even if you’re not a stamp collector, you might have gained some new knowledge. And also for this there is the final cumulation of all single results at the end in the conclusion on the last page.

- 1 - Introduction, Test System and Methods
- 2 - 720p - Gaming Performance
- 3 - 720p - Power Draw and Efficiency in each Game
- 4 - 1080p - Gaming Performance
- 5 - 1080p - Power Draw and Efficiency in each Game
- 6 - 1440p - Gaming Performance
- 7 - 1440p - Power Draw and Efficiency in each Game
- 8 - Overall Gaming Performance and Comparison
- 9 - Summary of Power Consumption and Efficiency
- 10 - Conclusion and Final Words (for now)


39 Antworten
Kommentar
Lade neue Kommentare
Mitglied
Urgestein
Urgestein
Veteran
1
Urgestein
Urgestein
Urgestein
Urgestein
Veteran
Mitglied
Urgestein
Mitglied
1
Urgestein
Veteran
Mitglied
Urgestein
Urgestein
Alle Kommentare lesen unter igor´sLAB Community →