


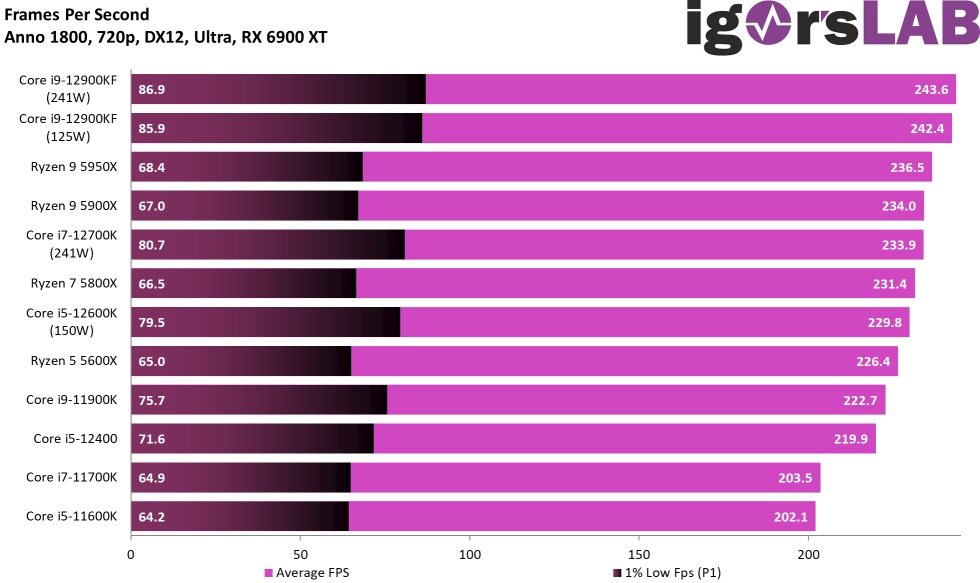
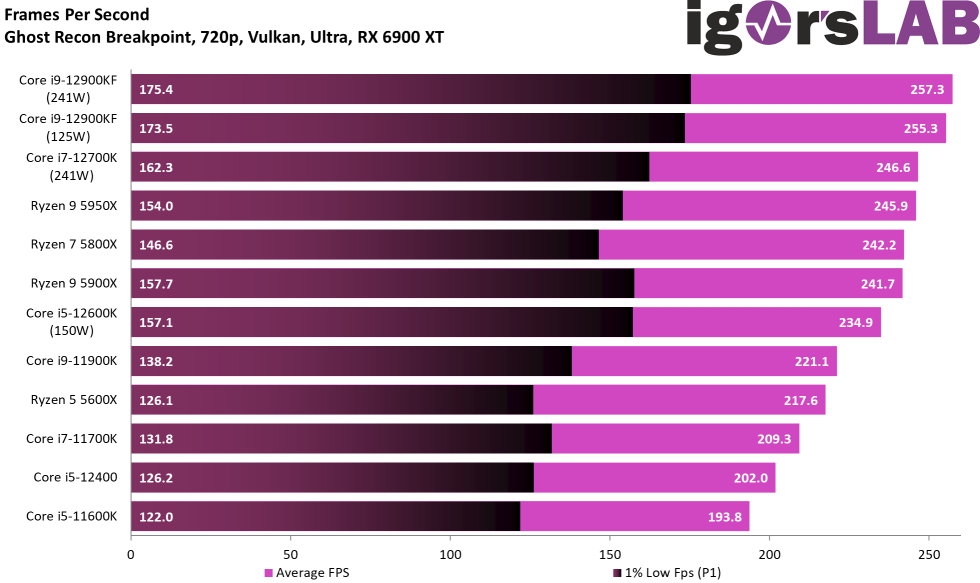
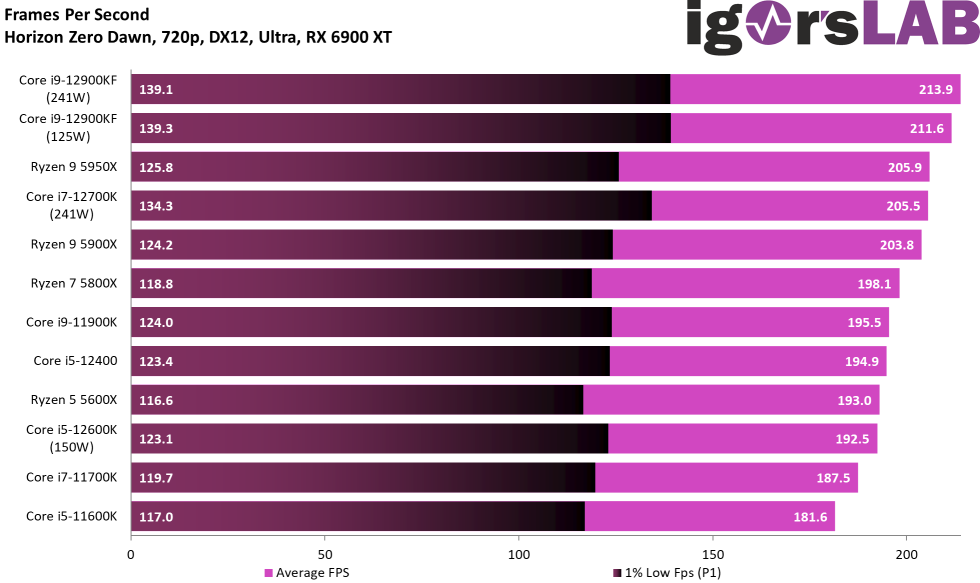
We’ll also start with the Intel Core i5-12400’s measurements in 720p, that is a resolution with 1280 x 720 pixels. Sure, no one games that way, of course, but it’s at least a theoretical chance to work out differences and do various experiments on the “what if” principle. After all, we want to benchmark the CPUs and not the graphics cards. After all the updates and patches, the differences between Alder Lake and Zen3 have become more relative again, and they have also become much smaller.
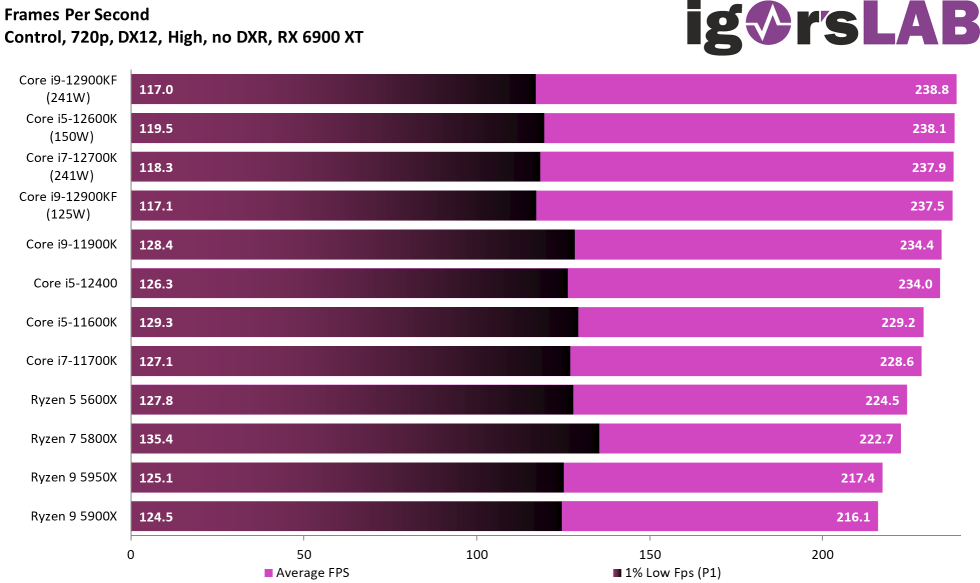
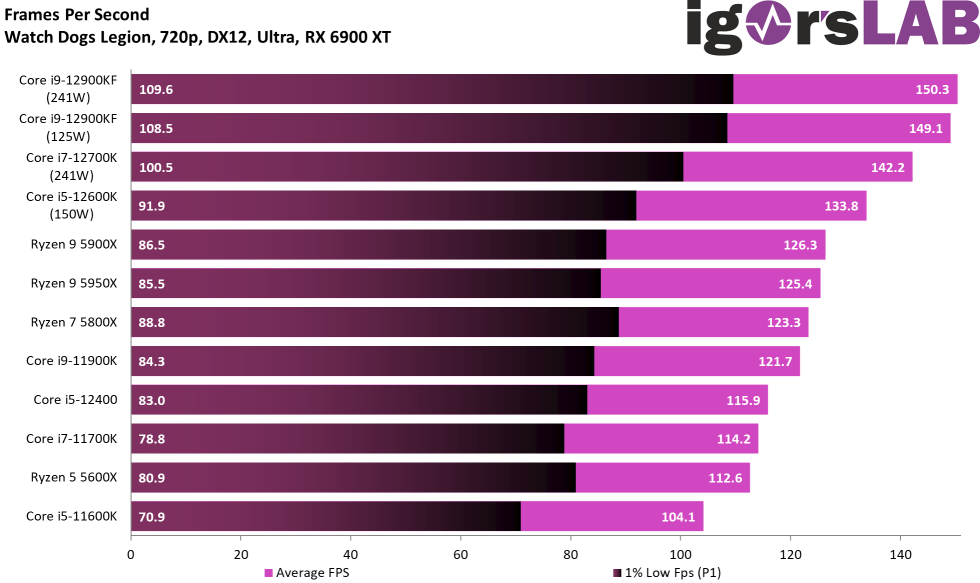
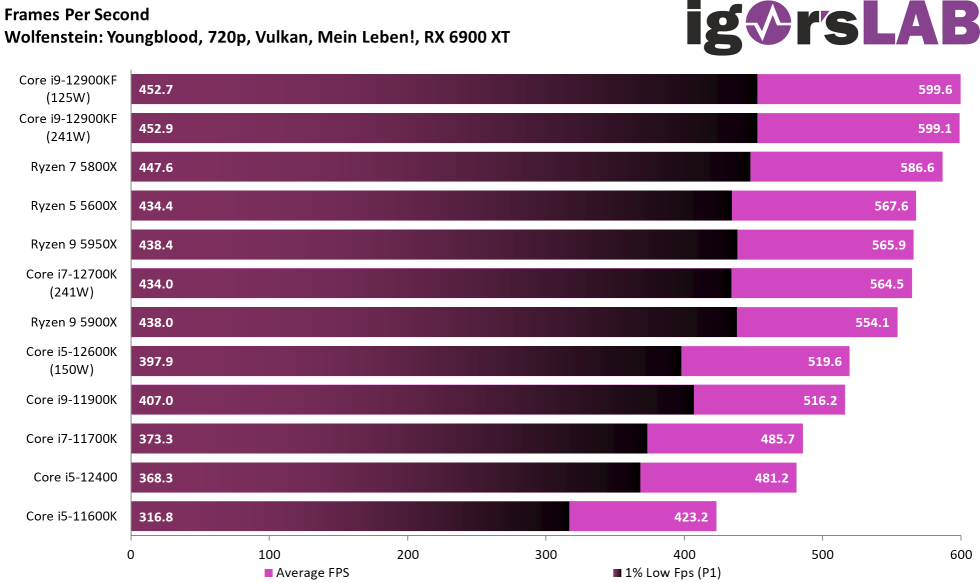
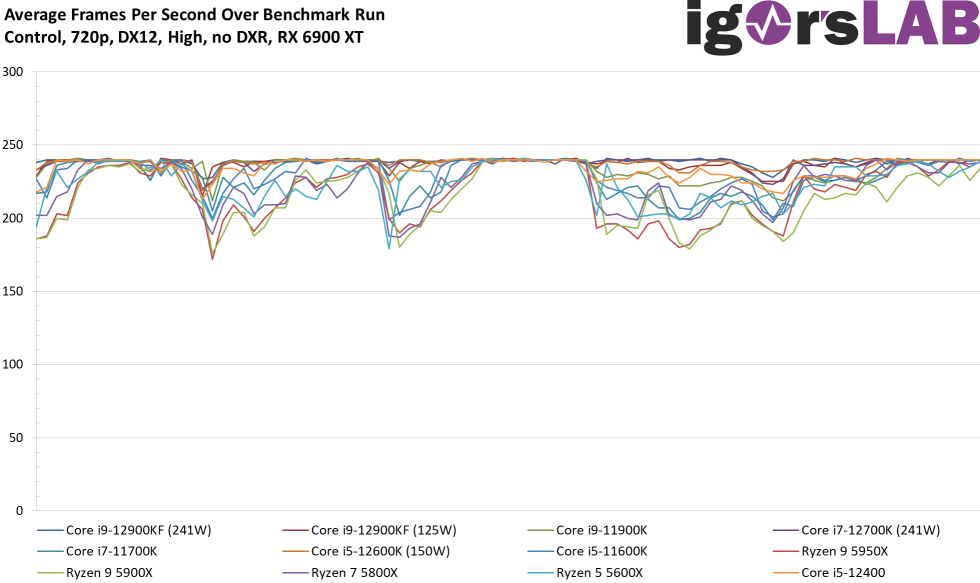
If we look at the FPS benchmark bars first, we’ll notice that the differences between the Core i5-12400 and the Ryzen 5 5600X aren’t that big overall, but they do vary greatly from game to game (and setting). Since the coil whine in Control was getting on my nerves, I did something that shouldn’t be done in 720p tests: for fun, I turned on the 240 Hz frame limiter. Then there was silence. Finally.
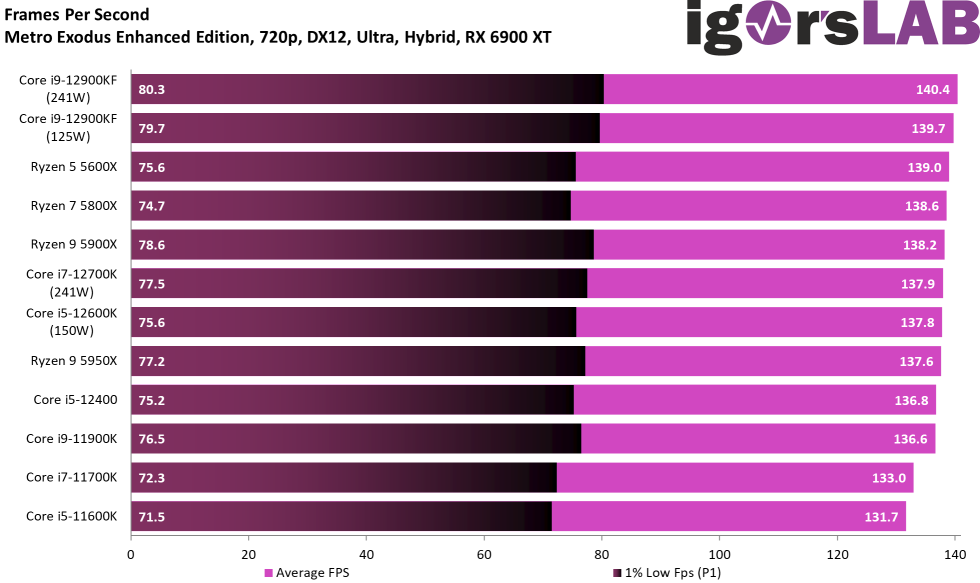
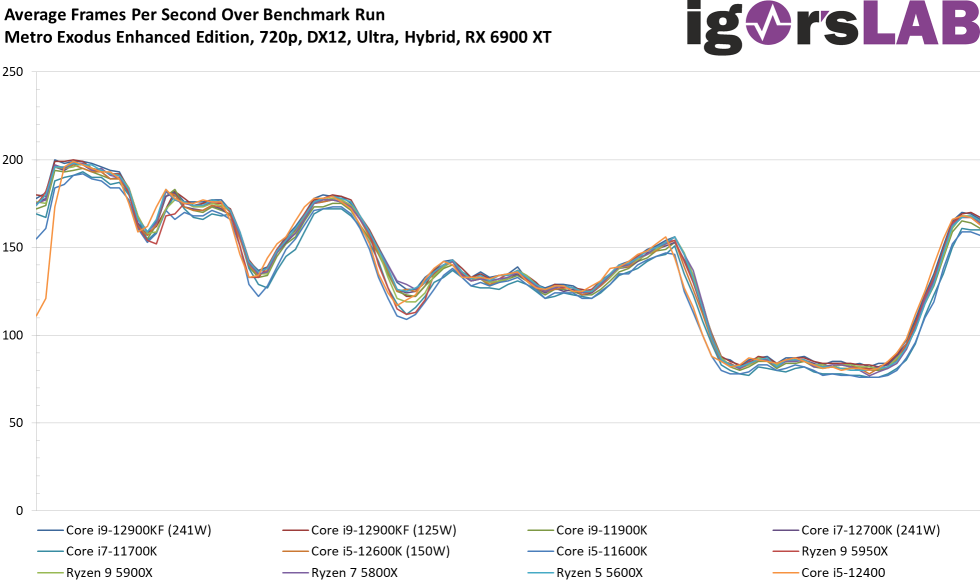
By the way, the limiter only took effect partially, i.e. not always, as my test scene was quite long and demanding. But much more interesting was how the individual CPUs behaved here with the power consumption and exactly that I want to discuss later on the next page. Since I was at it already, I didn’t turn the settings completely to nothing in Metro Exodus either, but let the graphics card sweat along properly. So that left 8 tests in CPU bound, one test with alternating CPU and GPU bound, and one test showing what 720p would look like in GPU bound.
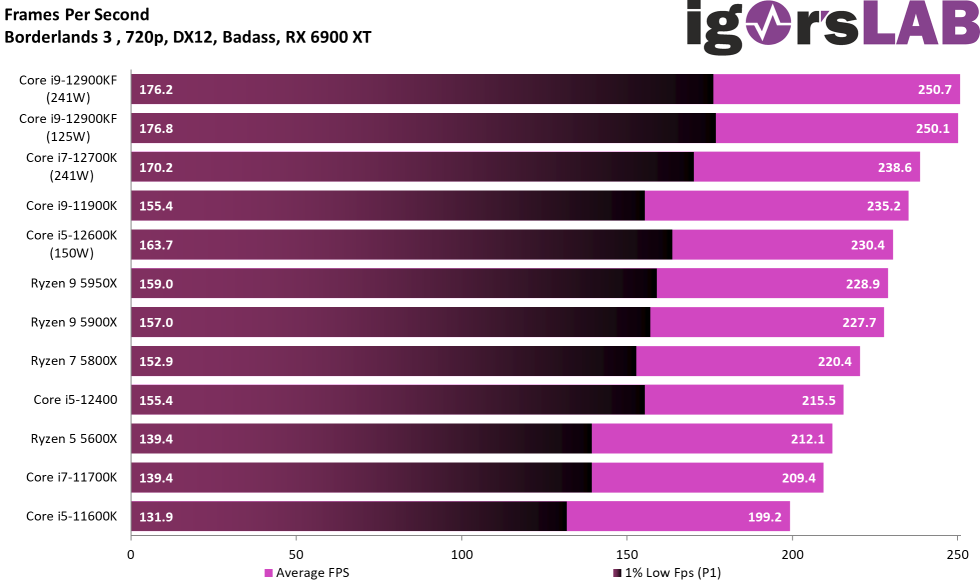
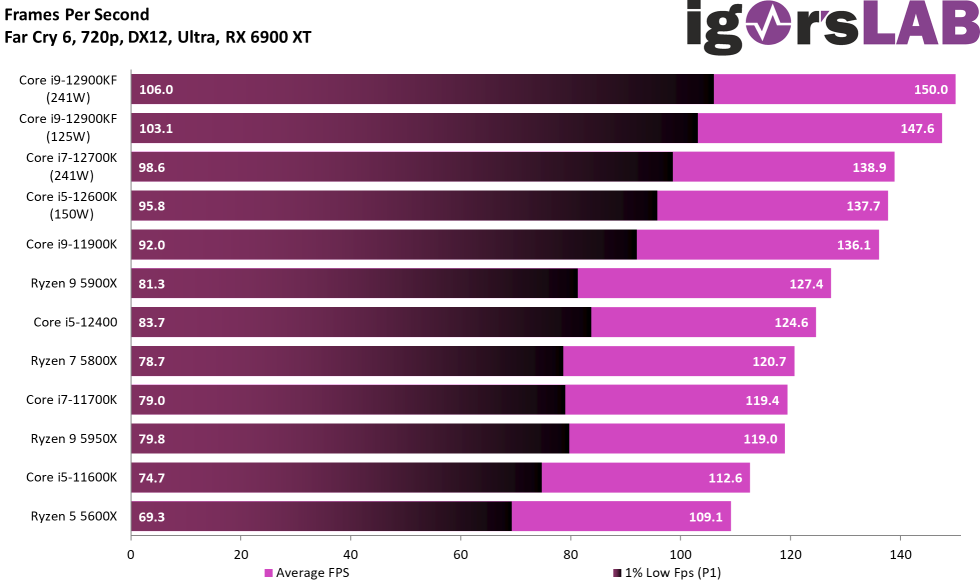
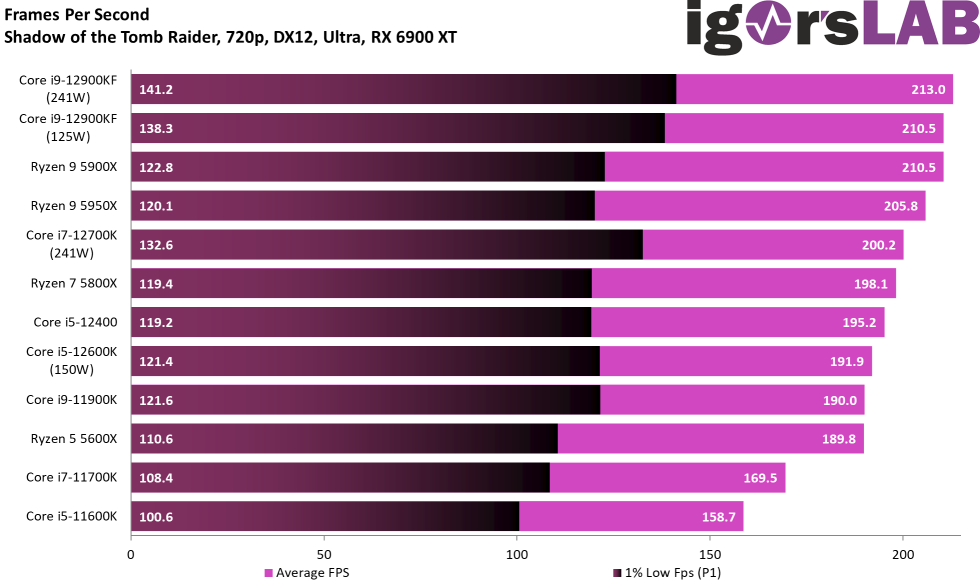
First of all, all games as FPS bars, with Intel CPUs mostly leading the way on the P1.
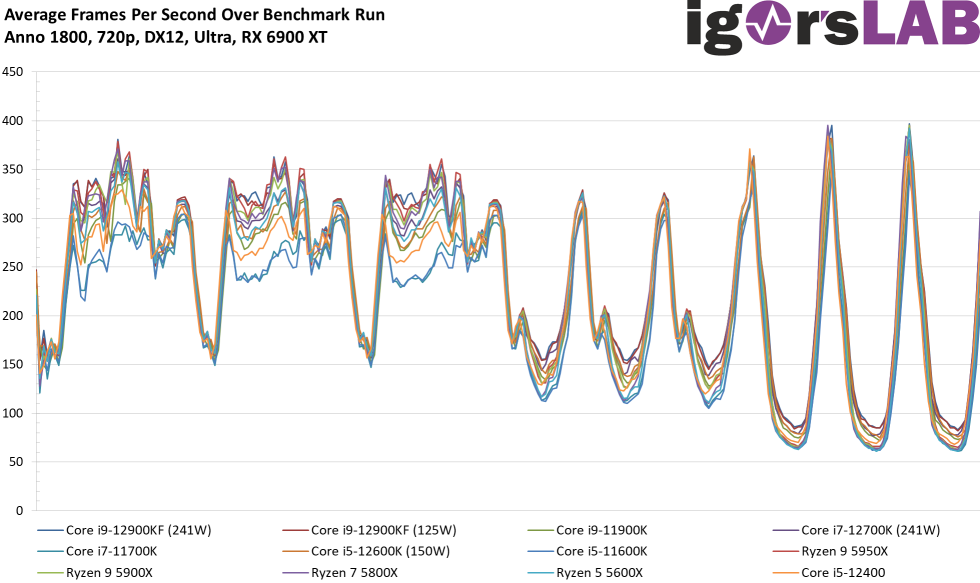
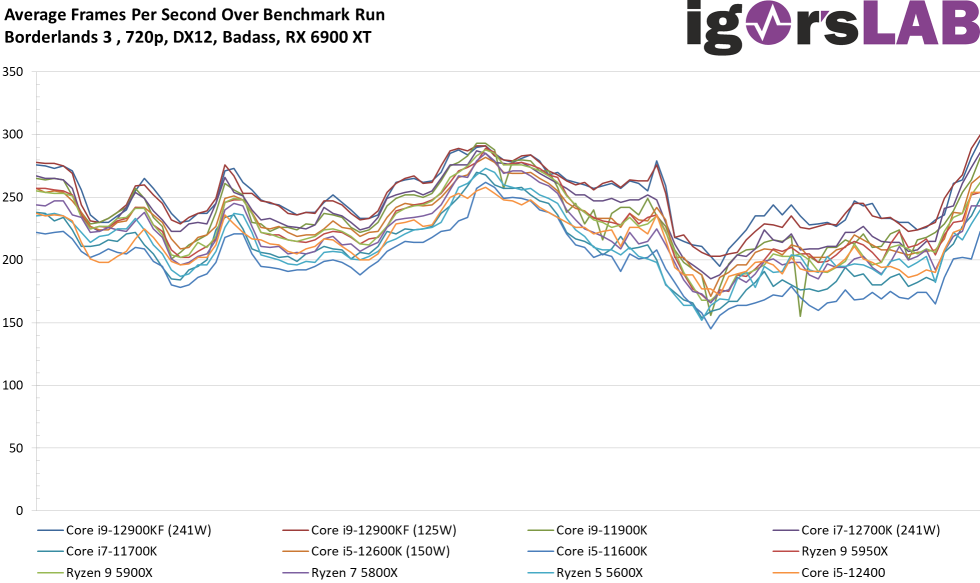
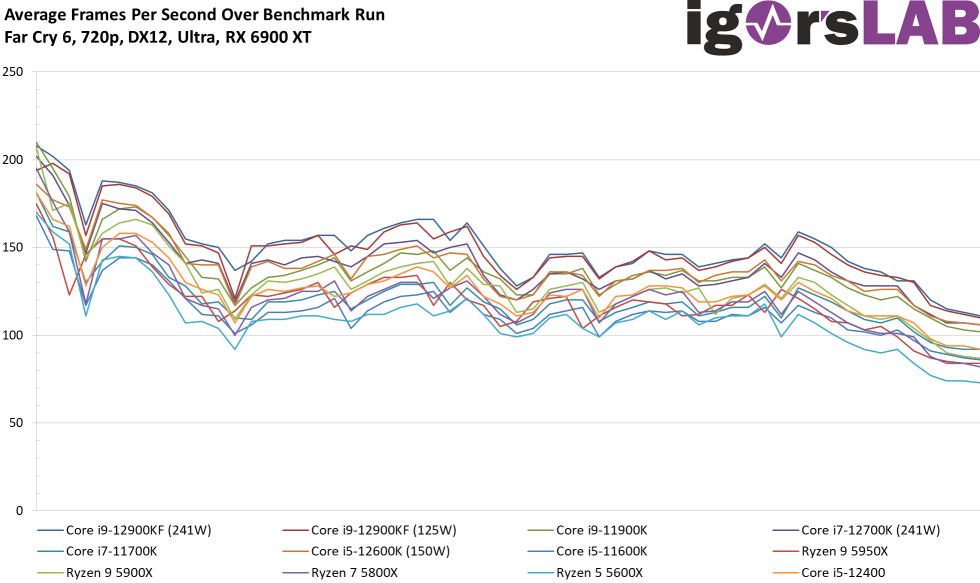
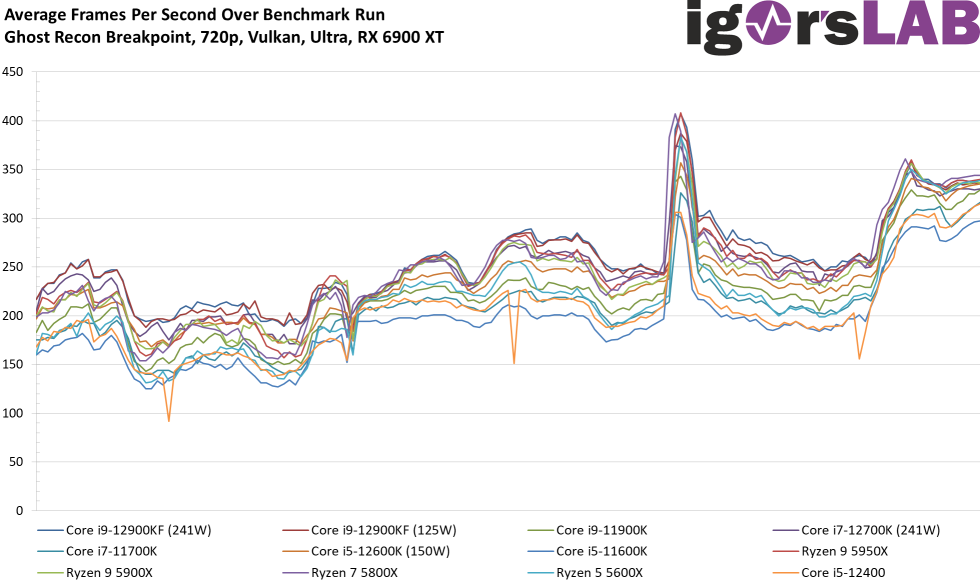
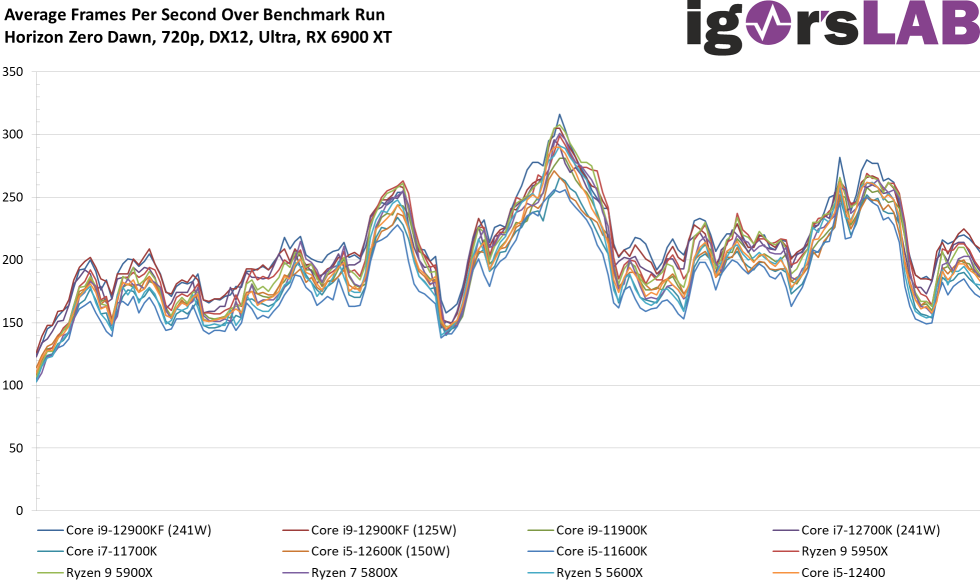
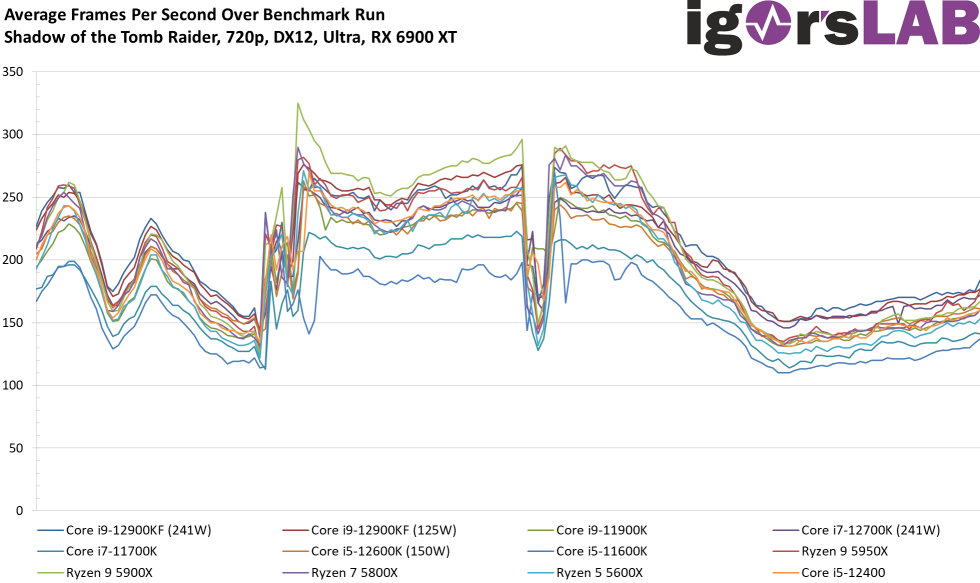
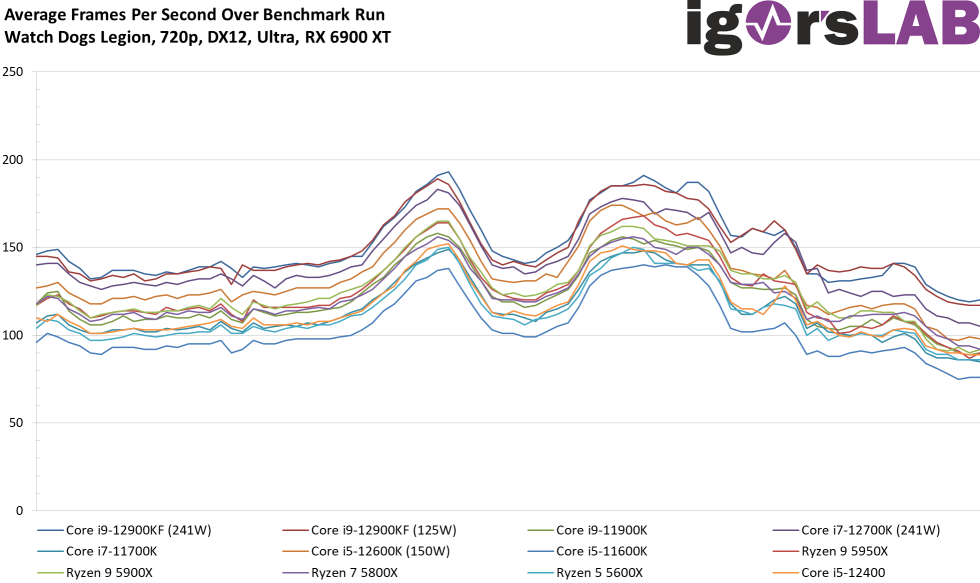
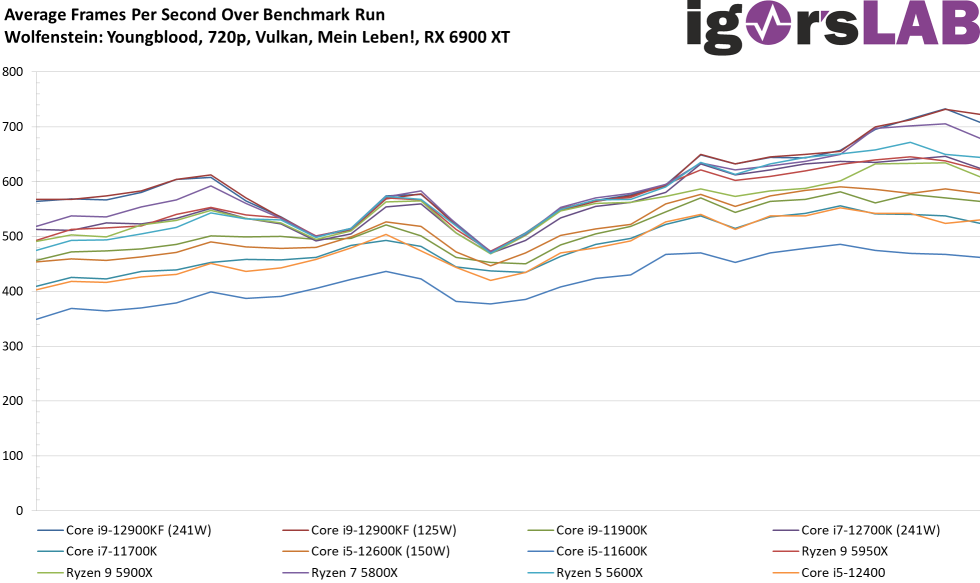
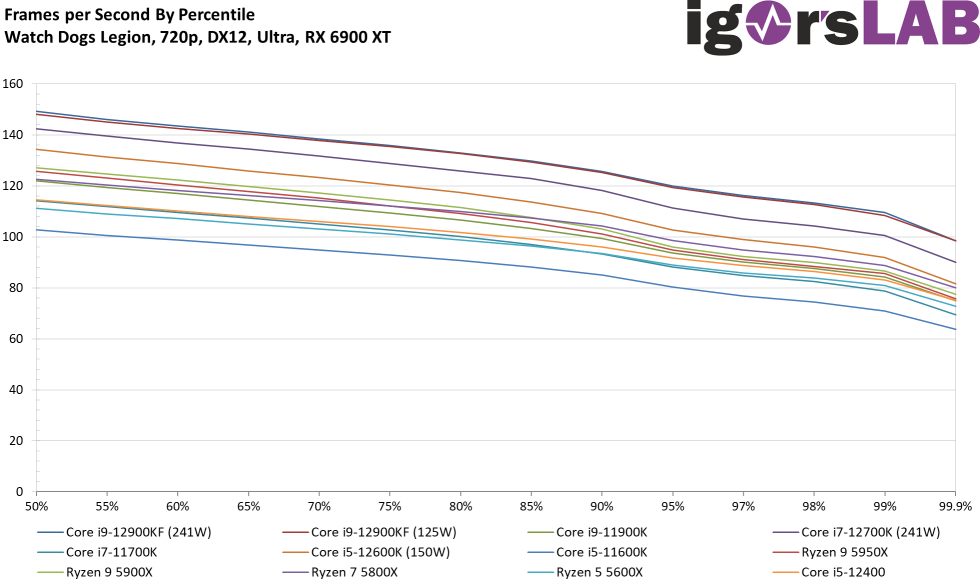
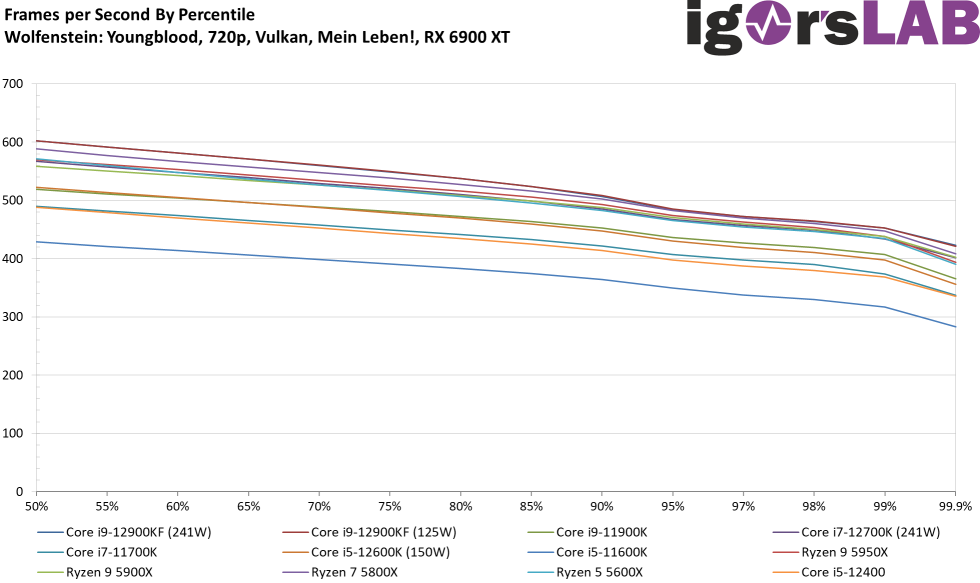
The whole thing now again as a curve with the well visible load distribution over the whole run:
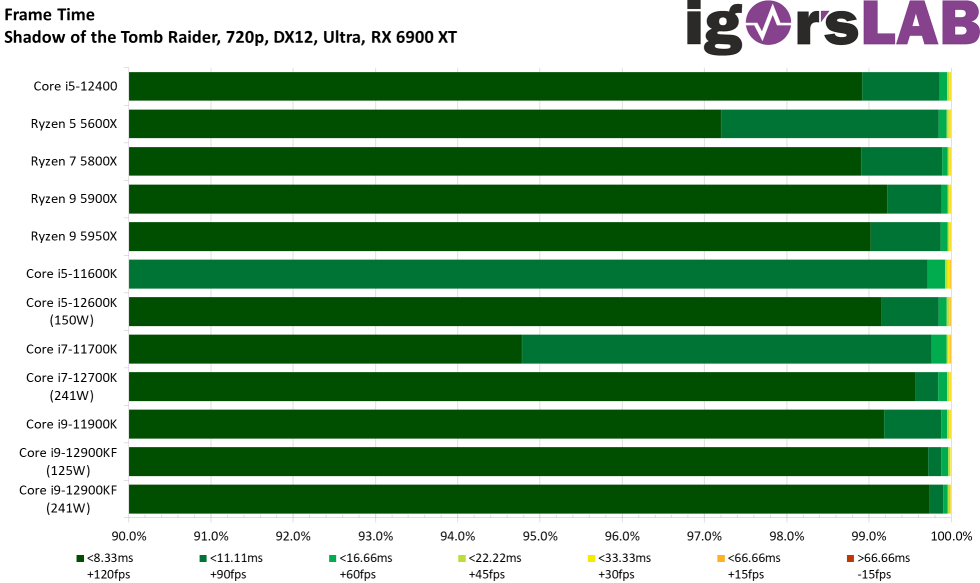
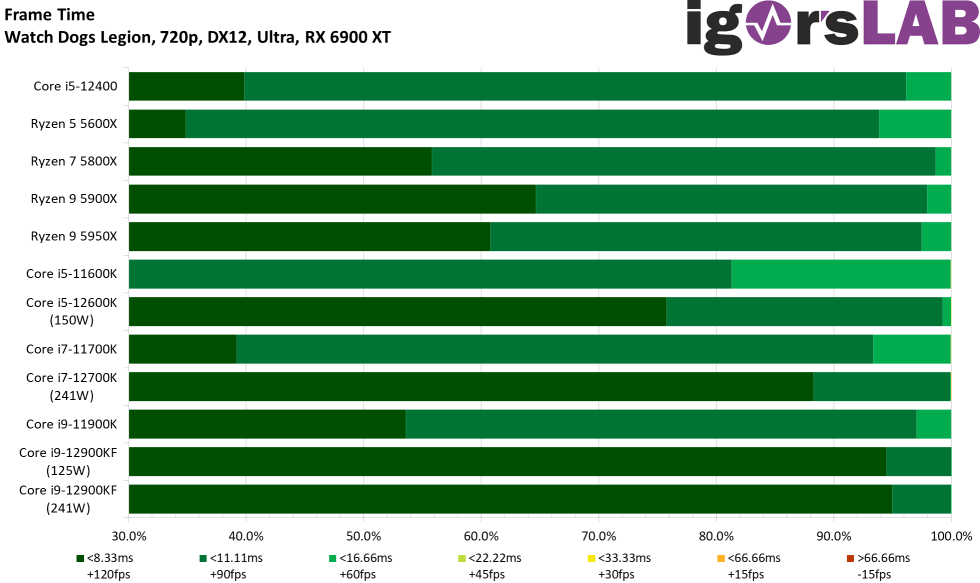
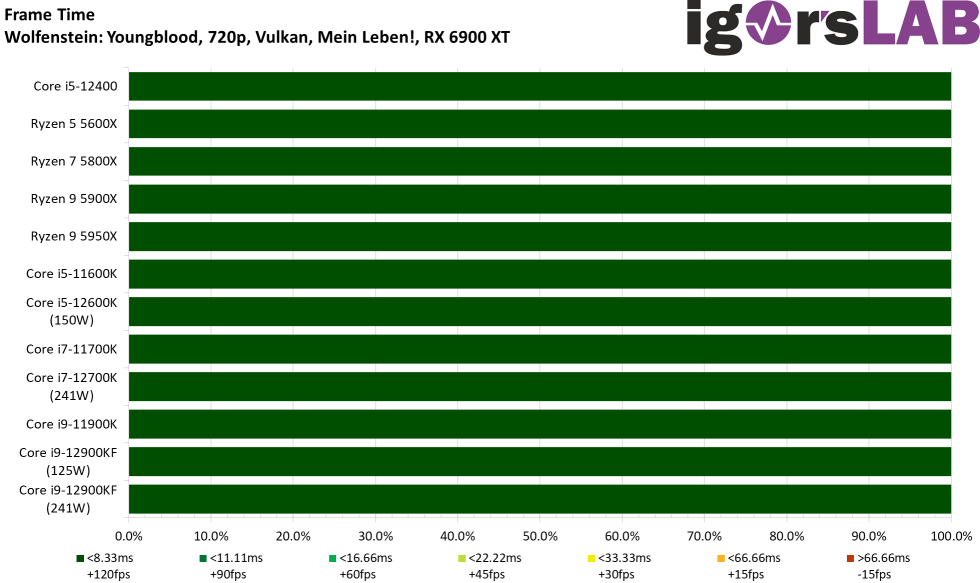
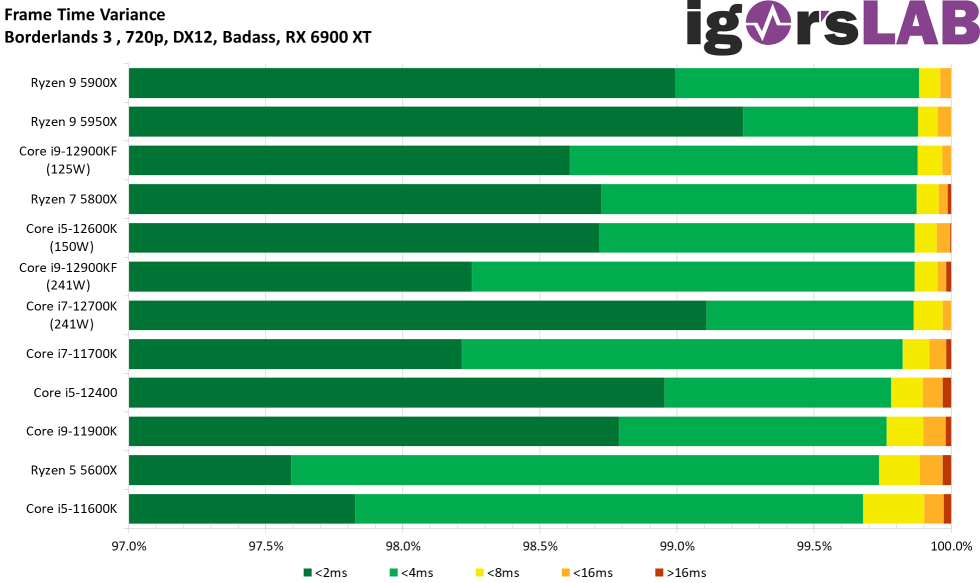
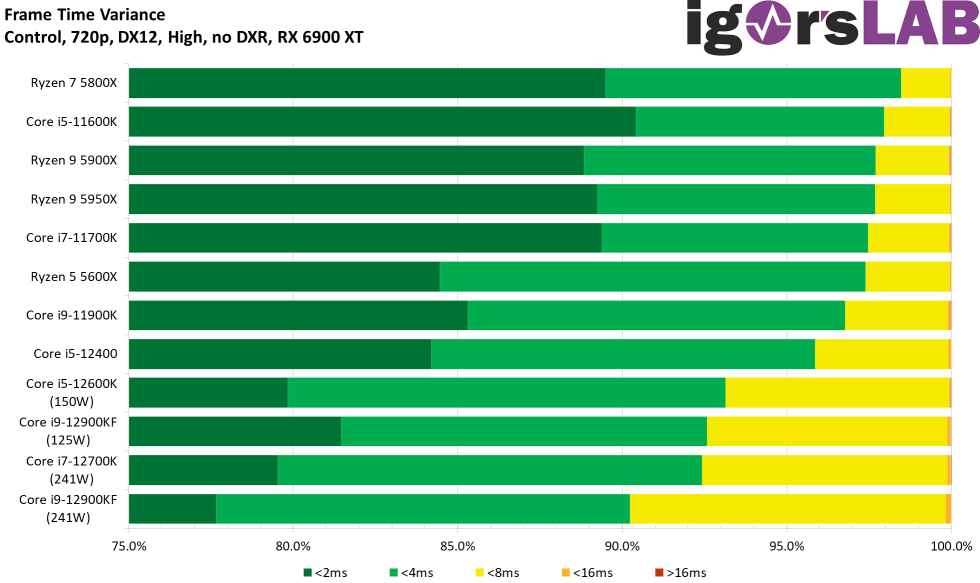
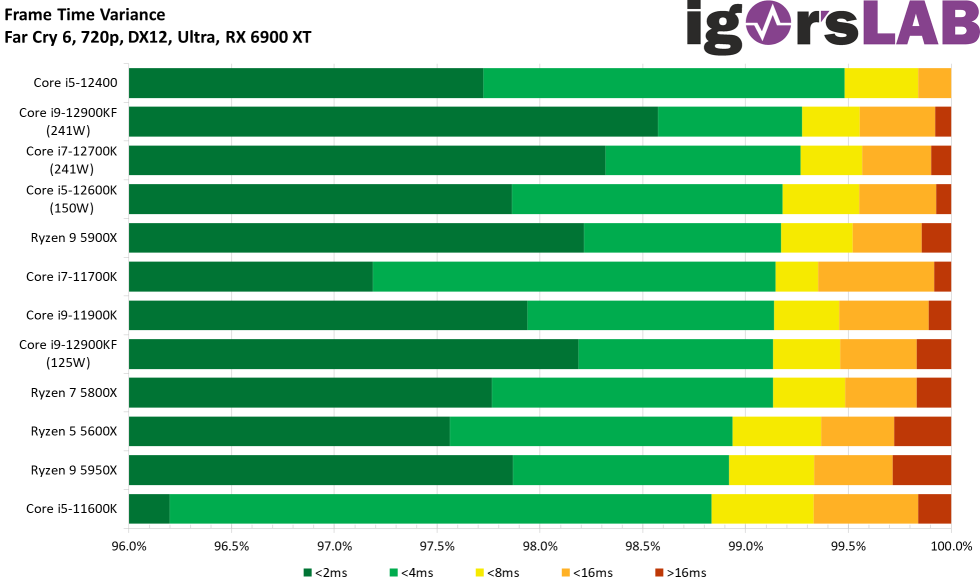
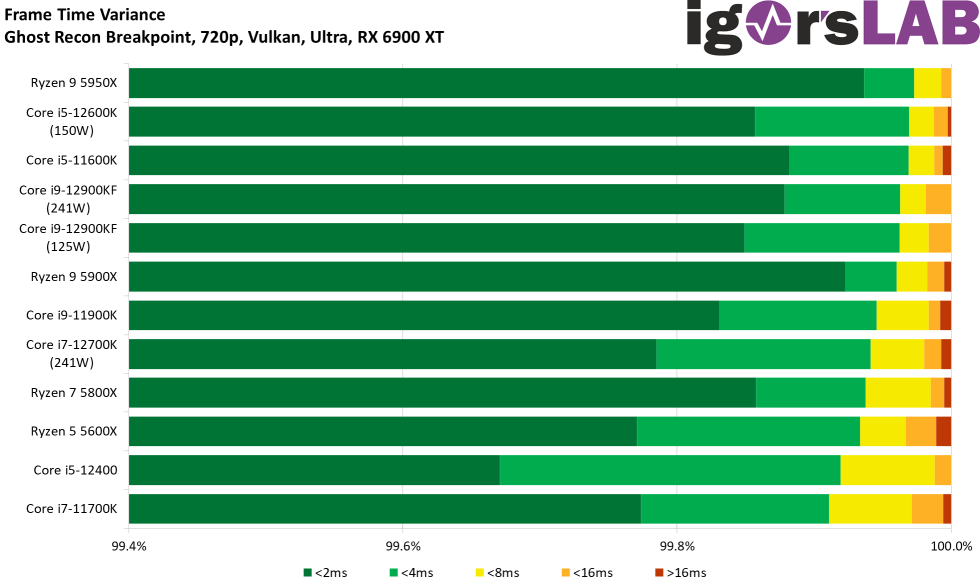
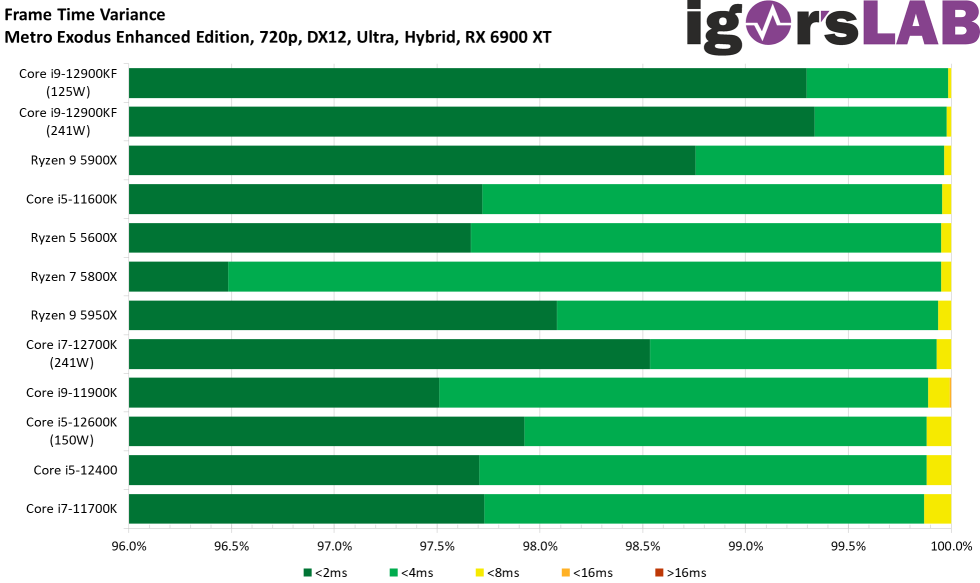
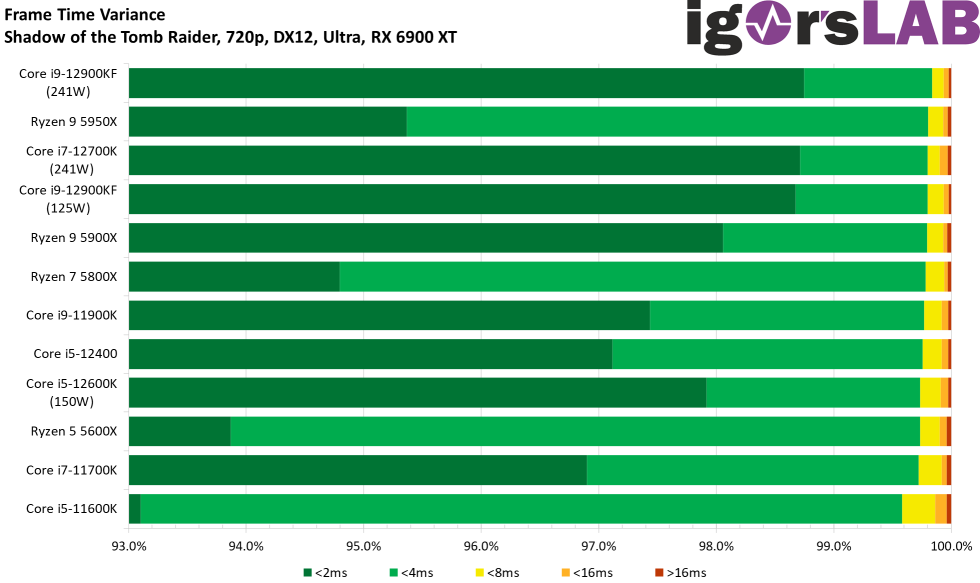
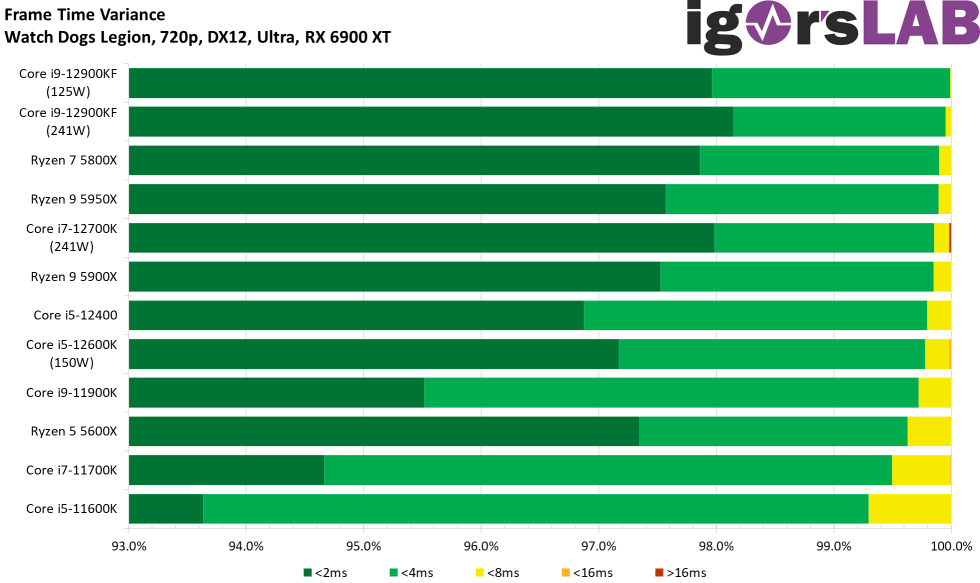
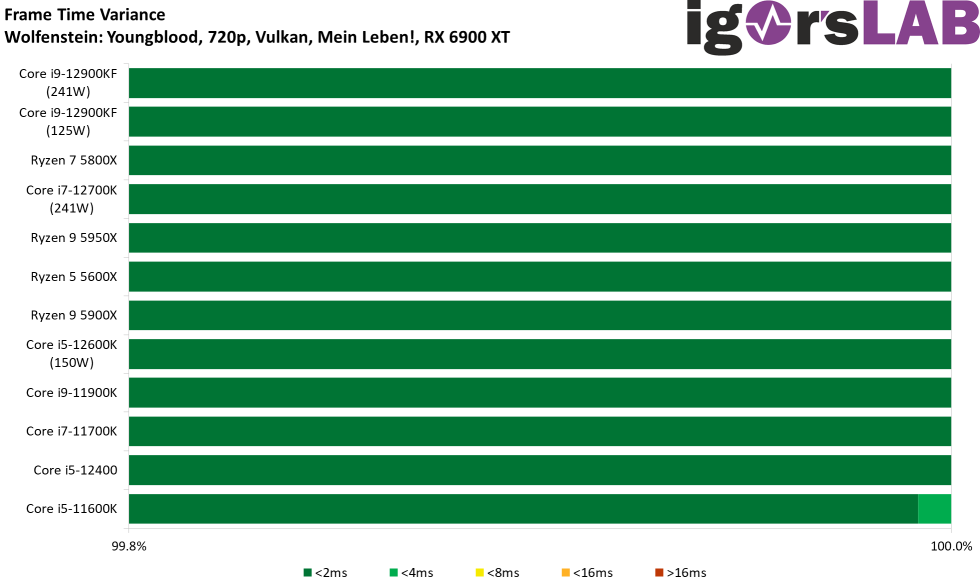
Which brings us back to percentiles. And that’s where you’re actually interested not only in the P1 (1% low), but actually the whole rest of the process. From 97% upwards there is a kink, which is usually only seen from P1 (99%):
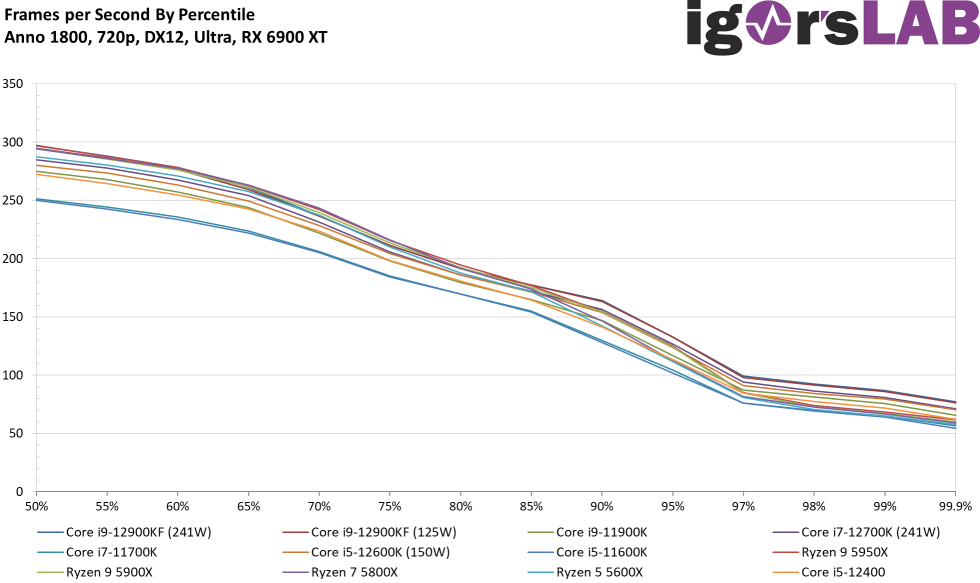
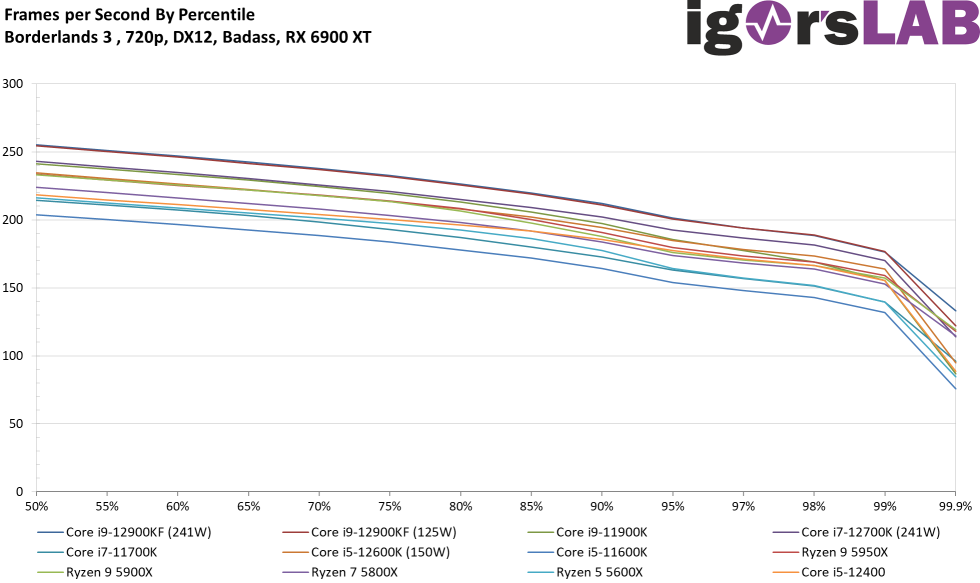
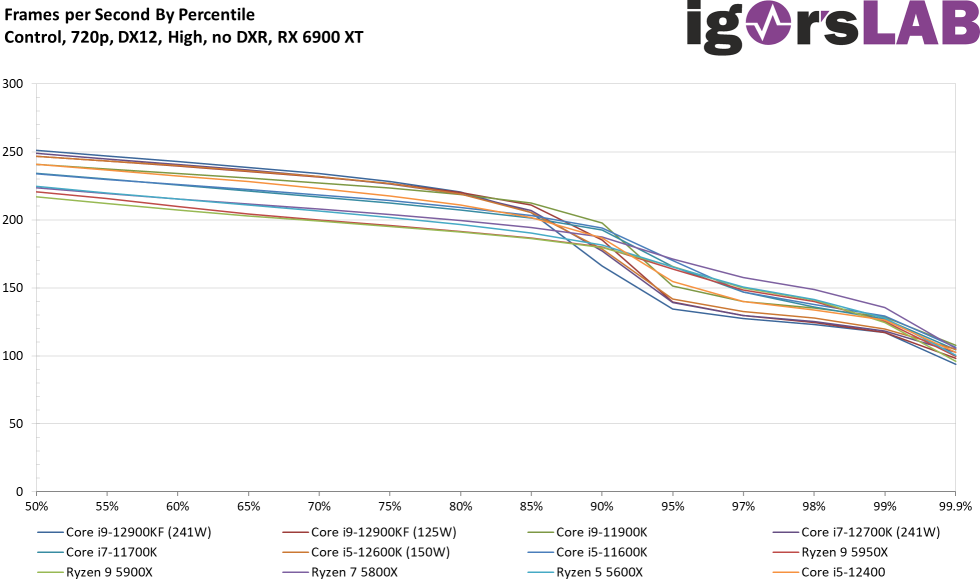
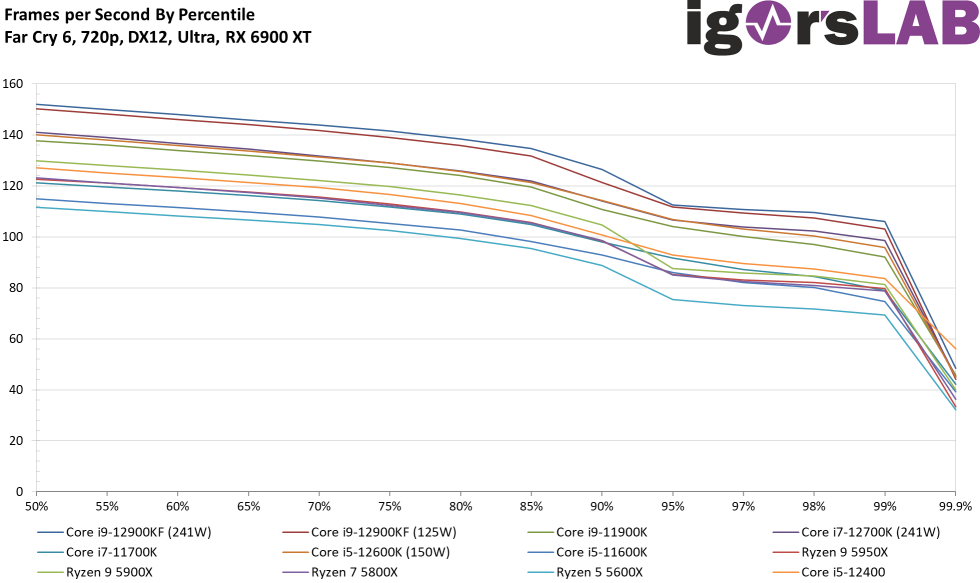
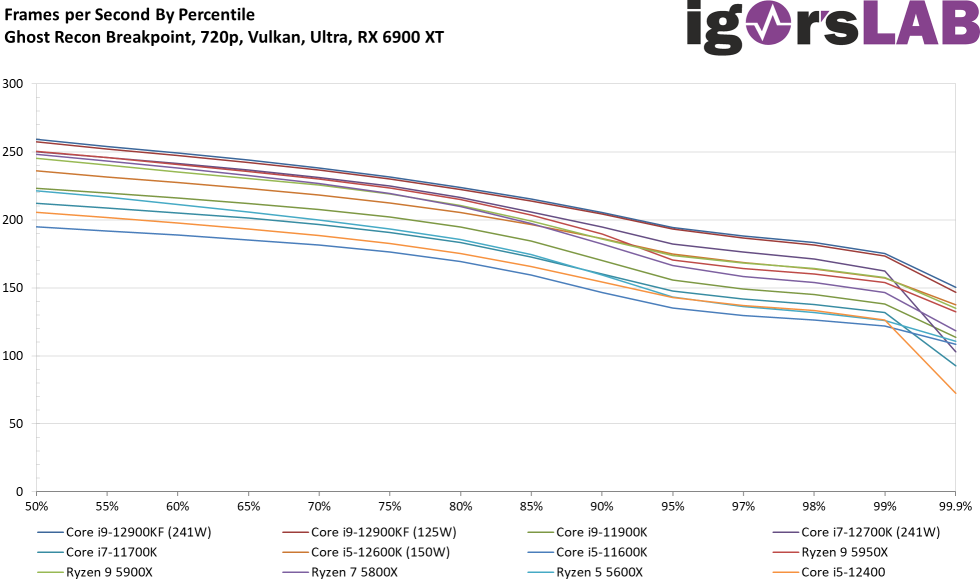
The frame times as such are good with all CPUs, no question, you don’t see big differences, it’s always far above the advertised 90%.
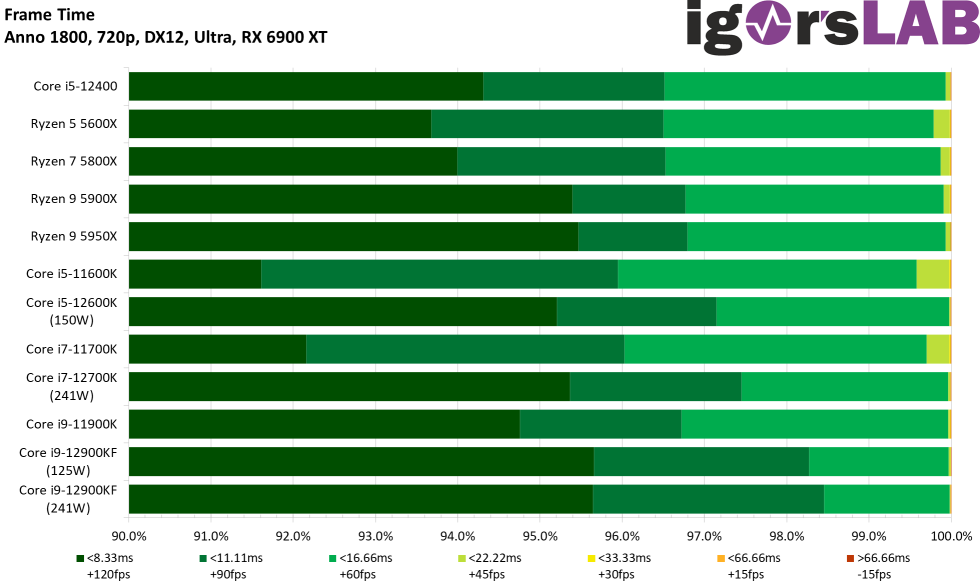
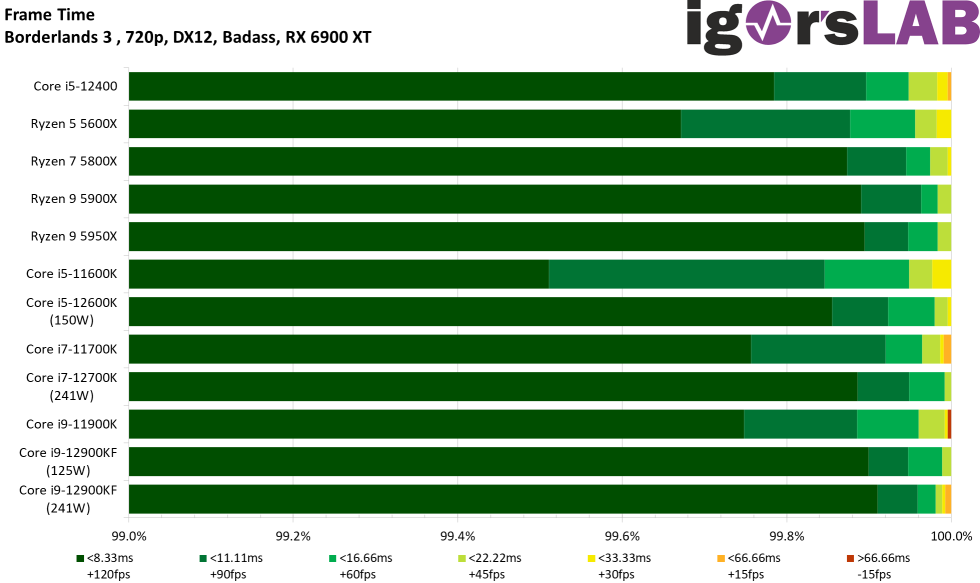
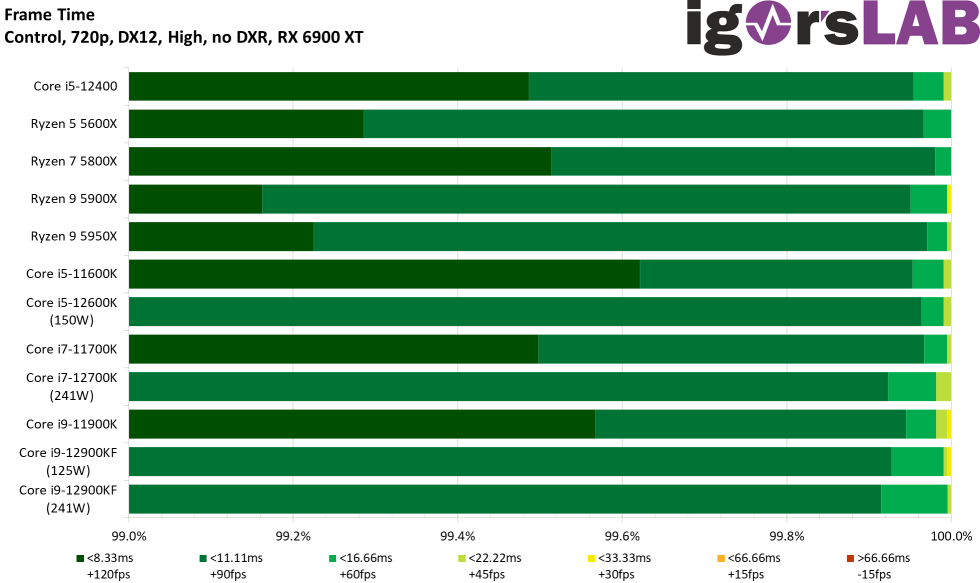
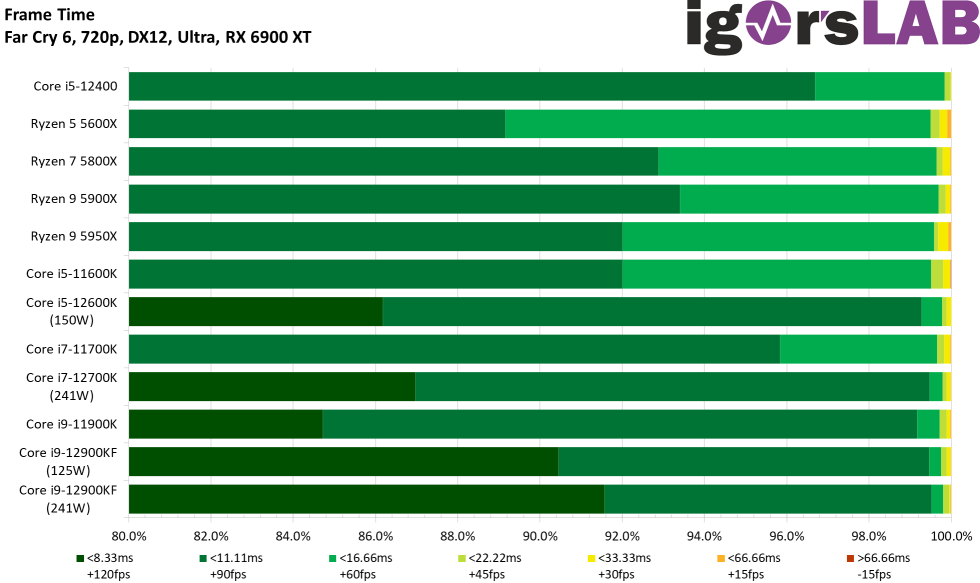

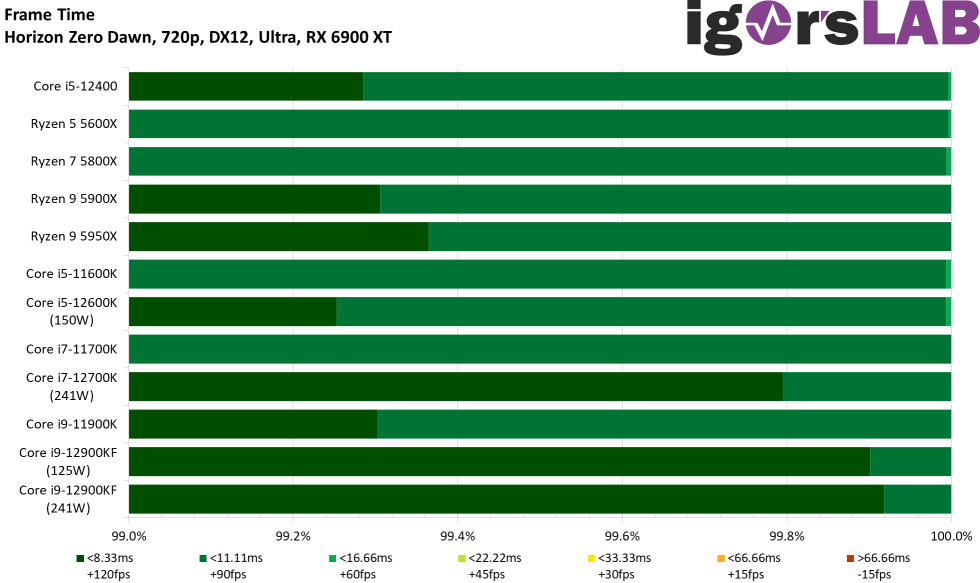
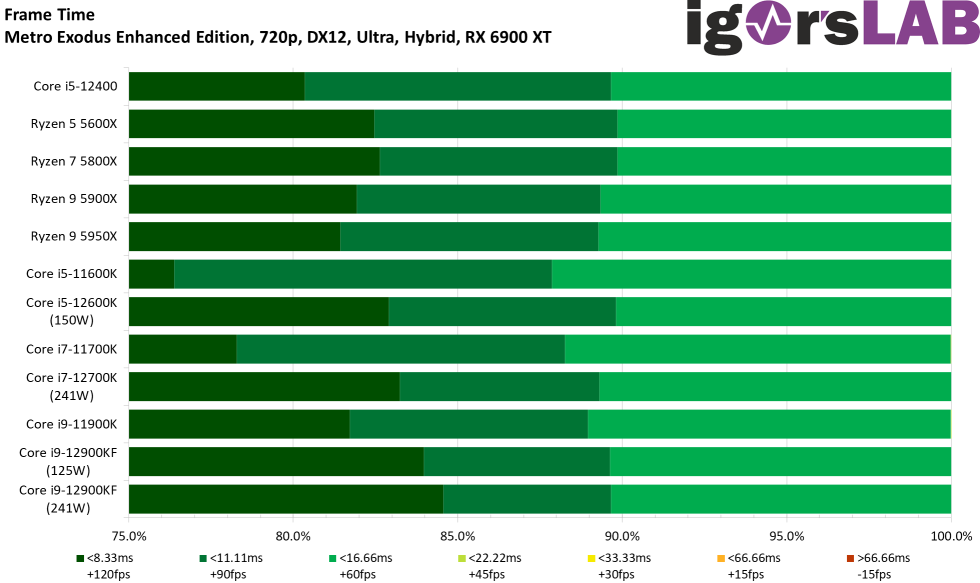
Far more interesting, however, are the so-called variances, which also allow a good evaluation of the smoothest possible scrolling.
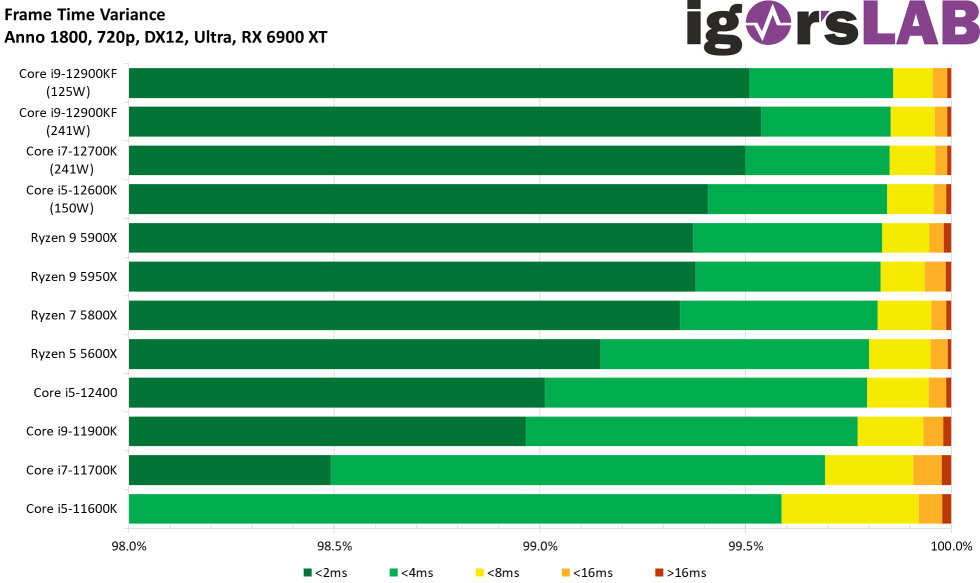

A cumulation of all games and values can be found later in the summary and overview.

- 1 - Introduction, Test System and Methods
- 2 - 720p - Gaming Performance
- 3 - 720p - Power Draw and Efficiency in each Game
- 4 - 1080p - Gaming Performance
- 5 - 1080p - Power Draw and Efficiency in each Game
- 6 - 1440p - Gaming Performance
- 7 - 1440p - Power Draw and Efficiency in each Game
- 8 - Overall Gaming Performance and Comparison
- 9 - Summary of Power Consumption and Efficiency
- 10 - Conclusion and Final Words (for now)


39 Antworten
Kommentar
Lade neue Kommentare
Mitglied
Urgestein
Urgestein
Veteran
1
Urgestein
Urgestein
Urgestein
Veteran
Veteran
Mitglied
Veteran
Mitglied
1
Veteran
Veteran
Mitglied
Urgestein
Veteran
Alle Kommentare lesen unter igor´sLAB Community →