


In dynamic mode, you can use a V/F curve, which brings significant advantages in adapting to your own CPU. Now, I don’t want to discuss this from the point of view of the overclocker who wants to push his system to the maximum, but from the point of view of the normal end user who might not be able to cope with his temperatures. At this point, this also excludes the V/T curves that define the target temperatures. So you could run cooler and still use higher voltages for stable operation. But that would be going too far here. I therefore restrict myself to the modification of the curve already stored by the manufacturer by means of a small offset, which shifts (raises or lowers) the stored voltage by the new value.
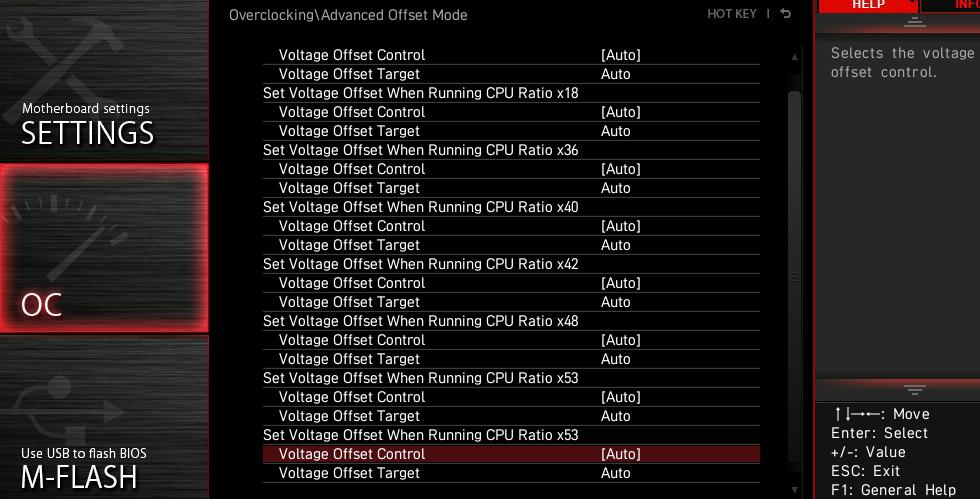
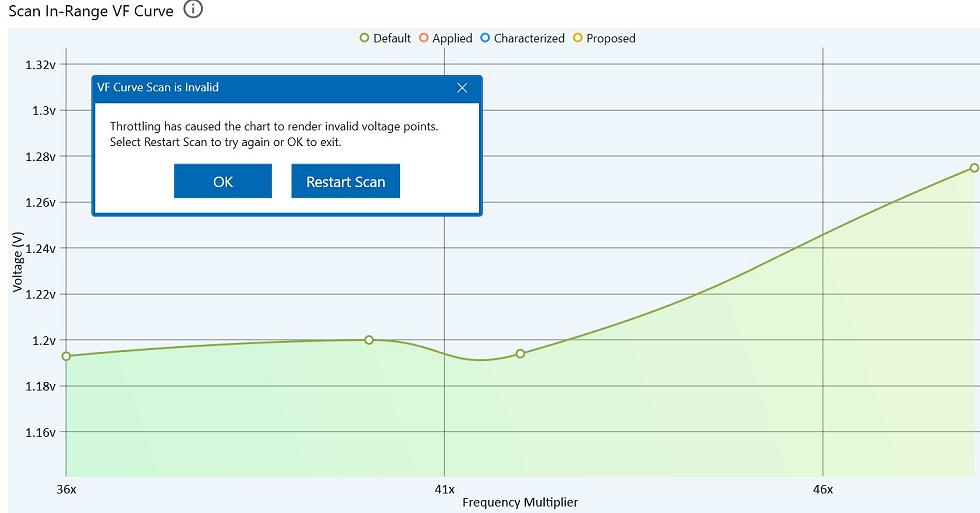
I would generally set the curve in the BIOS and not via Intel’s XTU. What happens when the curve is not optimally designed at the factory can be seen here. XTU will not adopt this curve at all, because they could already detect partial thermal throttling. Whether XTU is making a mistake or MSI has optimized the curve incorrectly cannot be said, because all stability tests ran without problems and throttling.
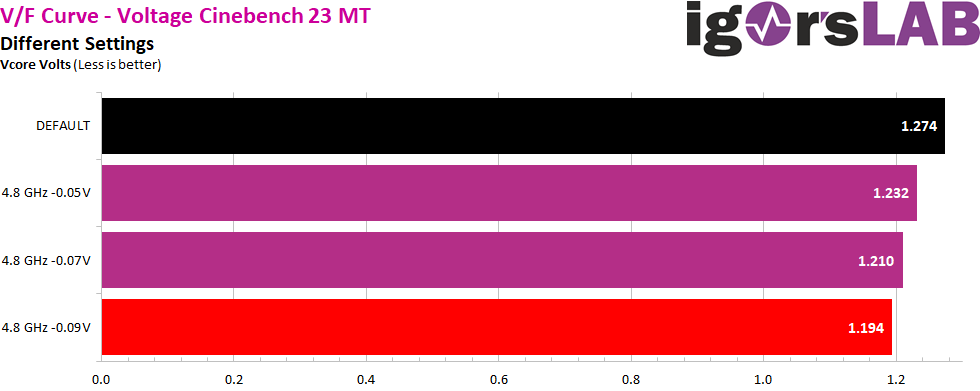
The following changes show what can be achieved by slightly modifying the most important point. The performance losses are significantly lower than when adjusting the AC/DC loadline, although similar effects could be achieved there via lower values for AC, as long as the LLC would also be adjusted. But this is going a bit too far and also bears dangers for inexperienced users by overvolting the CPU. The following values, on the other hand, are quickly adjusted and tested. I used the 4.8 GHz mark as an example, because many games and the Cinebench are also affected here. Then you also get a much cooler, but not slower system. Only you must not overdo it because otherwise the CPU becomes unstable (last run, red bar).
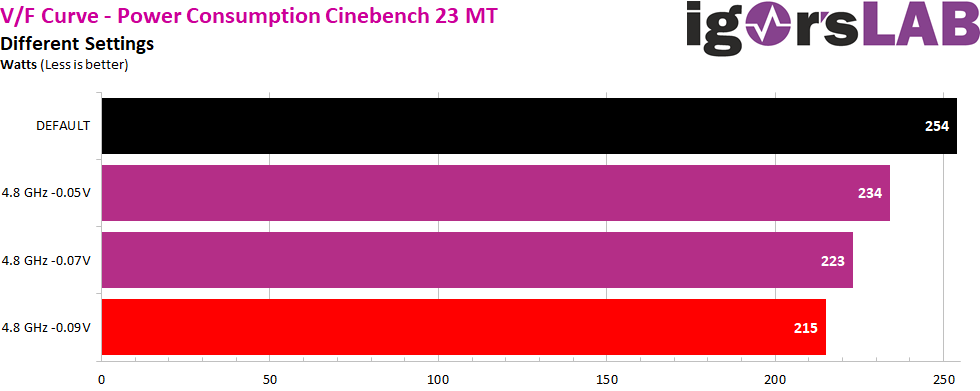
The influence on the tempetaures is analogous to that of the power consumption reduction at the AC/DC load line and in part already significant. After all, you save 11 degrees by adjusting this part of the curve.

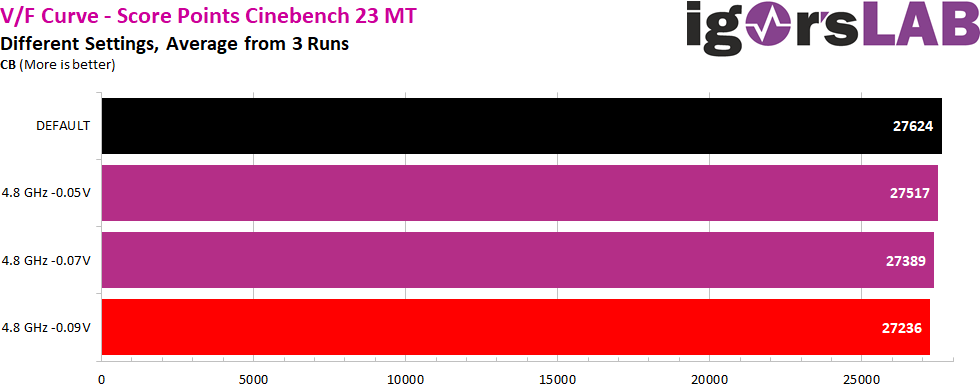
The CB scores hardly differ from each other, which shows the clear advantage over the AC/DL loadline.
We can now also see the actual influence on the core voltage and the possibilities that one has depending on the CPU quality.
Of course, with ideally matched V/F curves over the entire range and a narrow VT curve, one could achieve even more, but that will certainly be material for another article. Today it was only about the too high values for temperature and power consumption. This is exactly what we were able to elegantly eliminate and also learned quite a bit about the reasons. Of course, a simplification also has the disadvantage that elementary details (have to) fall by the wayside, but for the beginner it at least remains better comprehensible. You can certainly live with this compromise for now.
I’m done with that for now, but I’m also sure that we can explore this topic a little more. Let’s give Xaver some space for the RAM tests first and then think about how we can maybe create an undervolting and overclocking guide with the help of our readers as well, which can engage all users and not only the technicians among the readers.


40 Antworten
Kommentar
Lade neue Kommentare
Urgestein
Urgestein
1
Mitglied
Neuling
Urgestein
Veteran
Urgestein
Neuling
Urgestein
Veteran
Urgestein
Veteran
Mitglied
Urgestein
Urgestein
Urgestein
Urgestein
Alle Kommentare lesen unter igor´sLAB Community →