


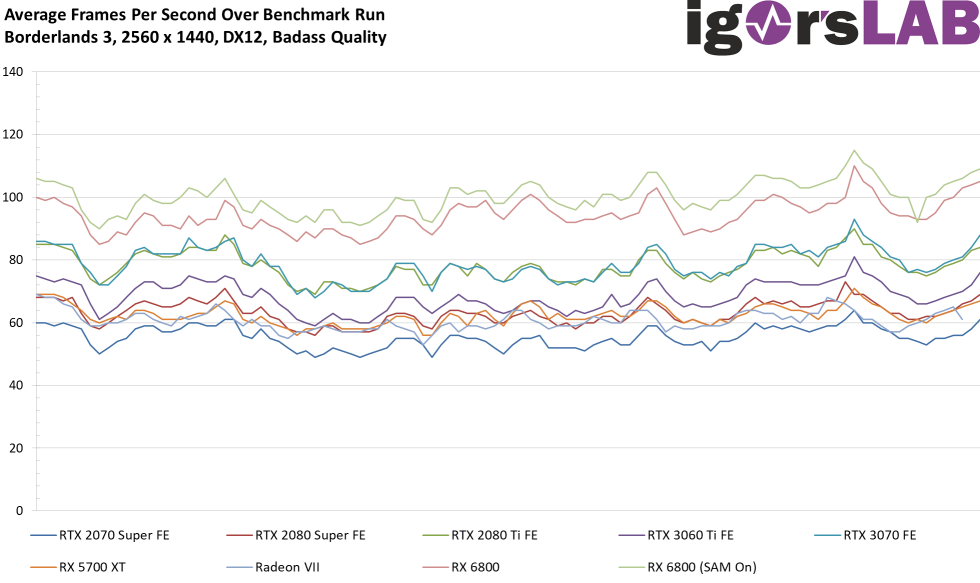
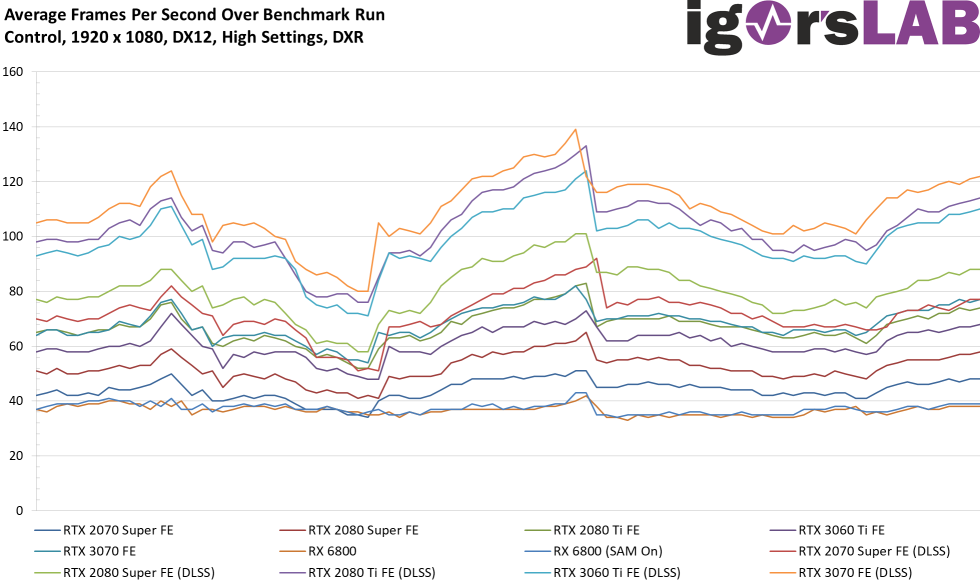
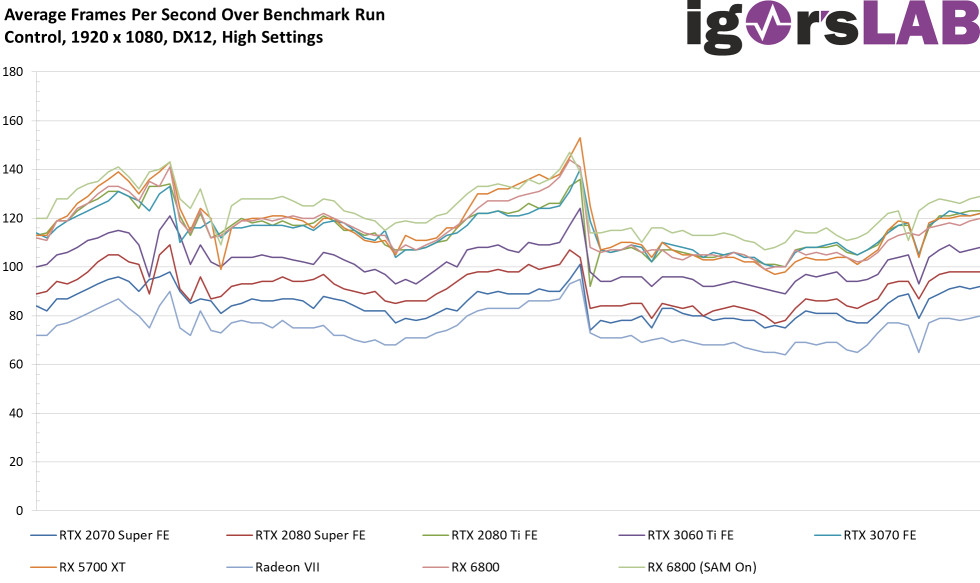
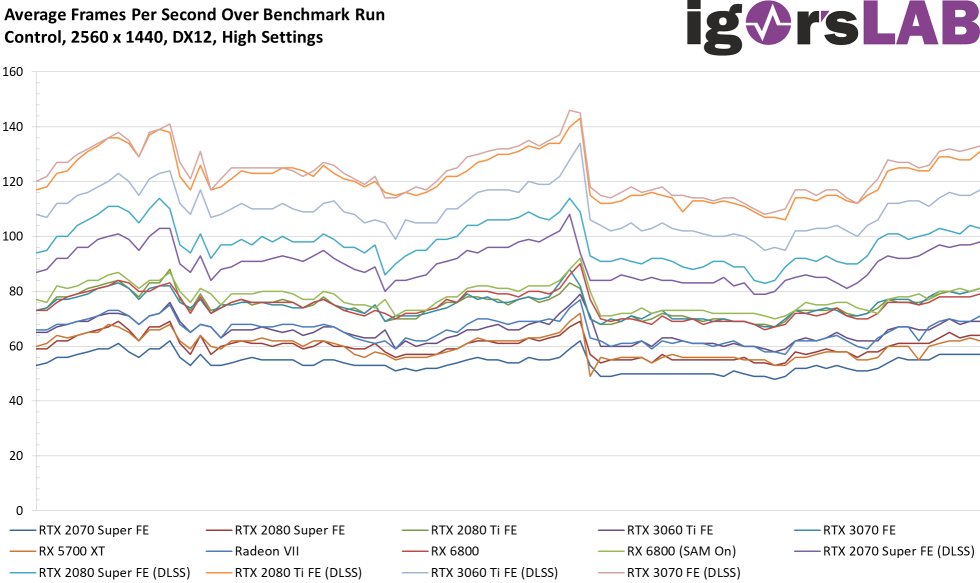
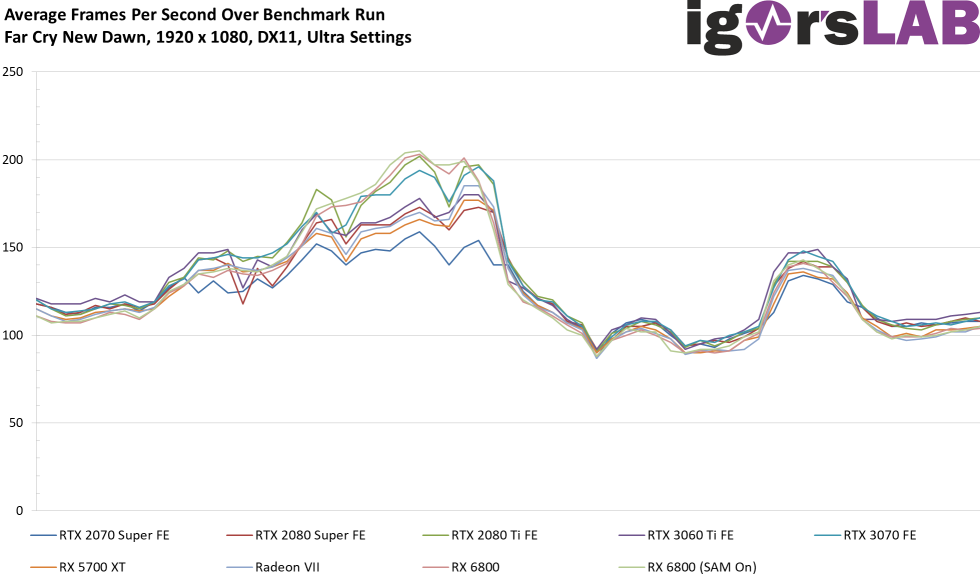
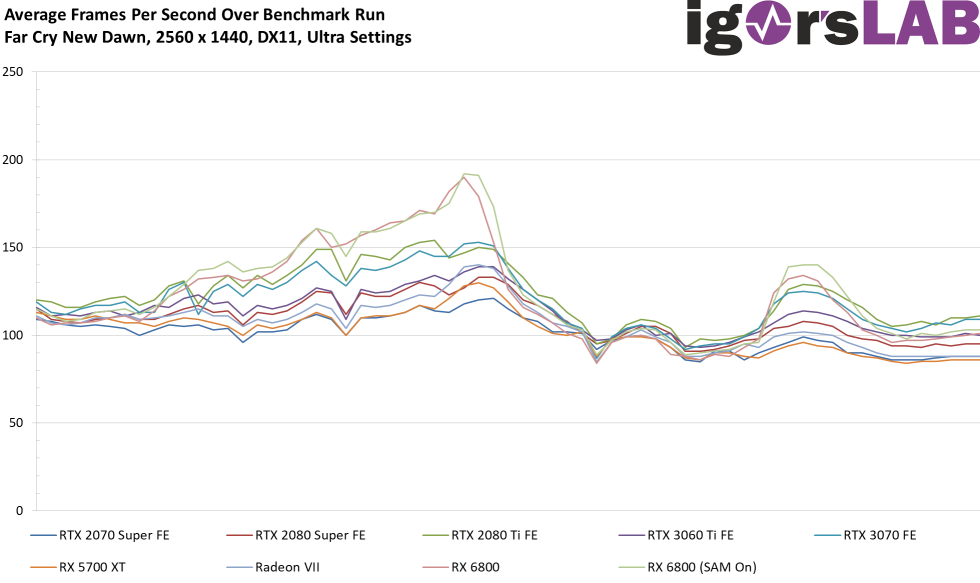
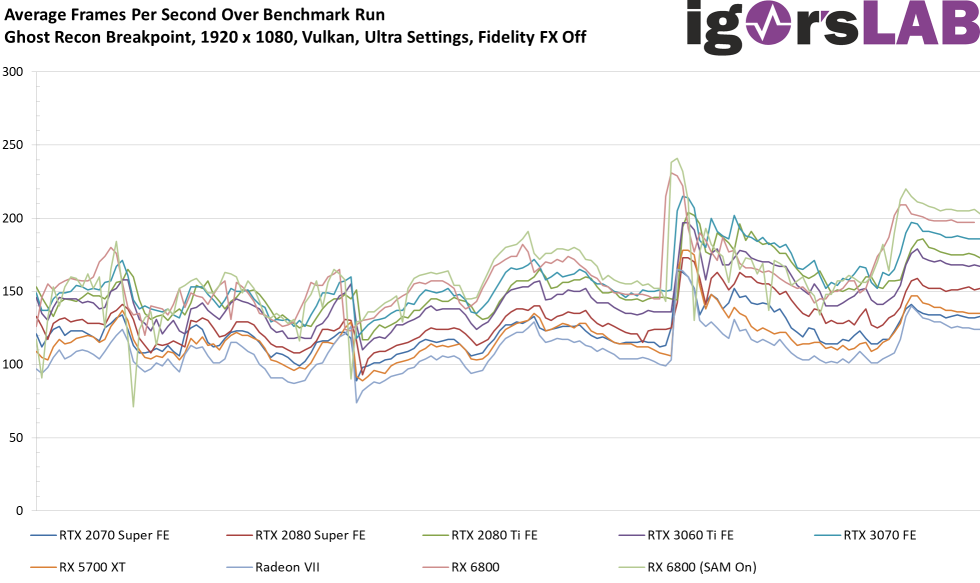
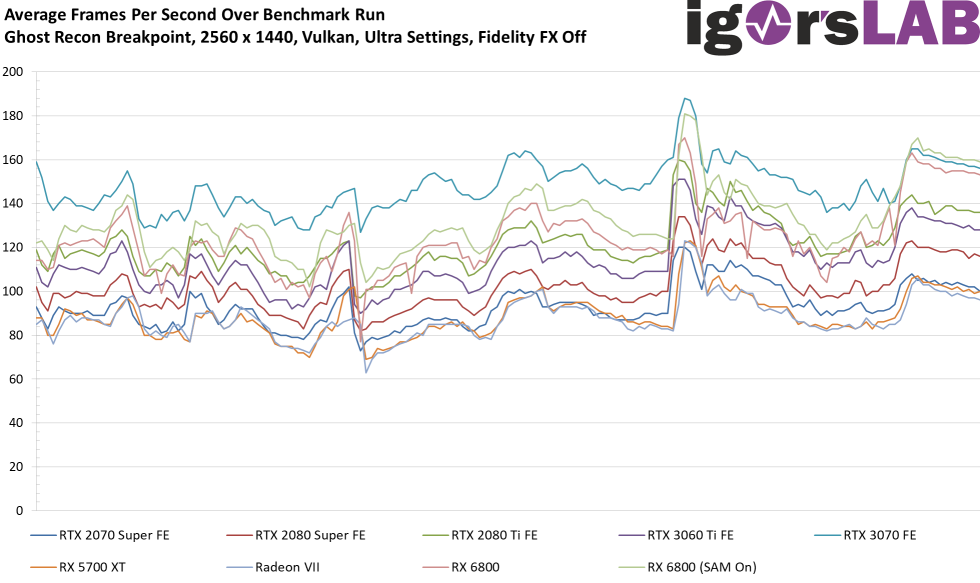
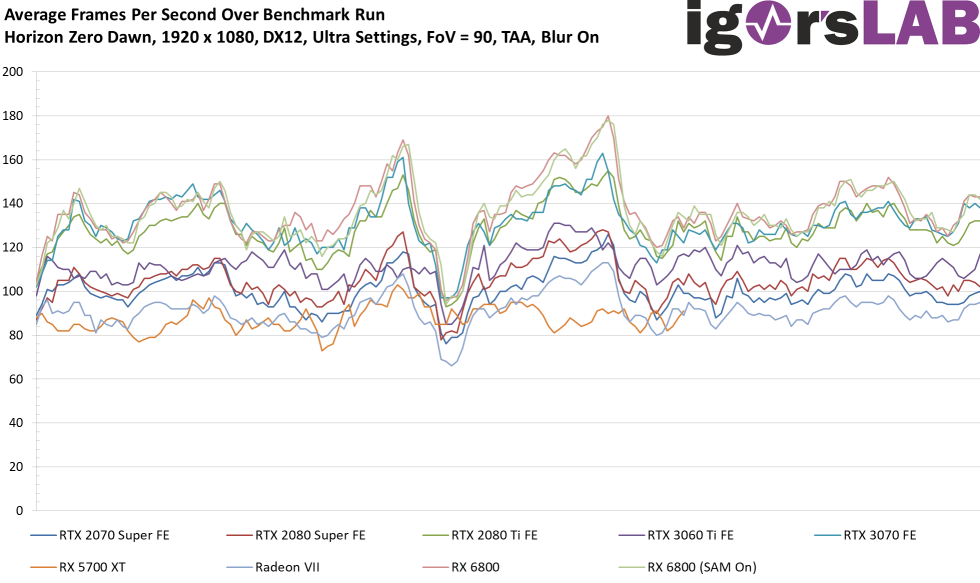
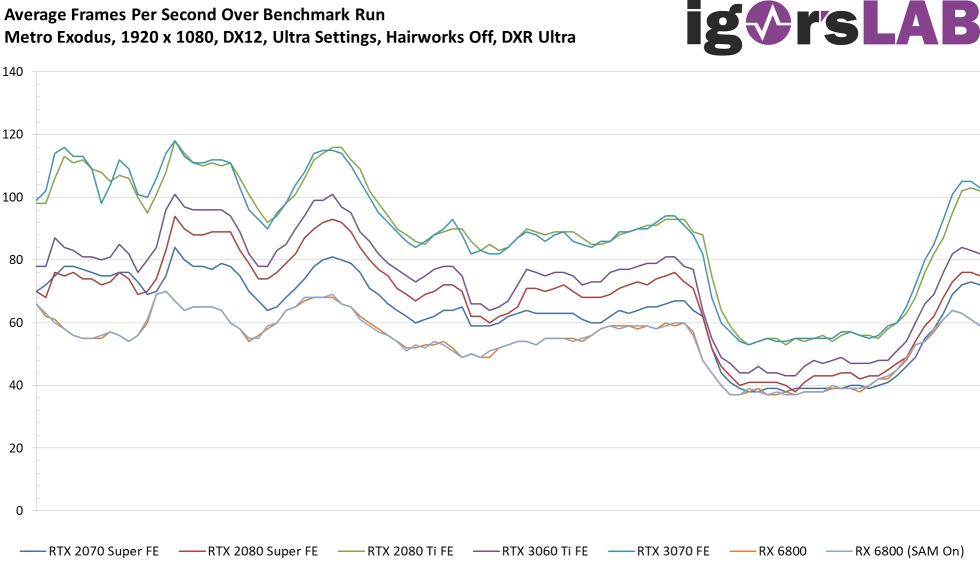
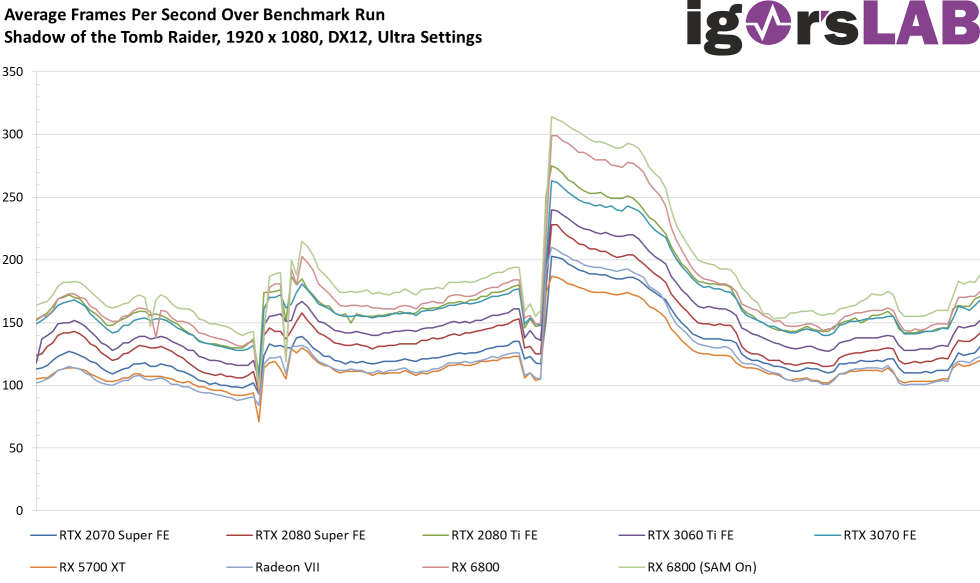
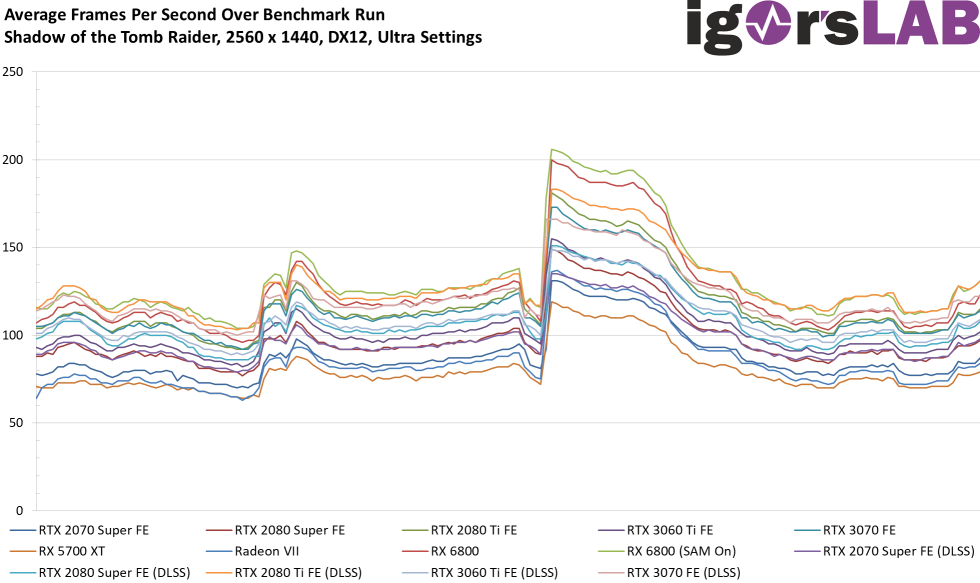
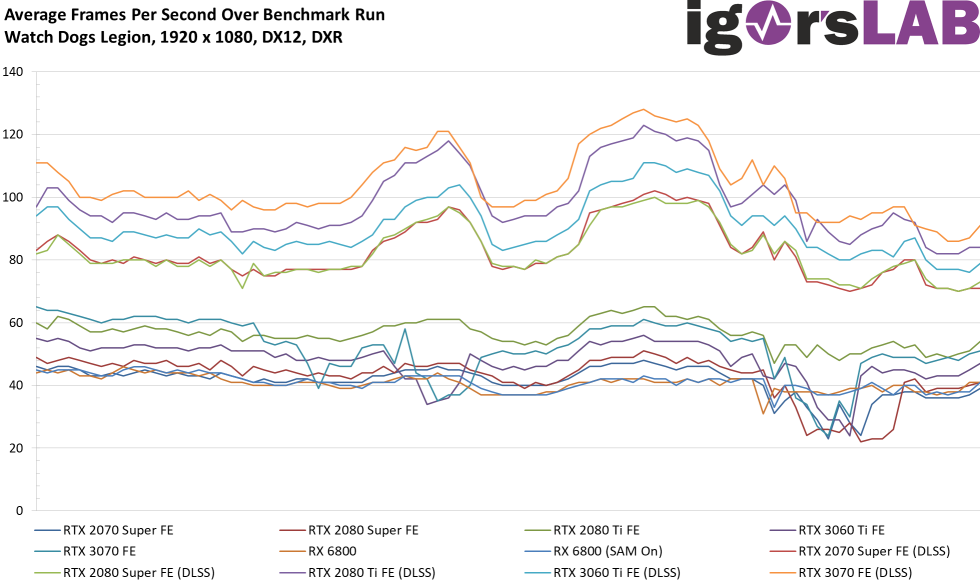
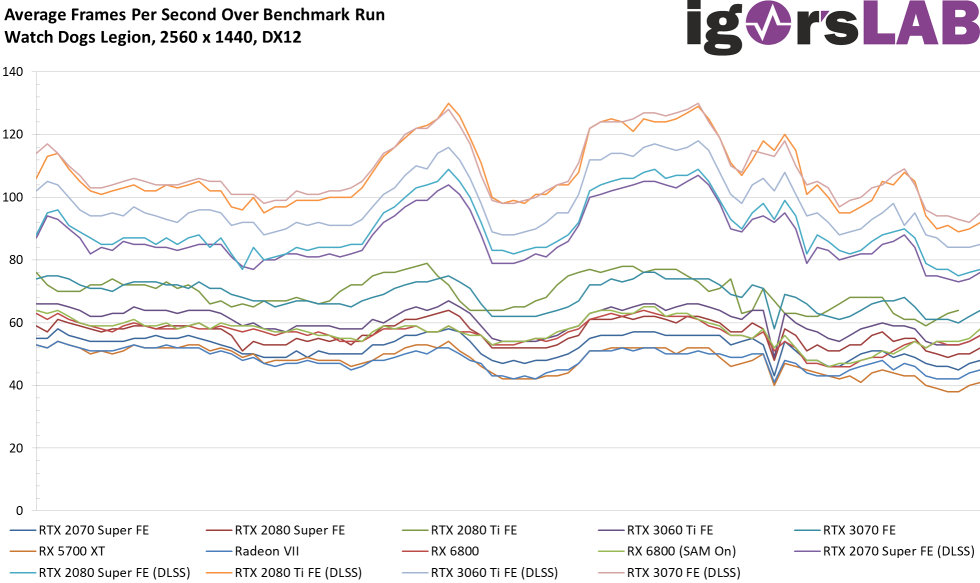
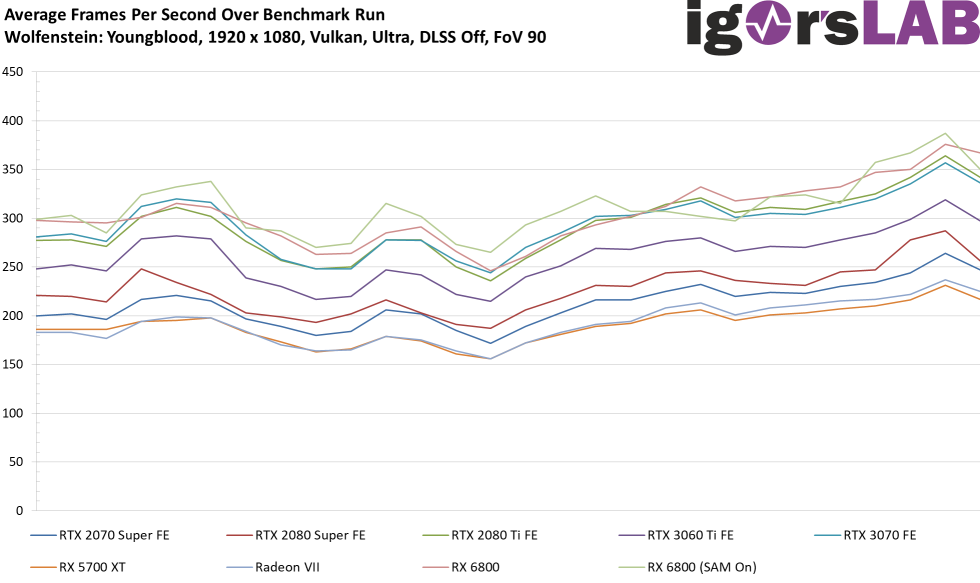
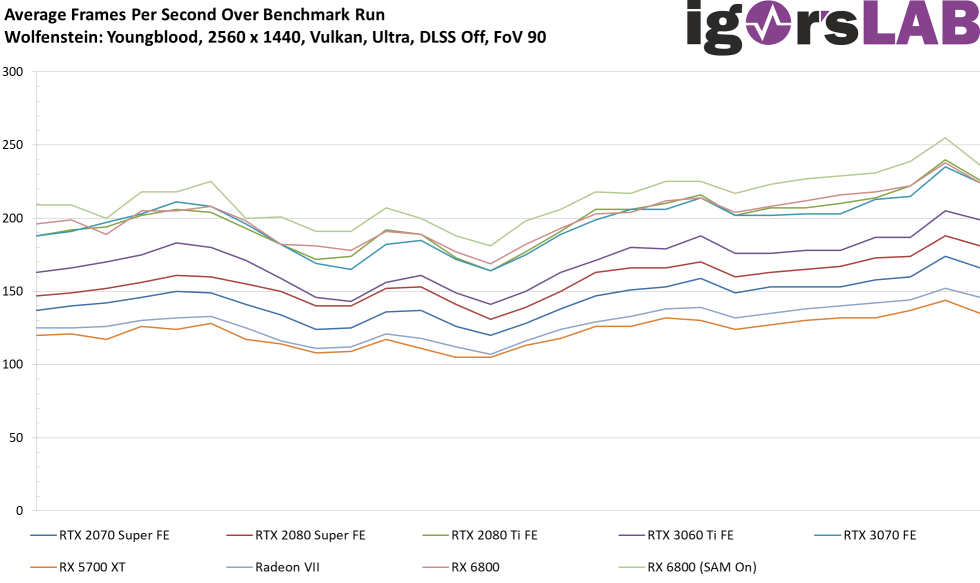
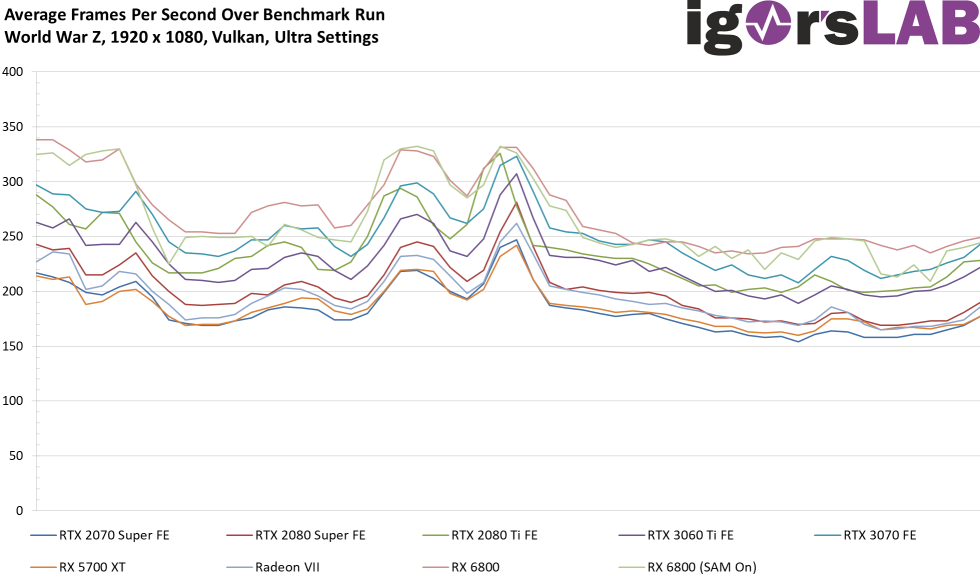
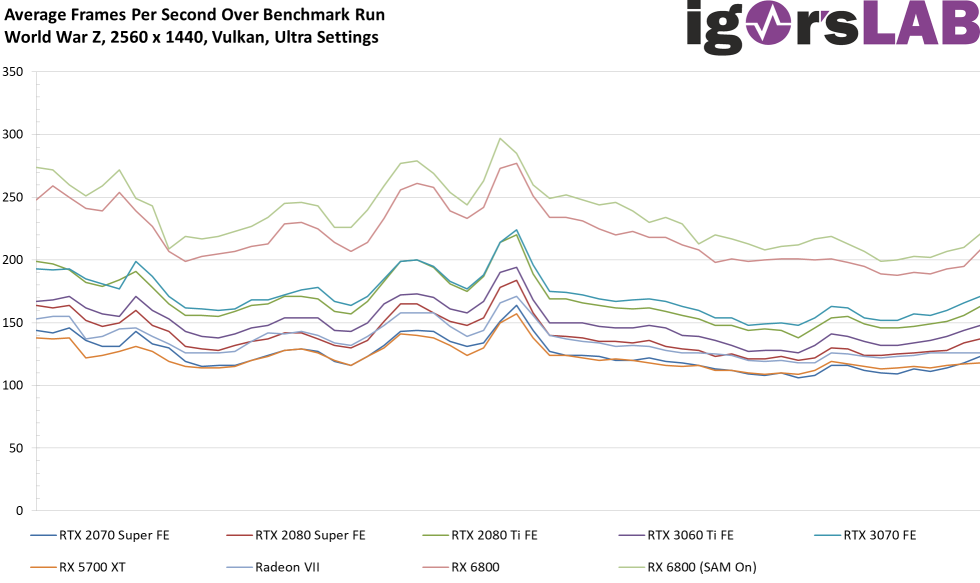
FPS histories of all games and resolutions


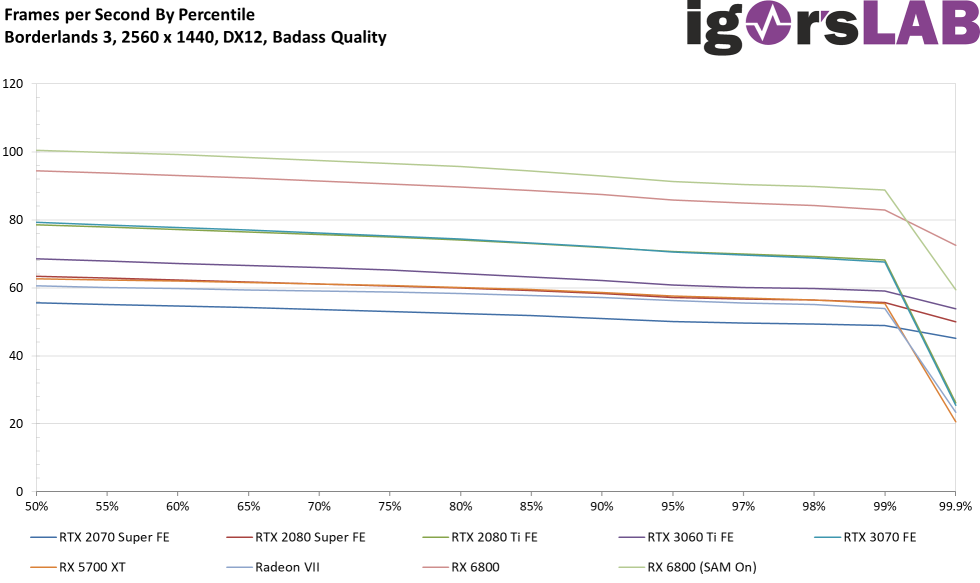
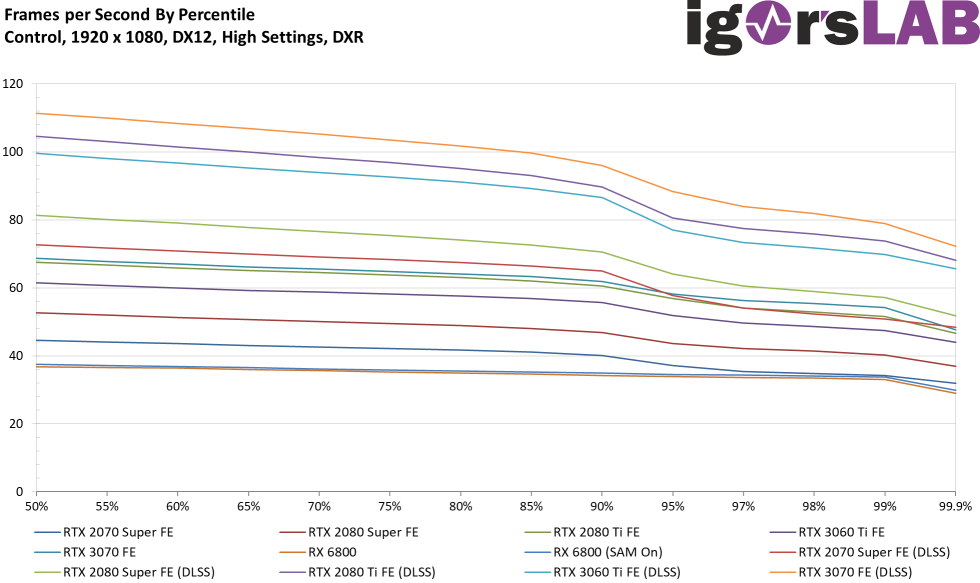
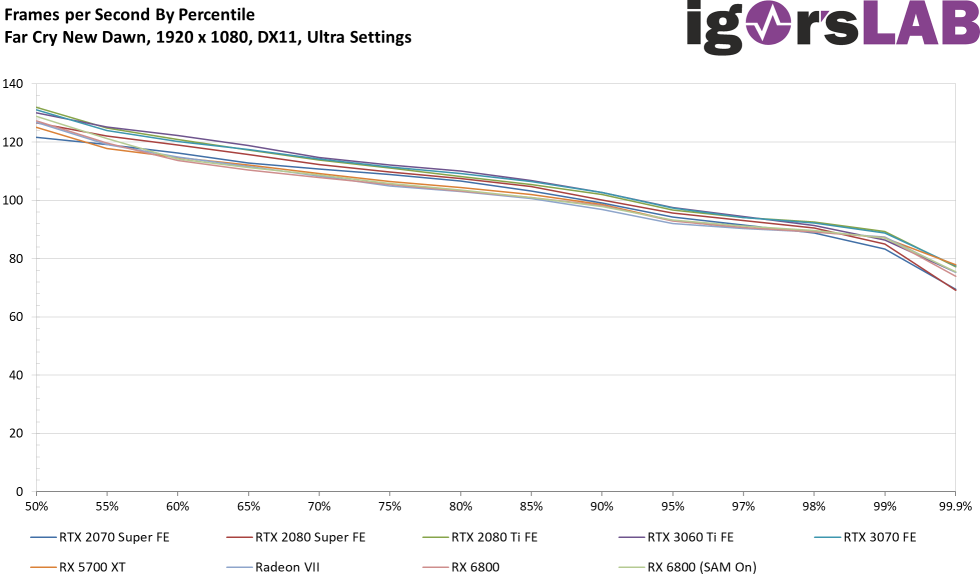
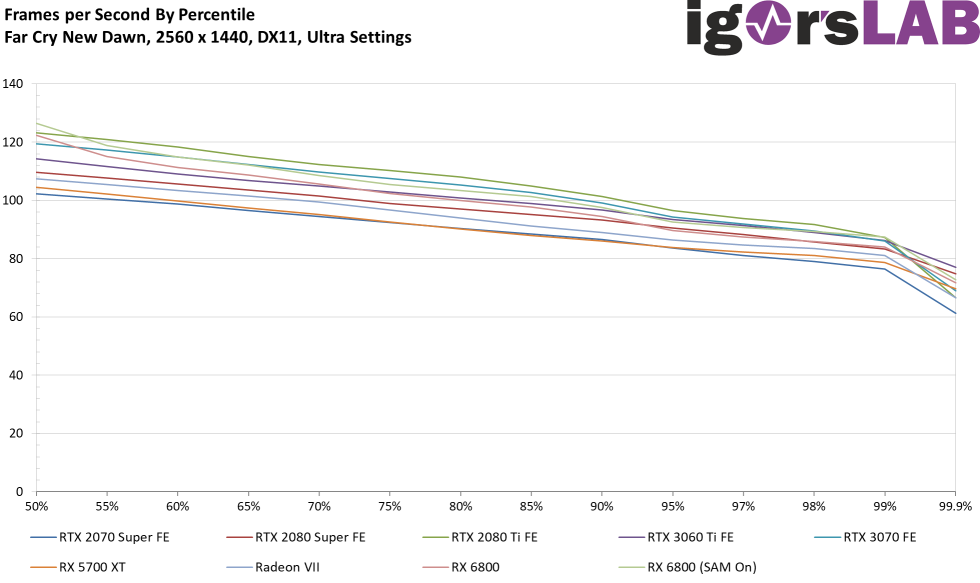
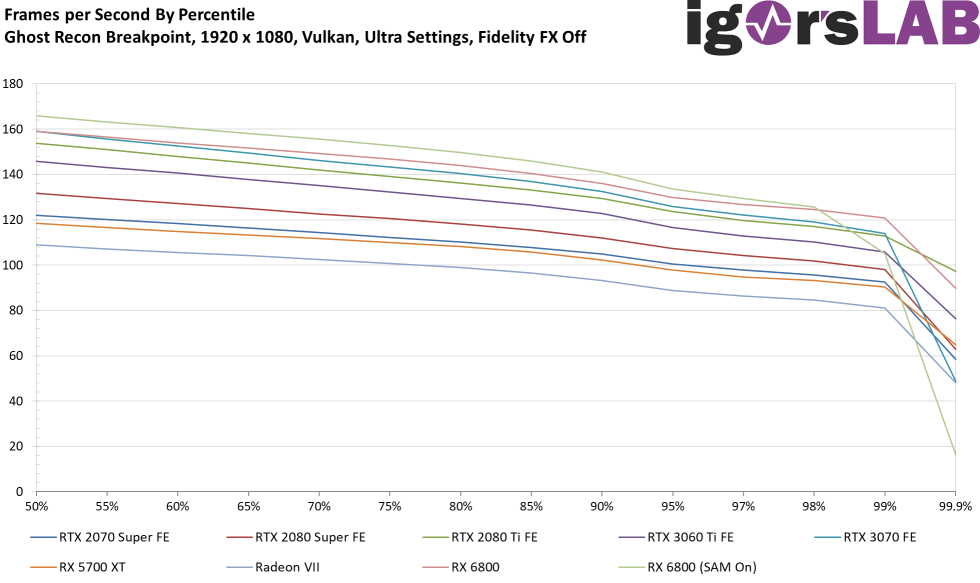
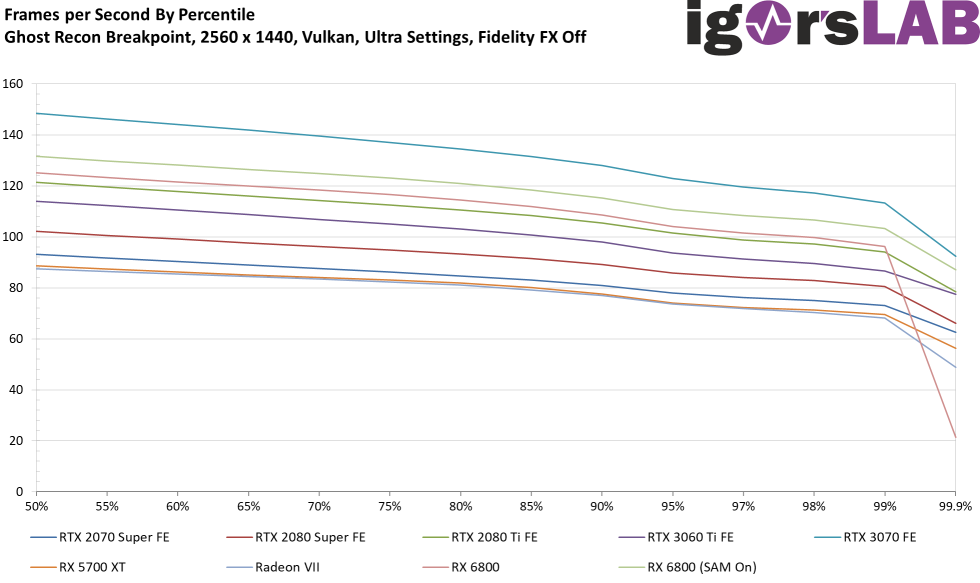
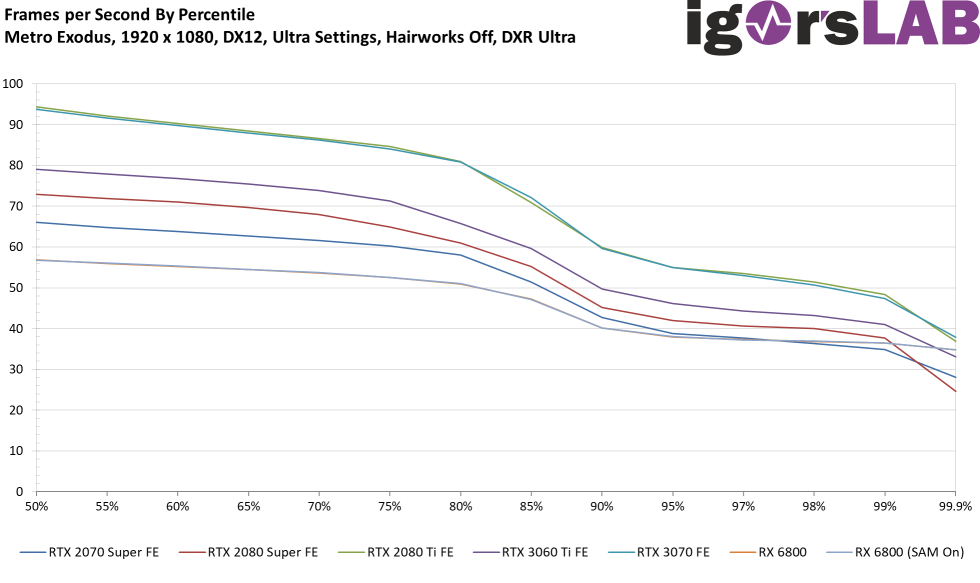
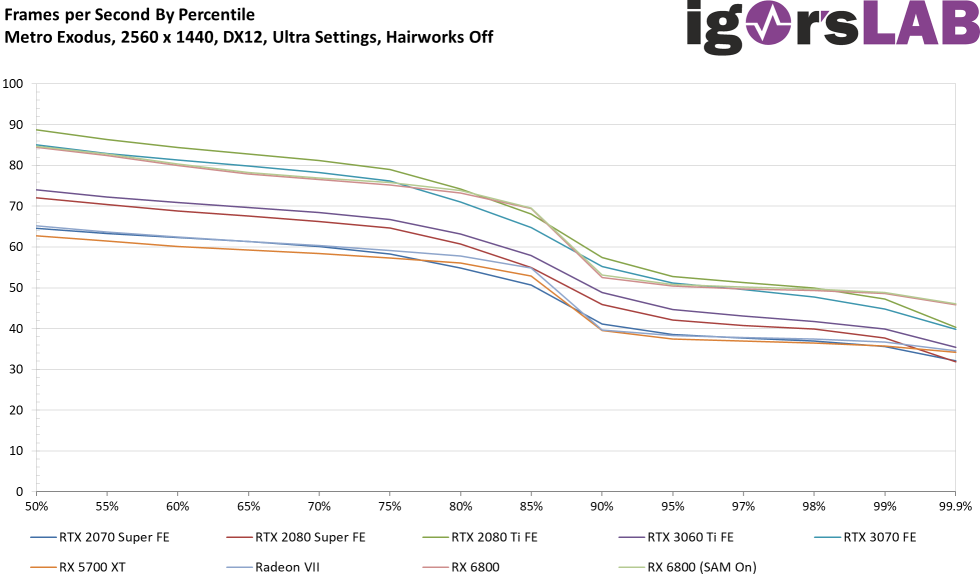
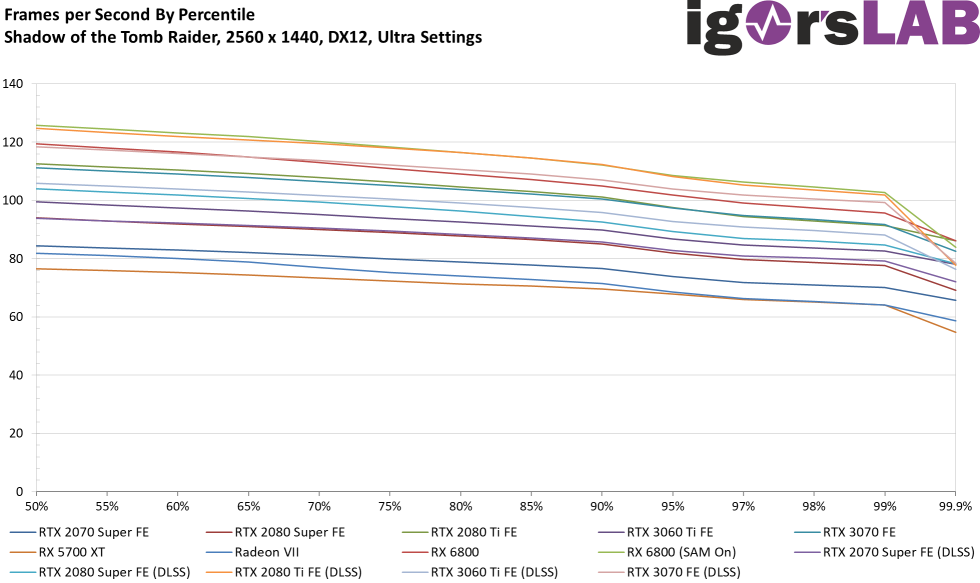
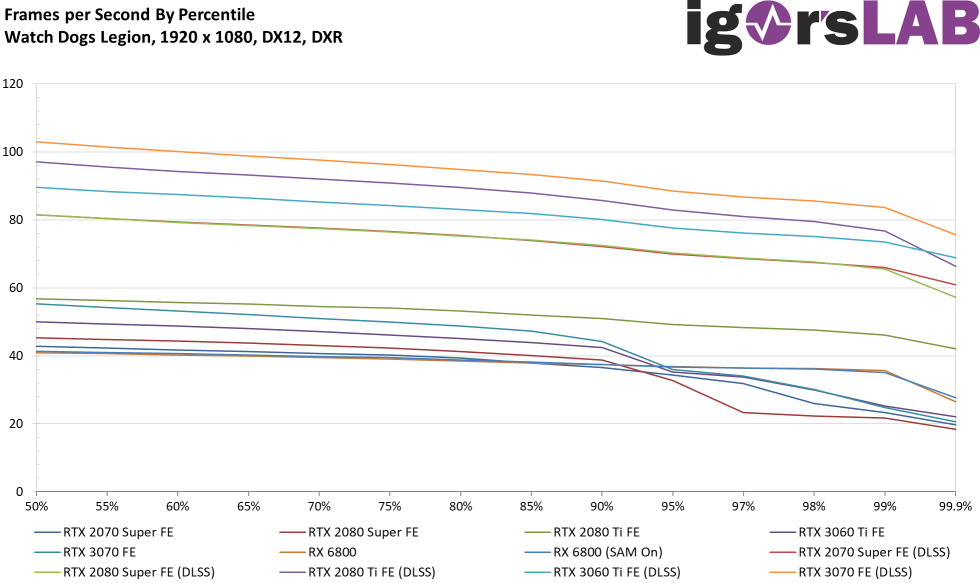
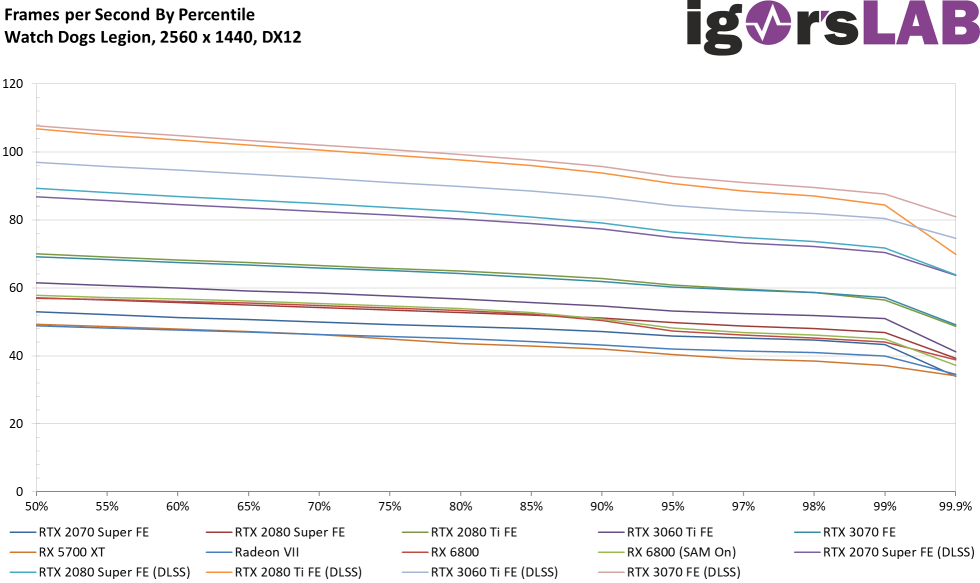
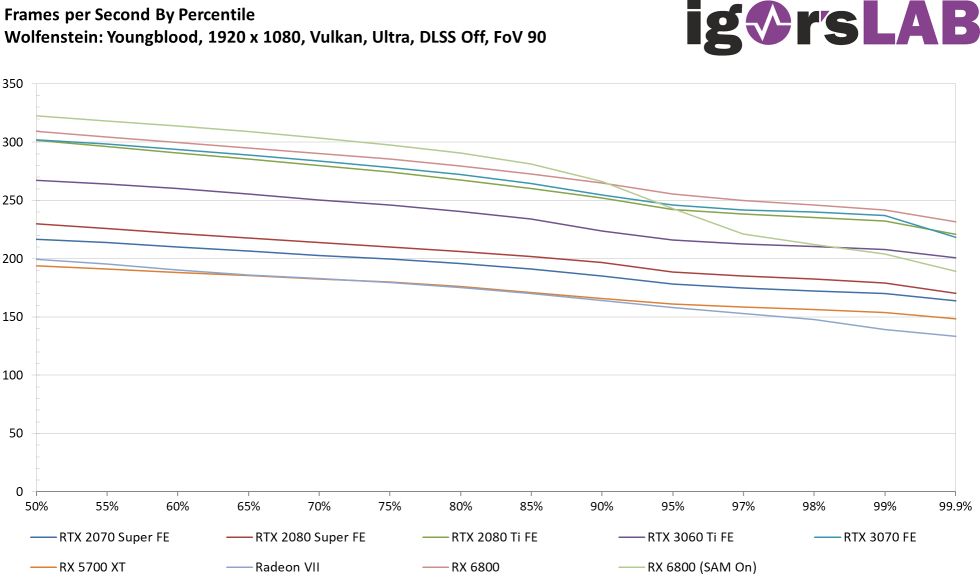
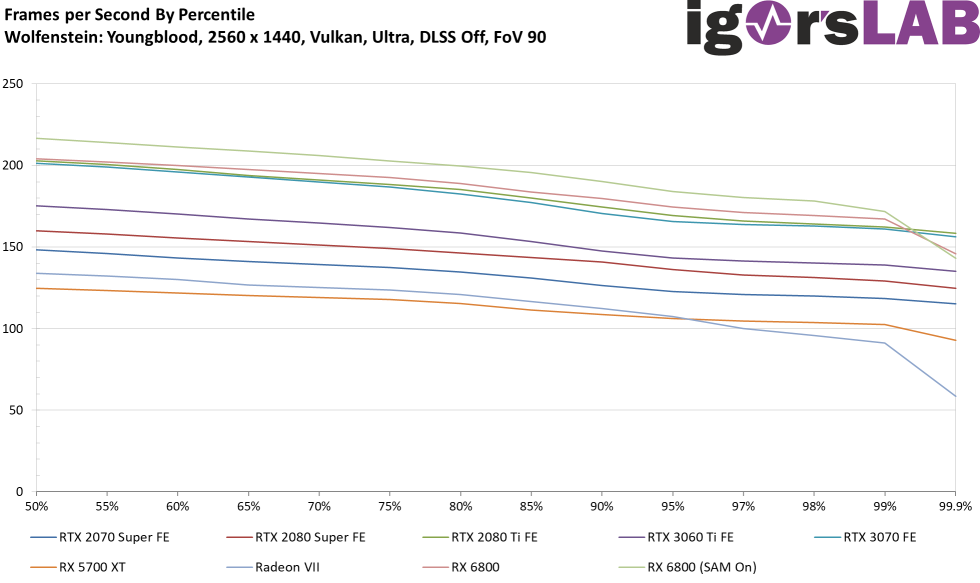
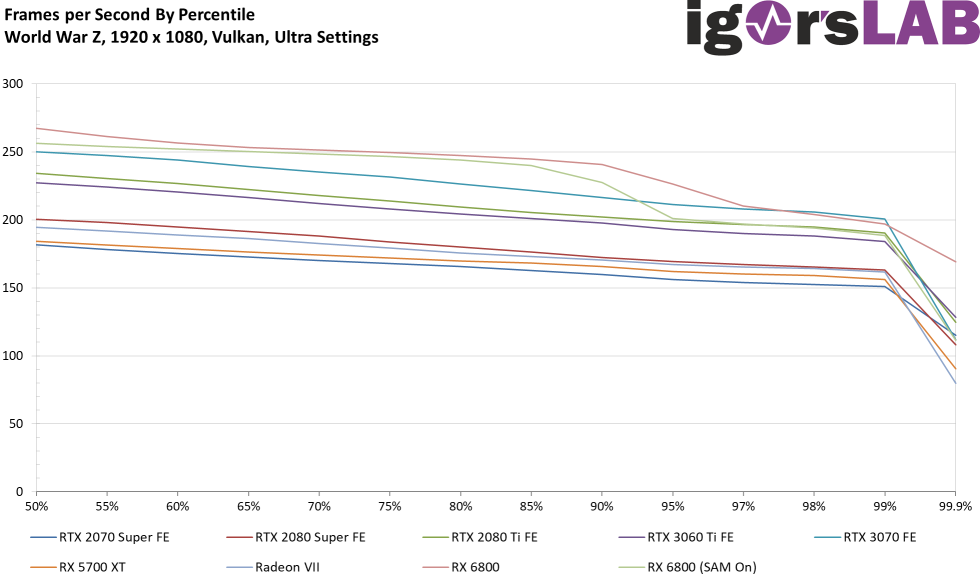
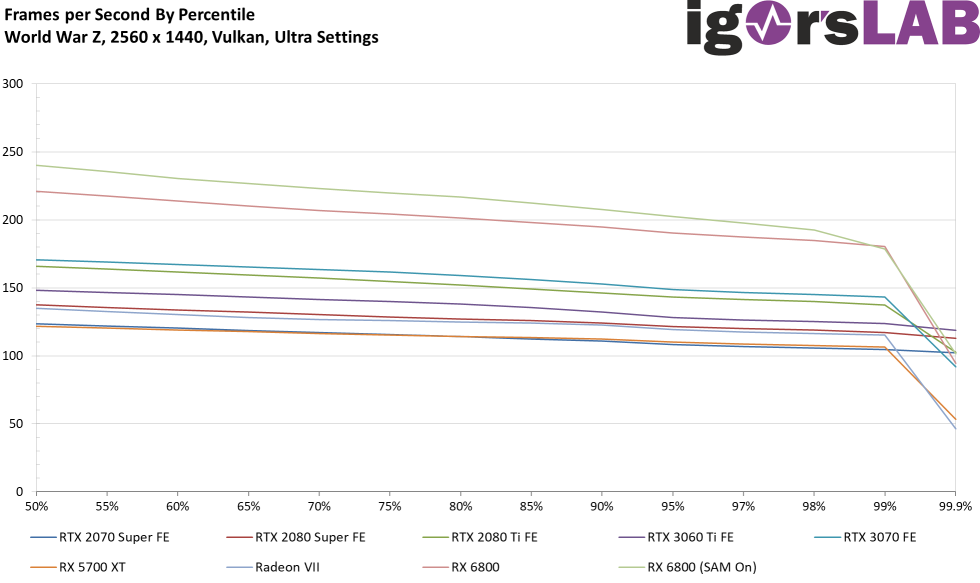
Percentiles of all games and resolutions as curves


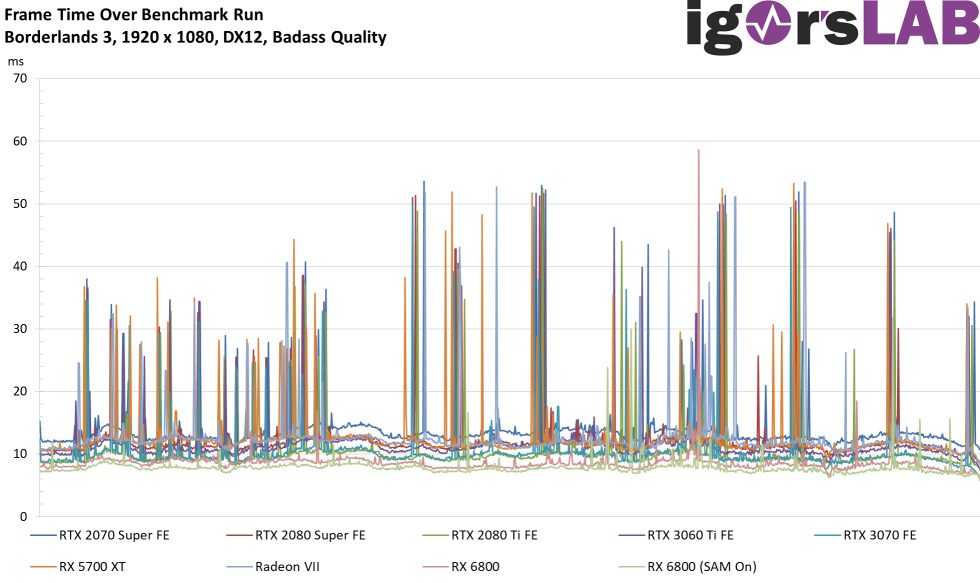
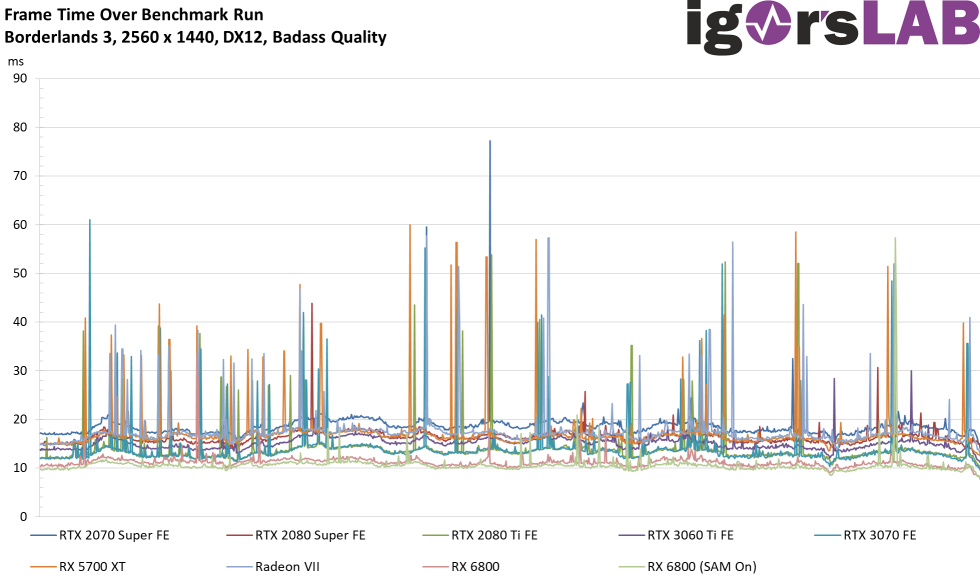
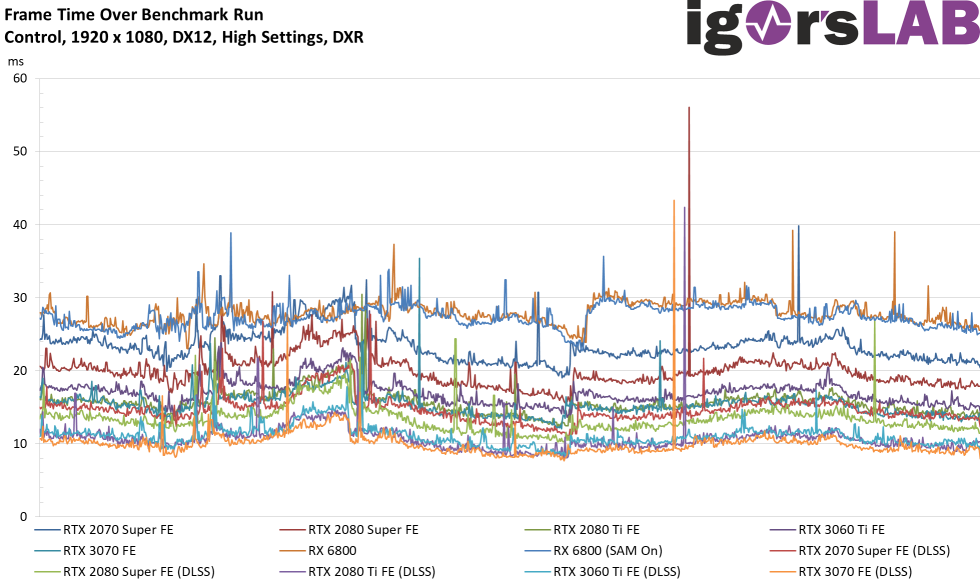
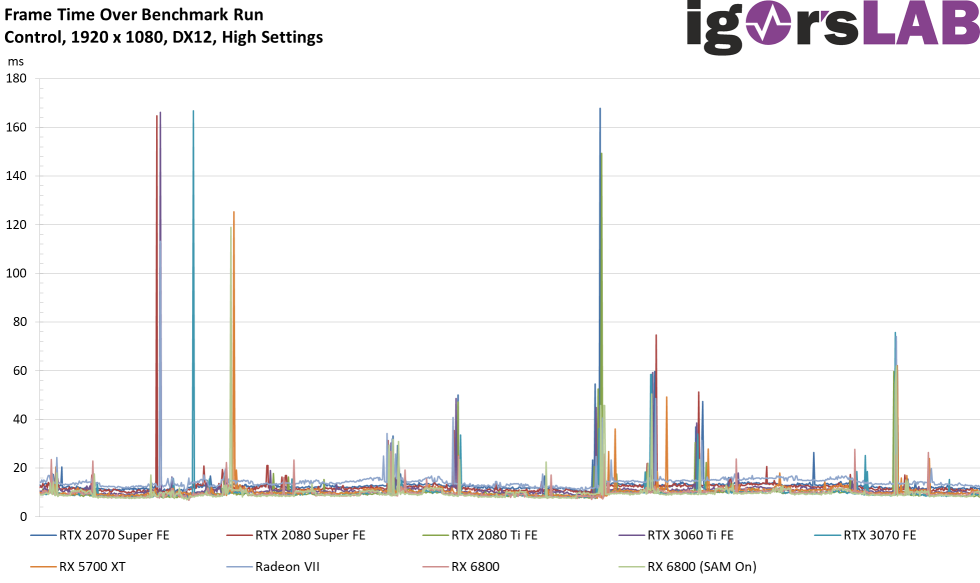
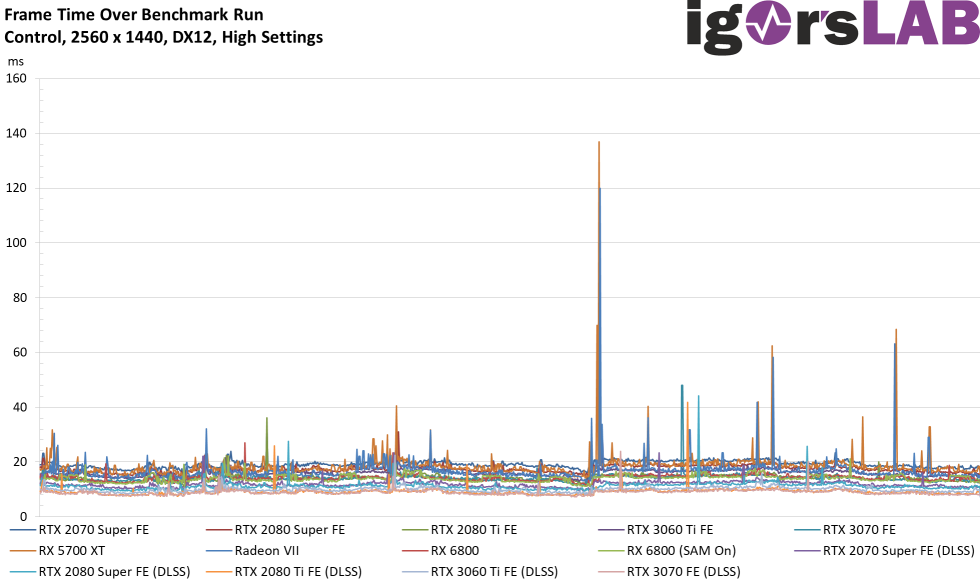
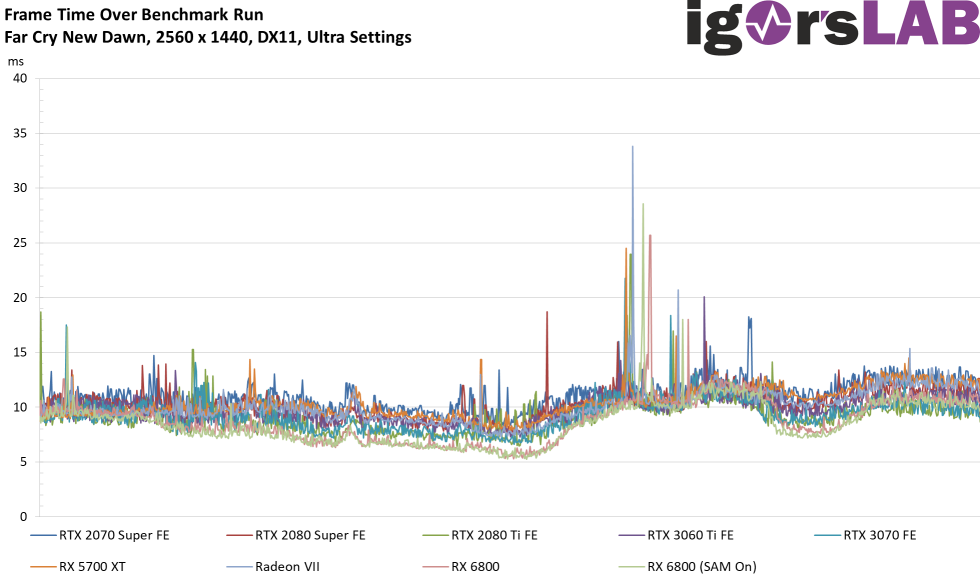
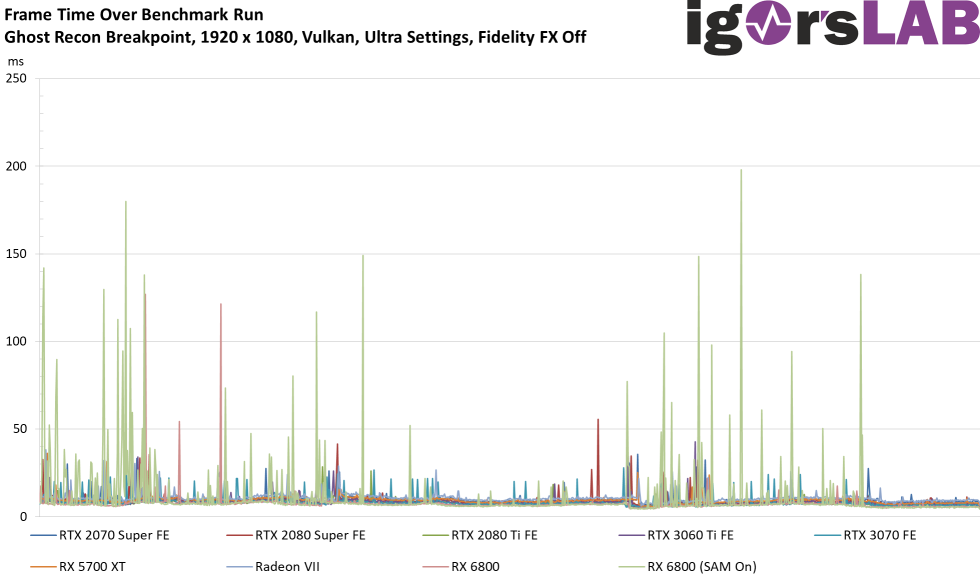
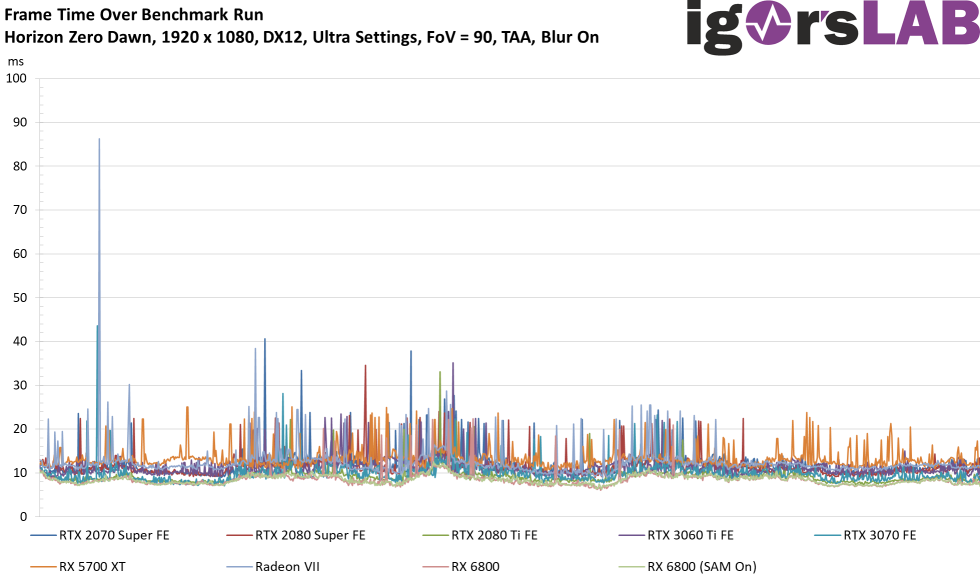
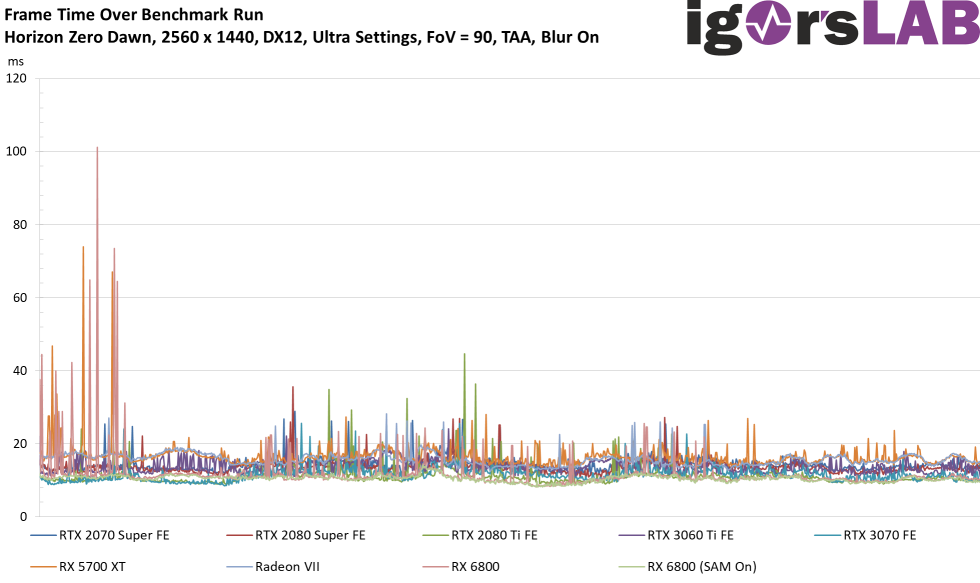
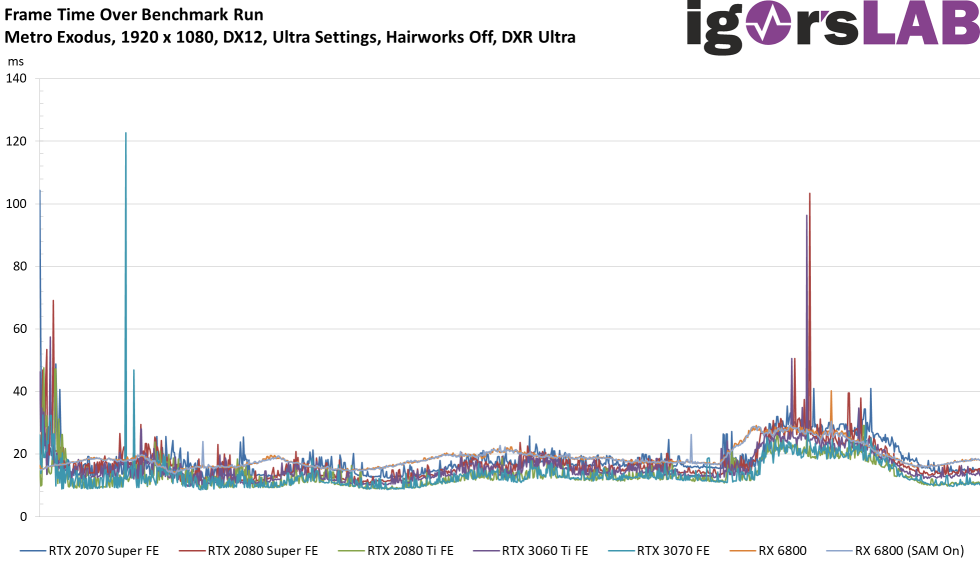
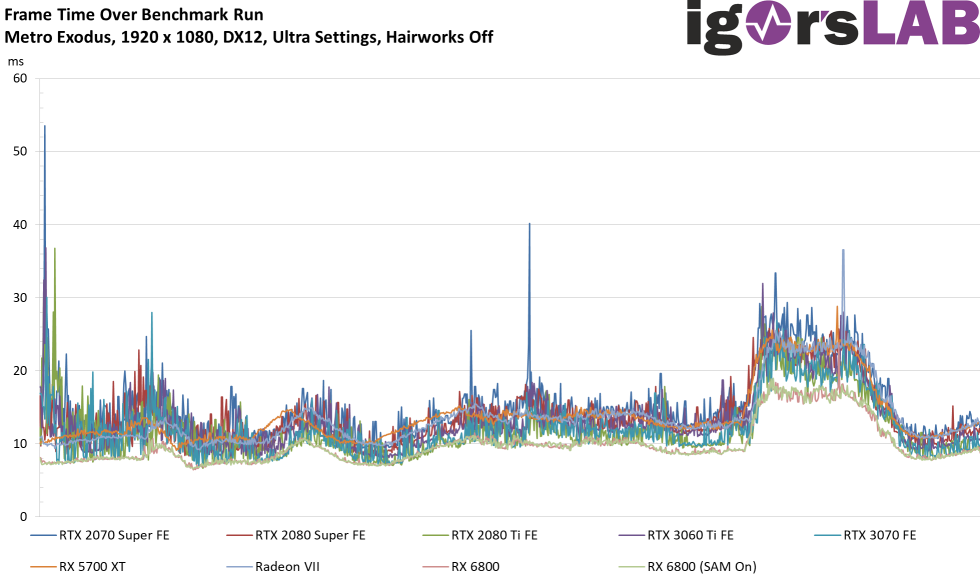
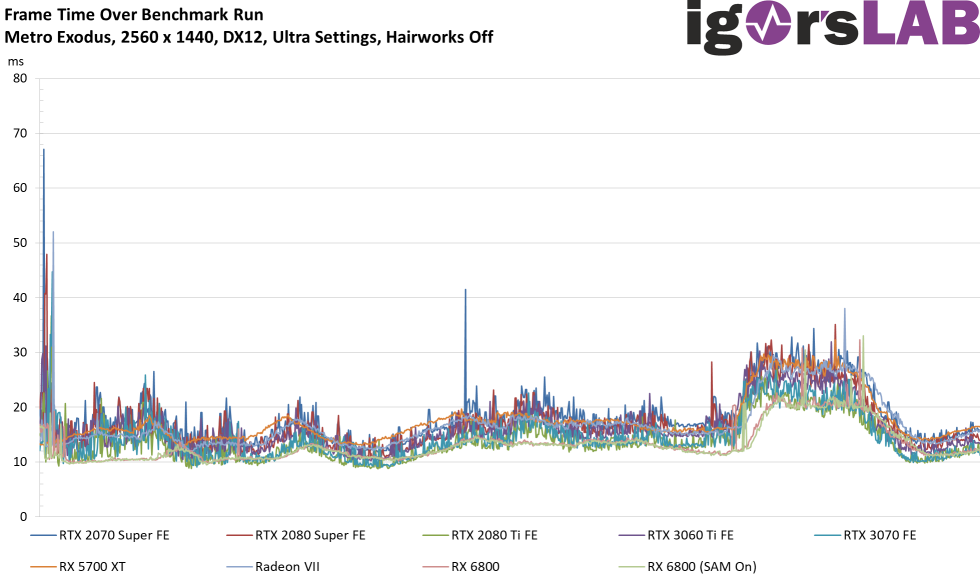
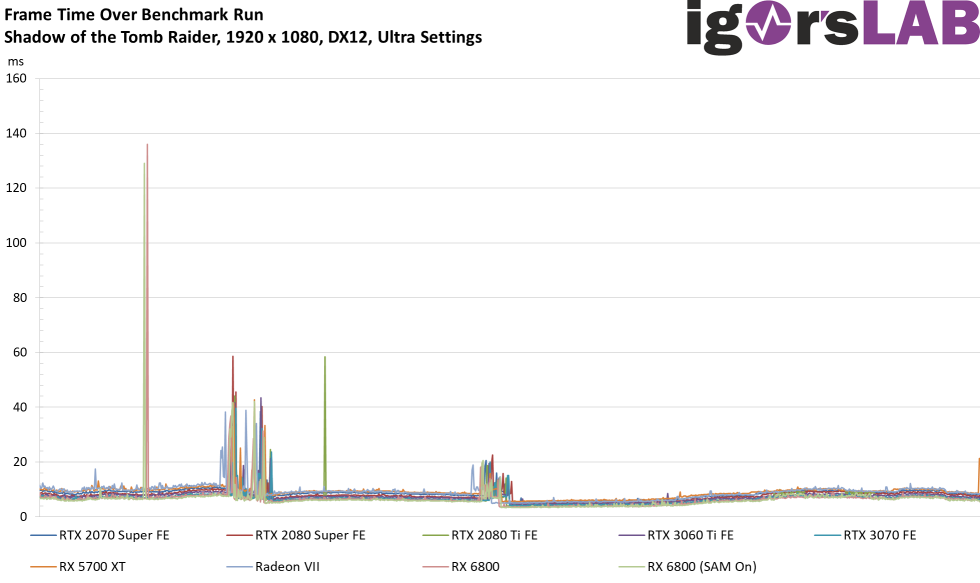
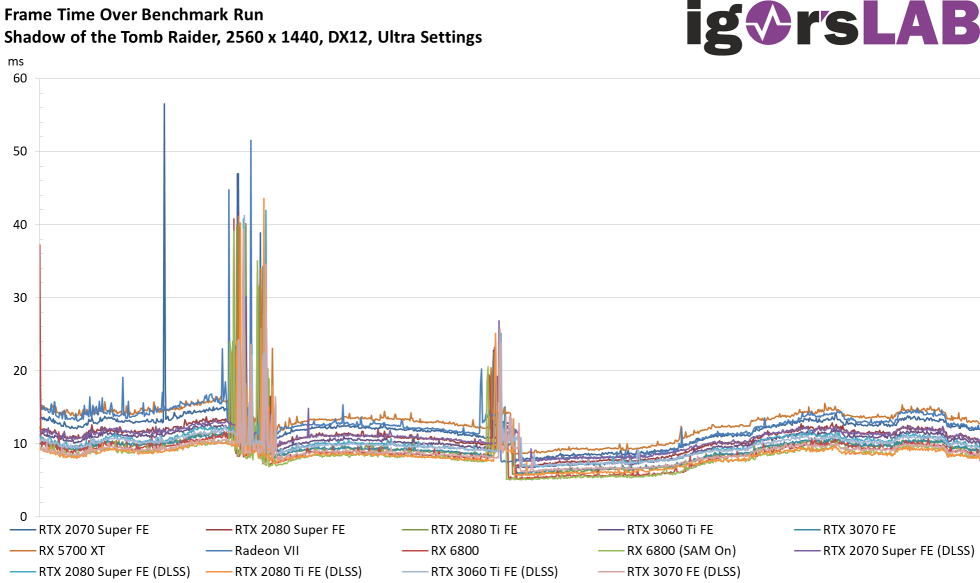
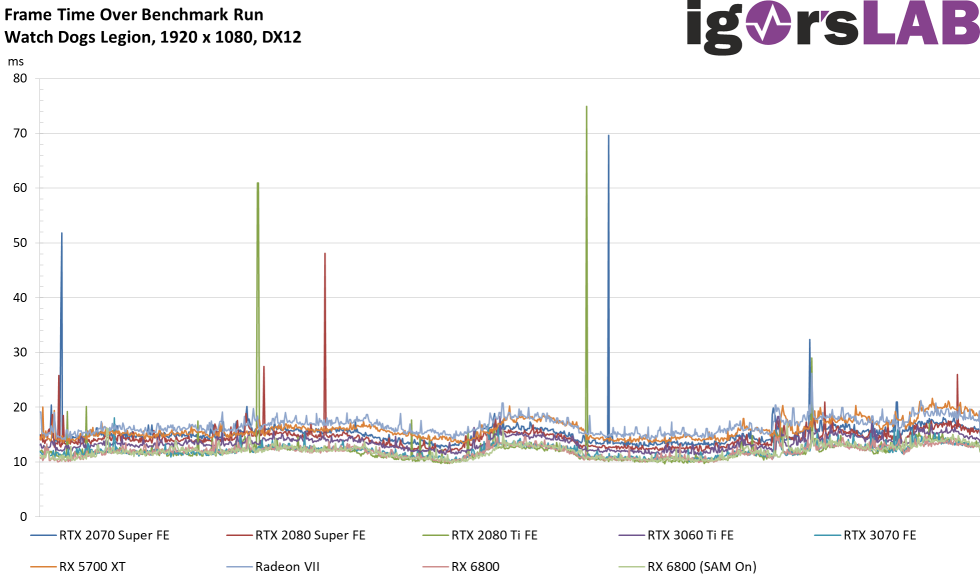
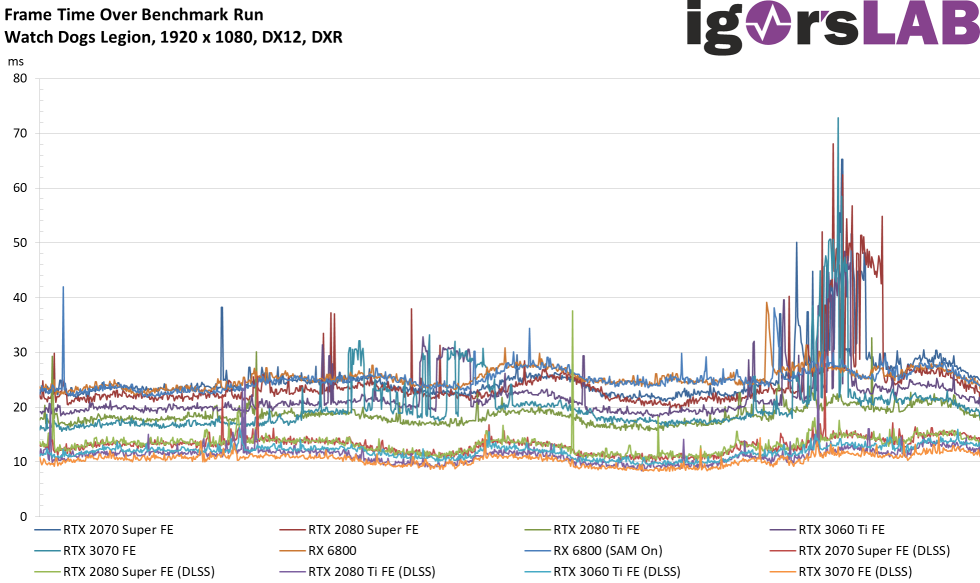
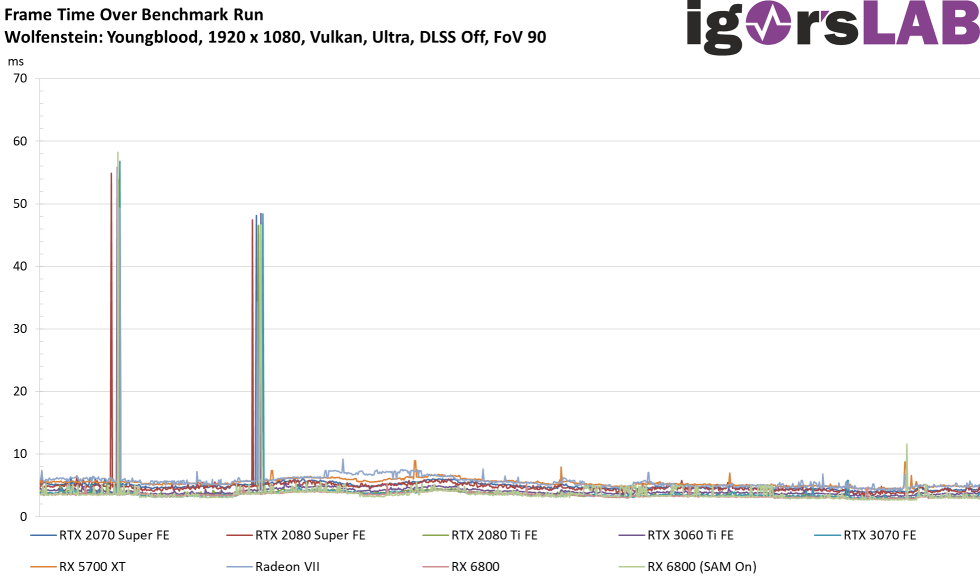
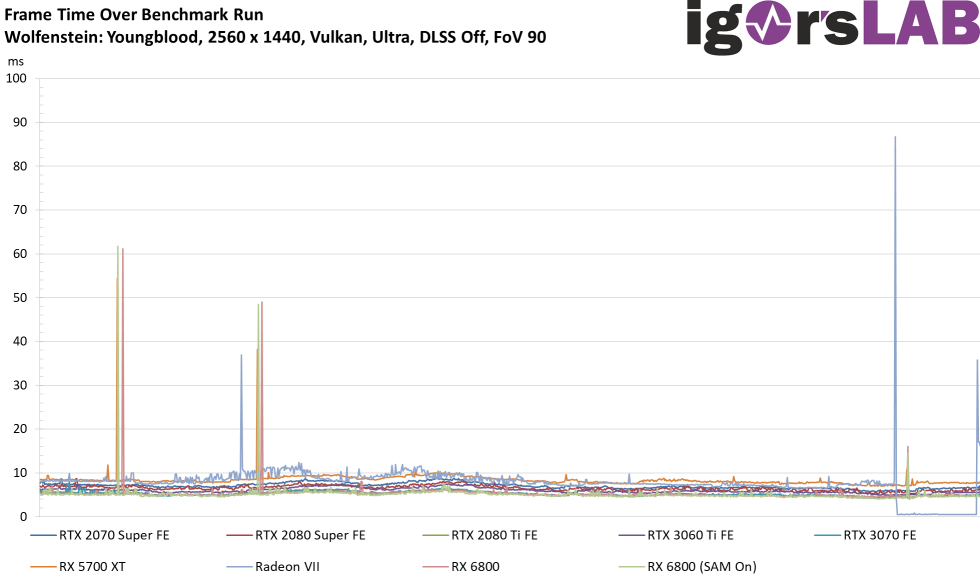
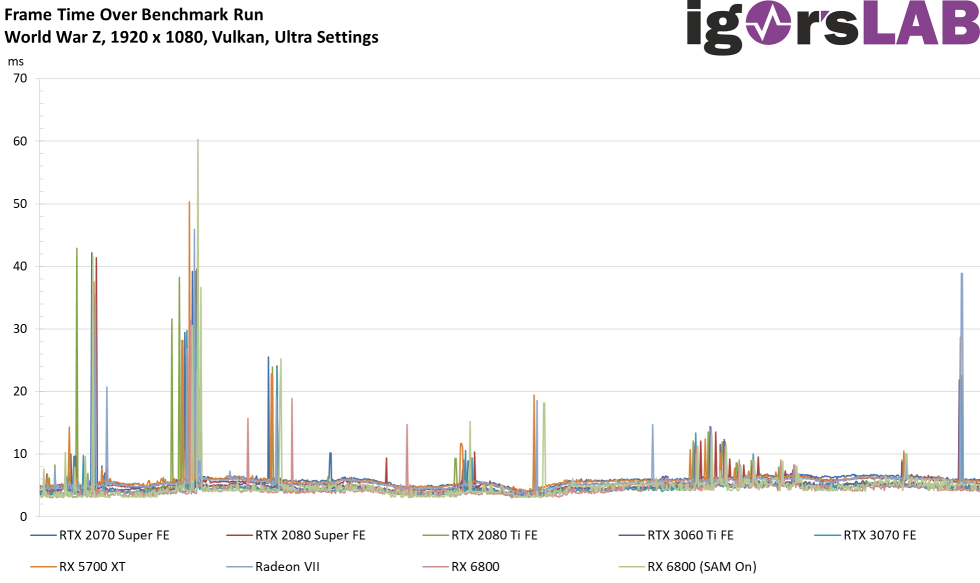
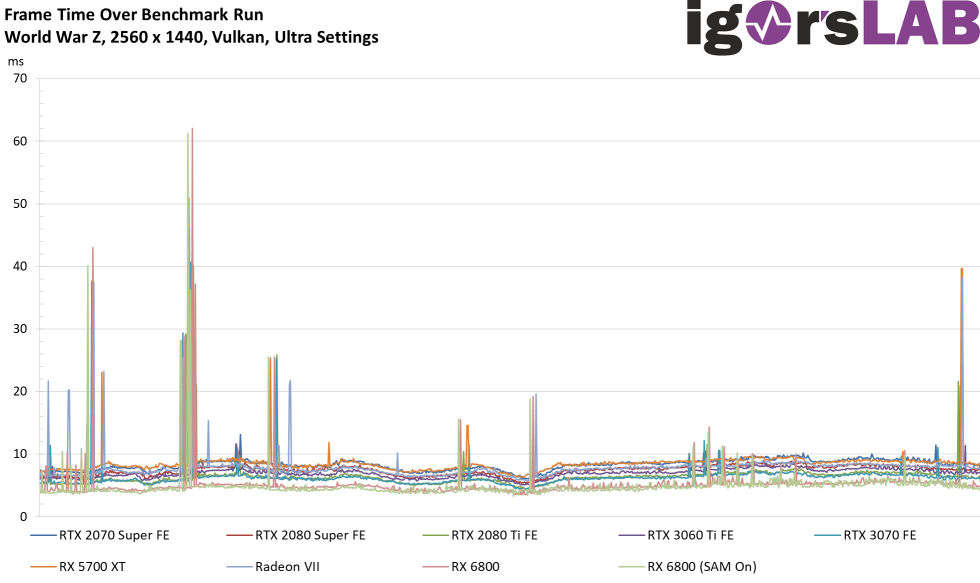
Frametimes of all games and resolutions as curves


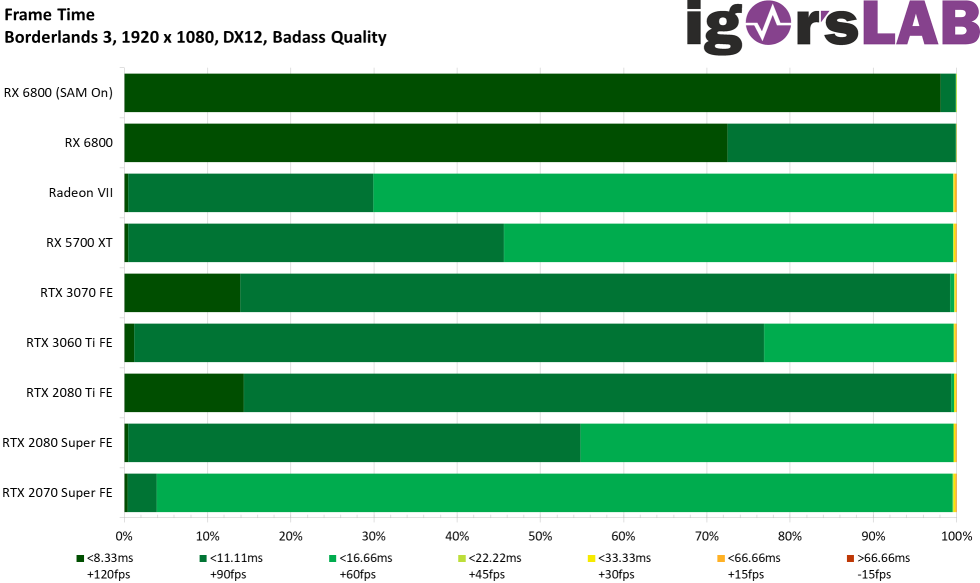
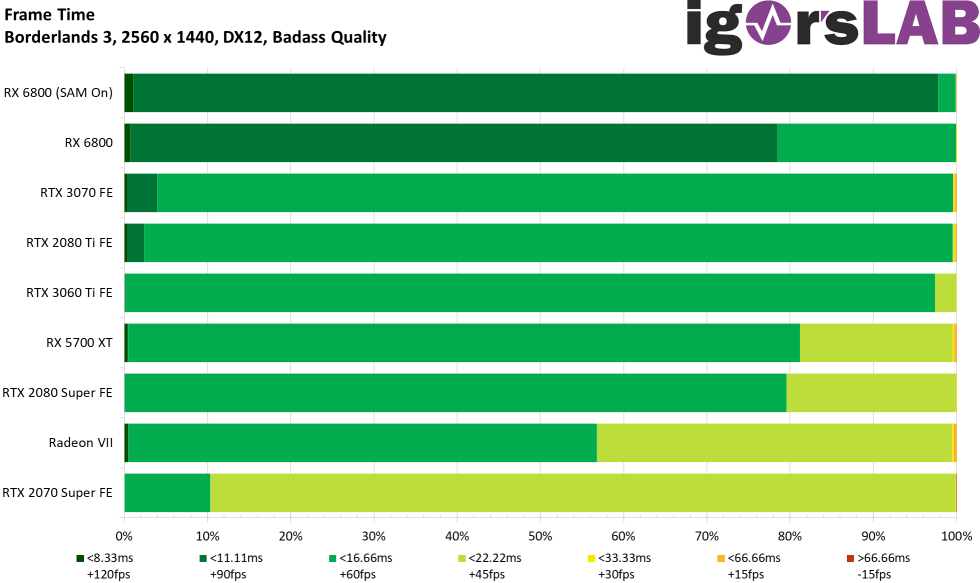
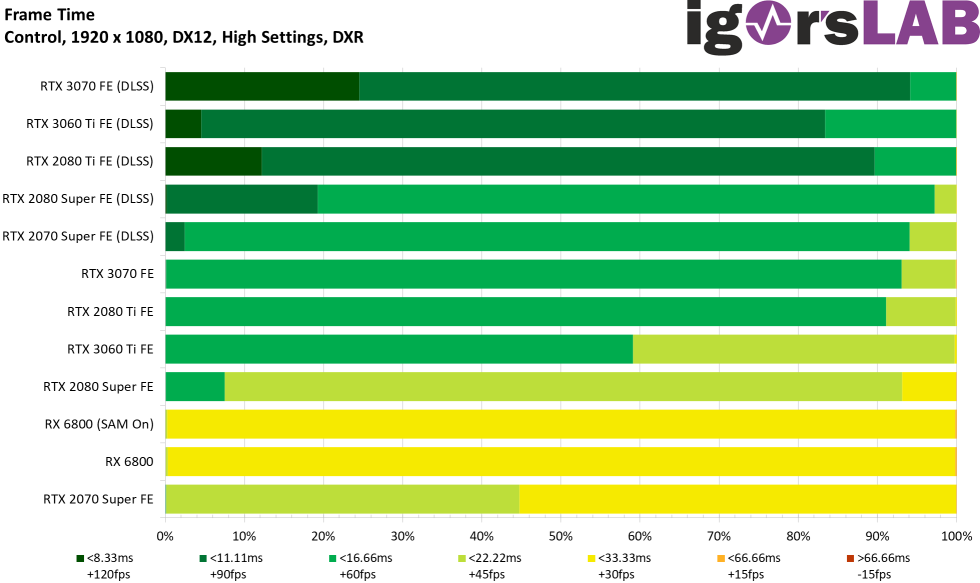
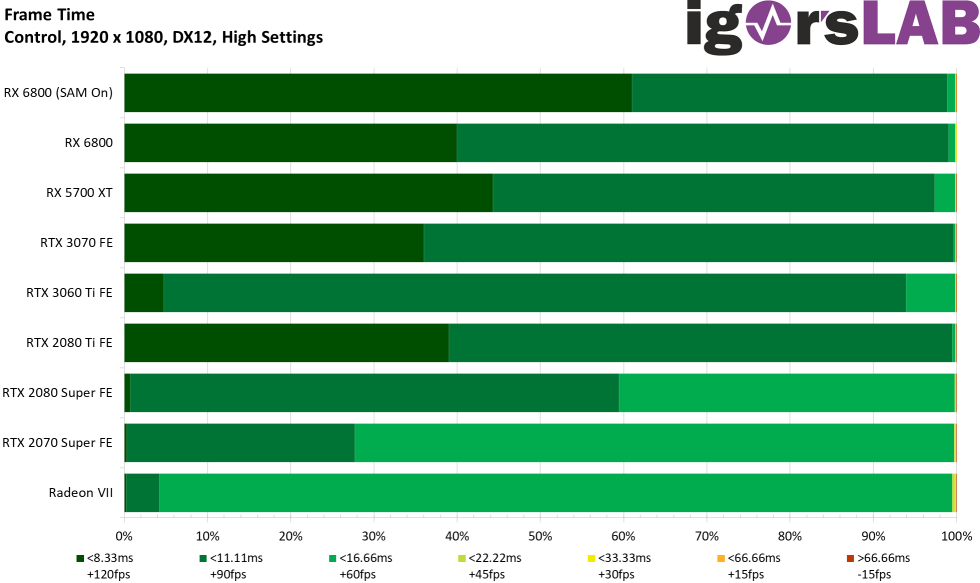
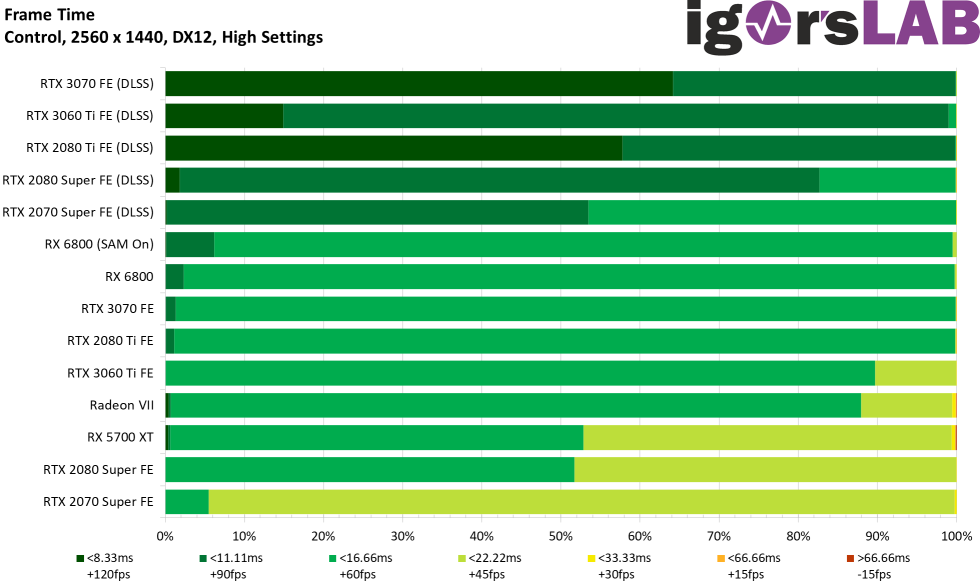
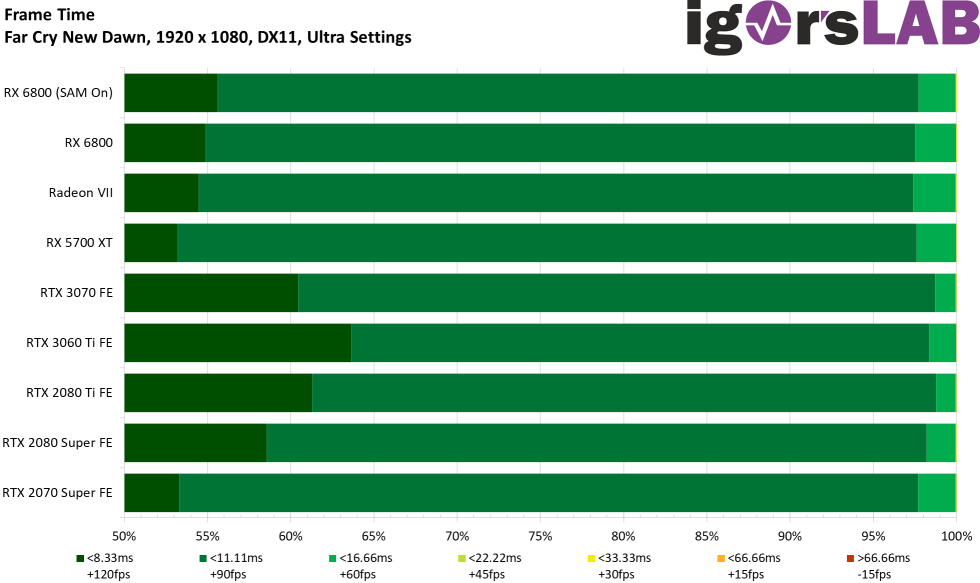
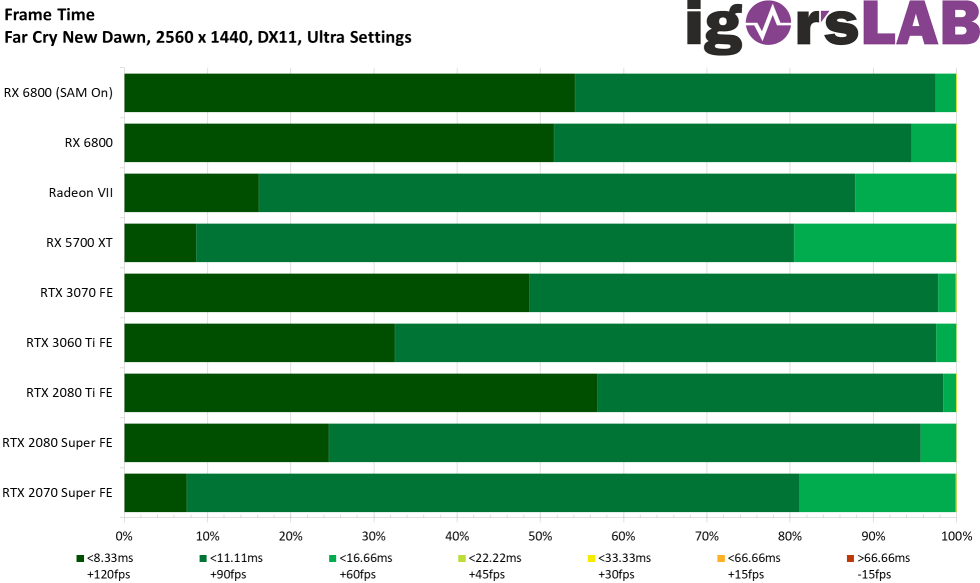
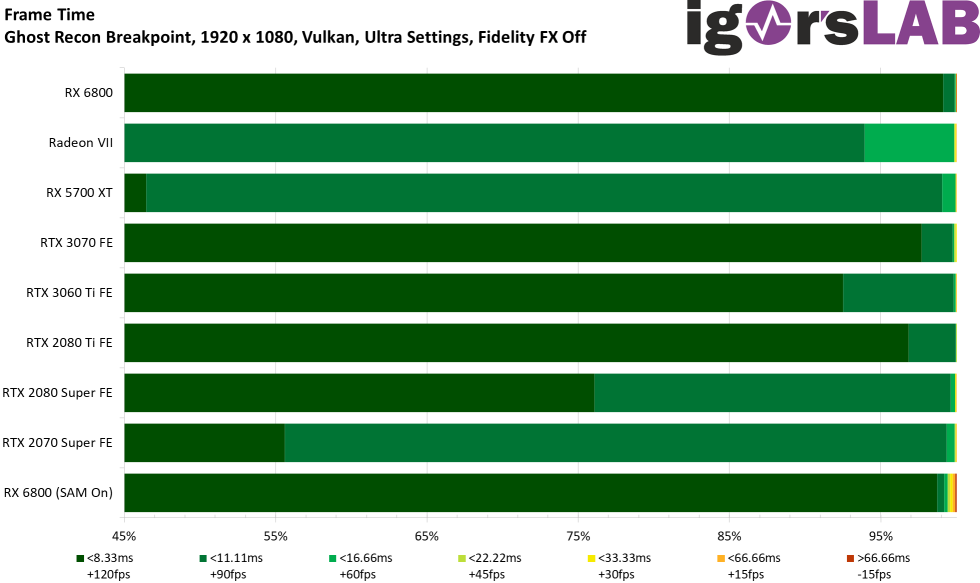
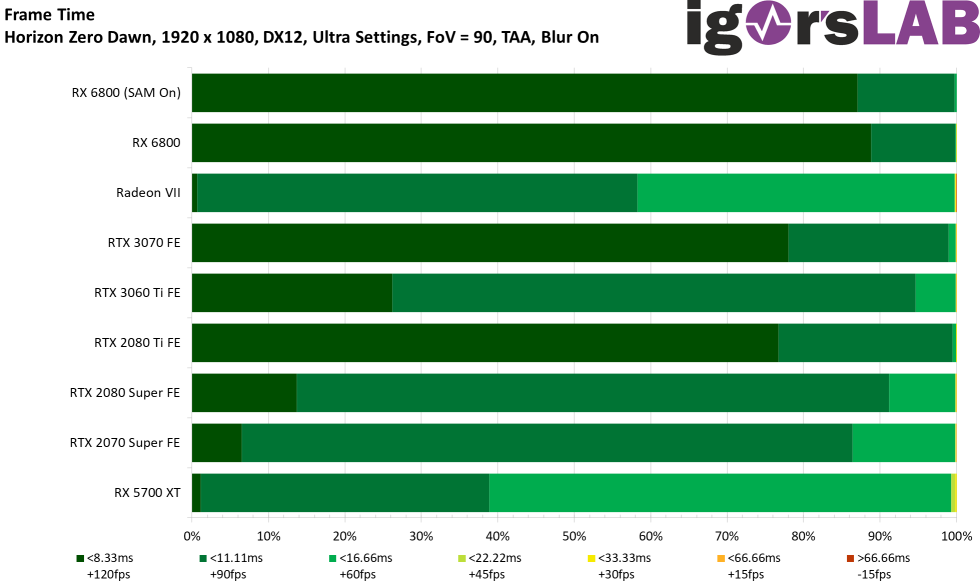
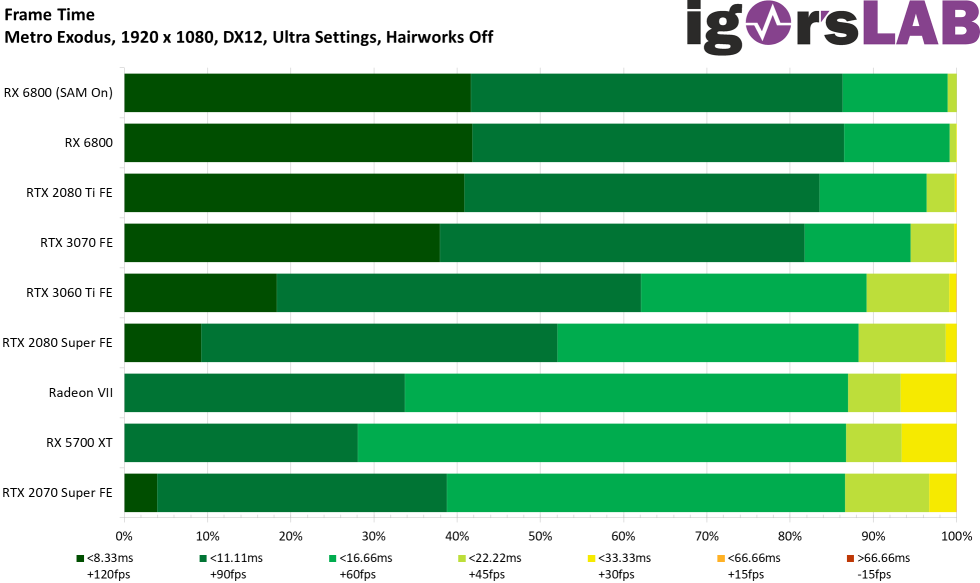
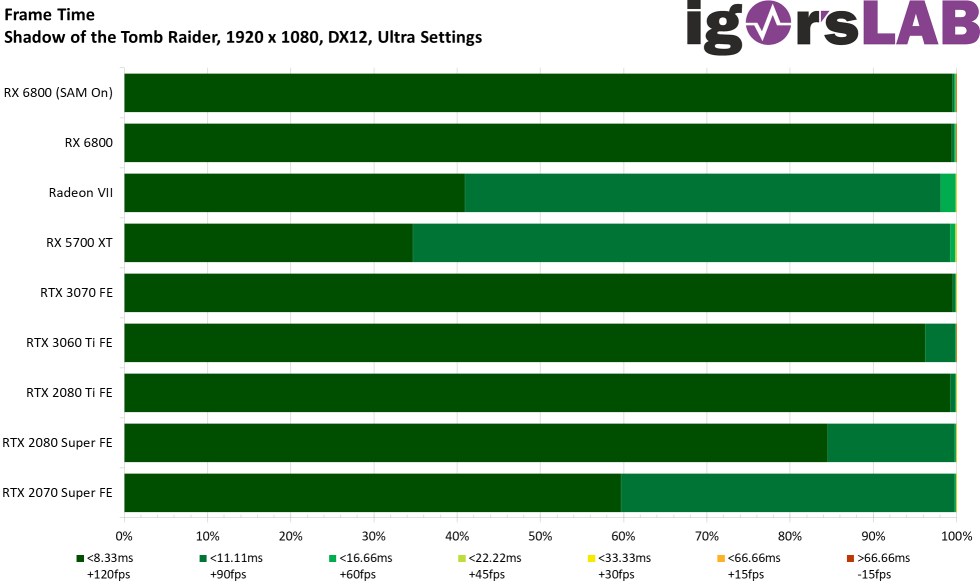
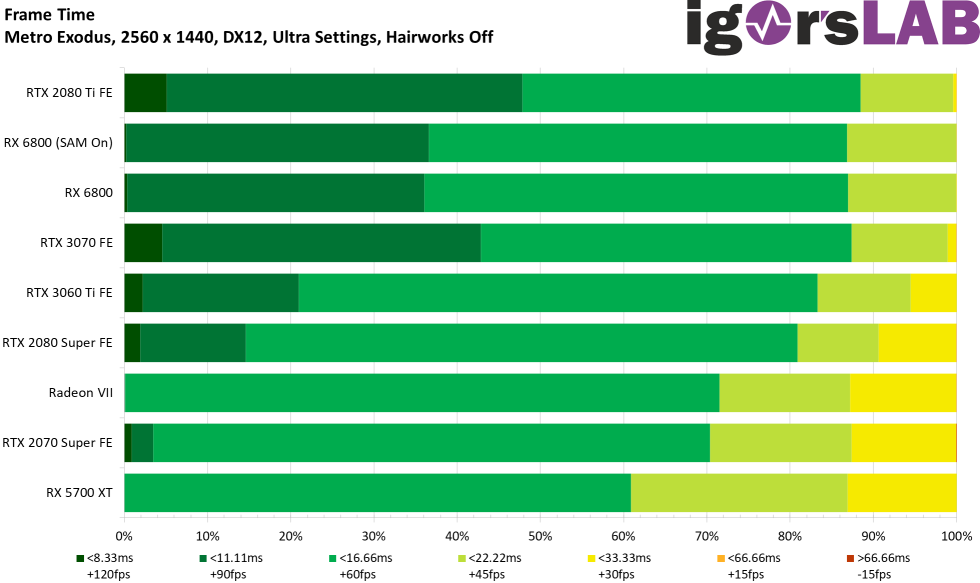
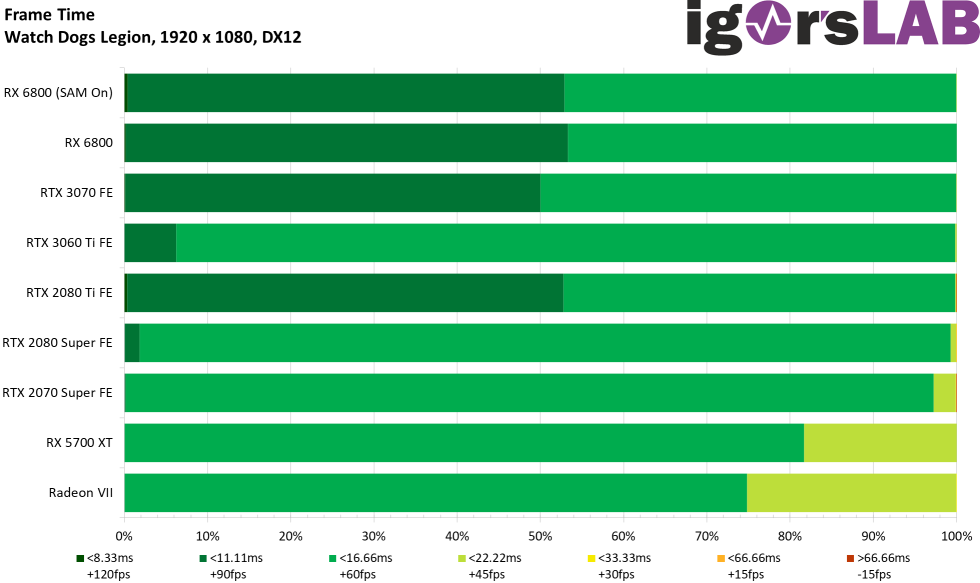
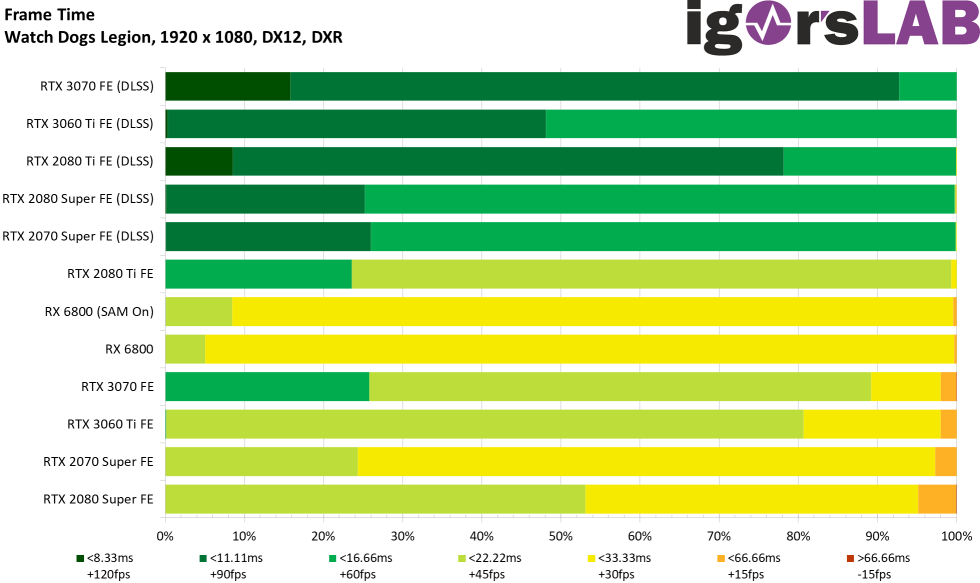
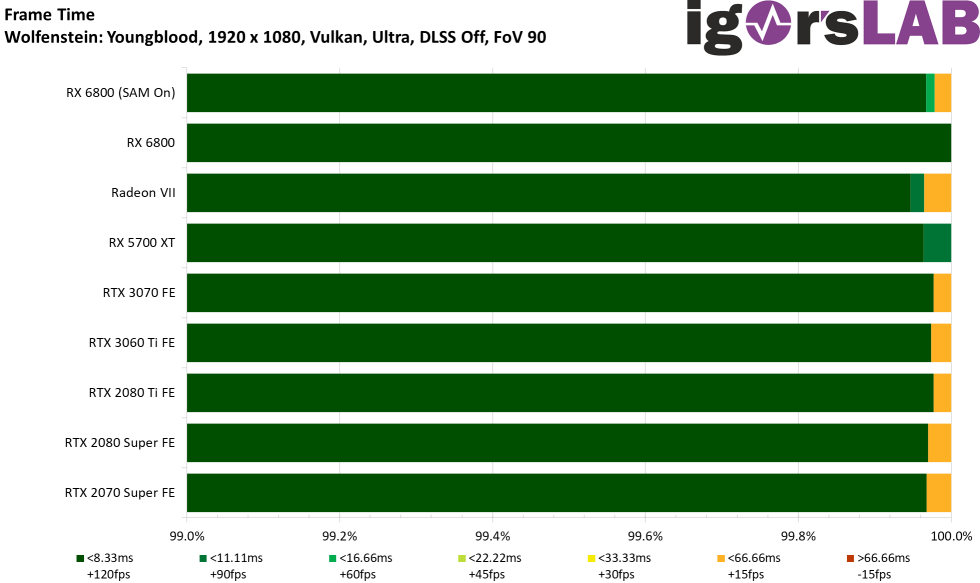
Frame Times of all games and resolutions as bars
And because that doesn’t say much yet, I have now tried to create a bar chart for each game, which is clearly arranged in different colors, and which compares and records what the eye can’t see in pure curves.


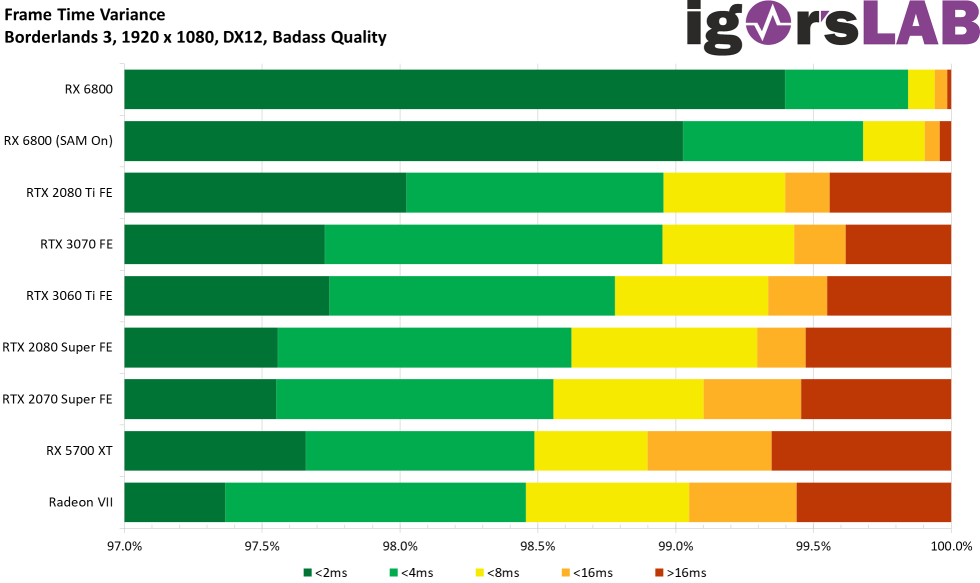
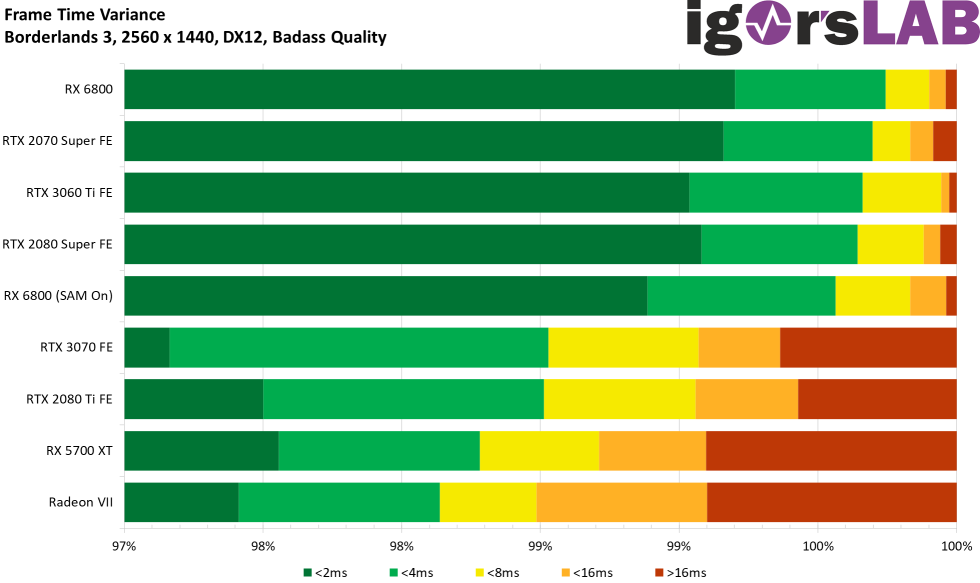
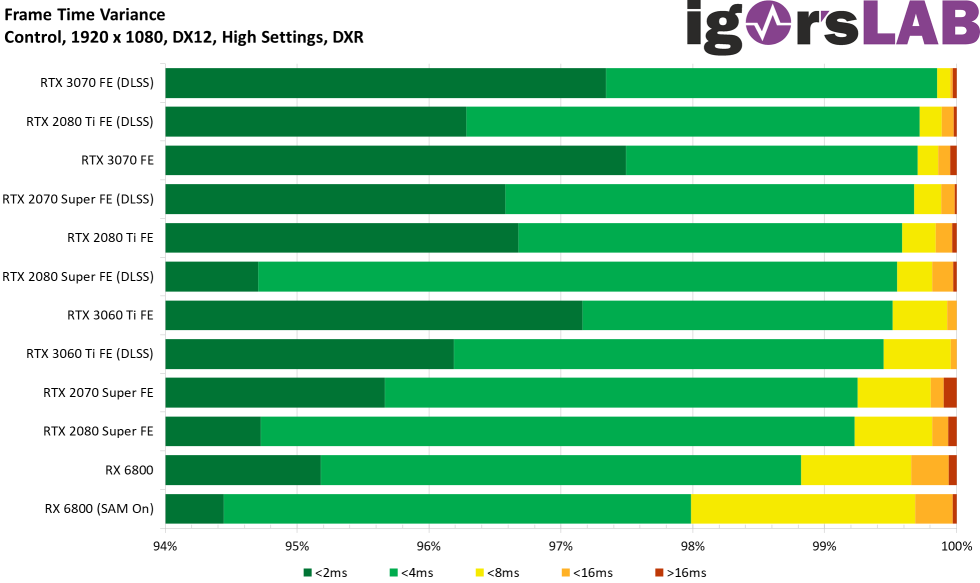
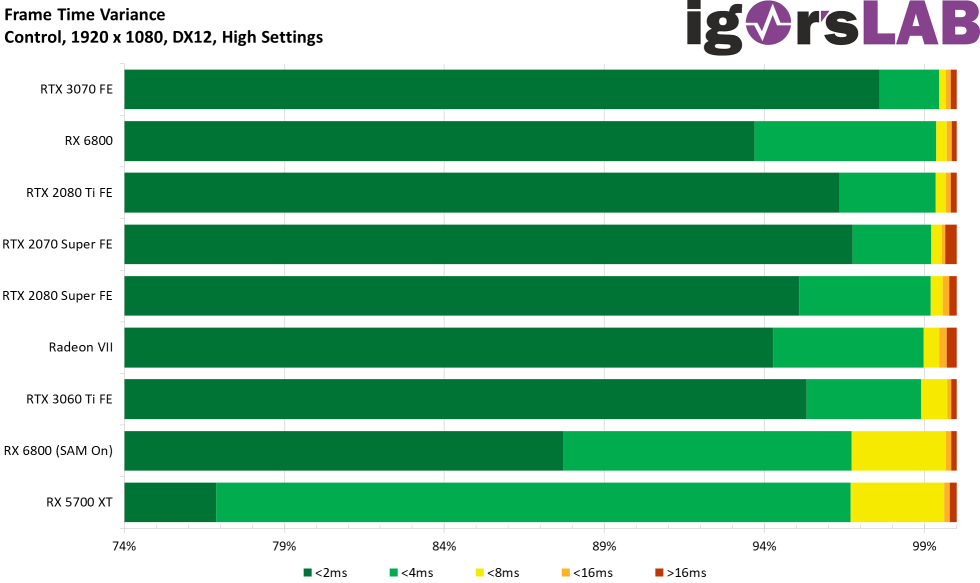
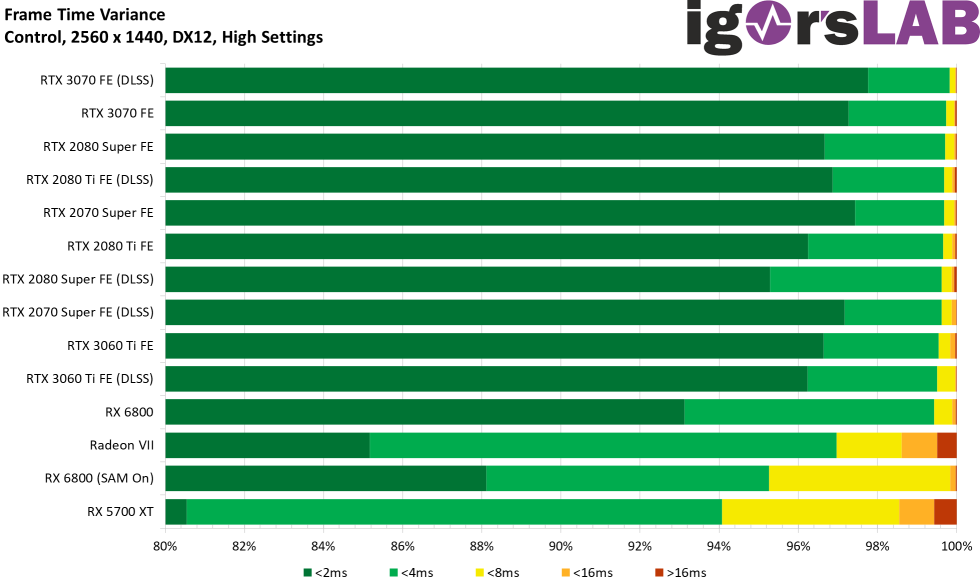
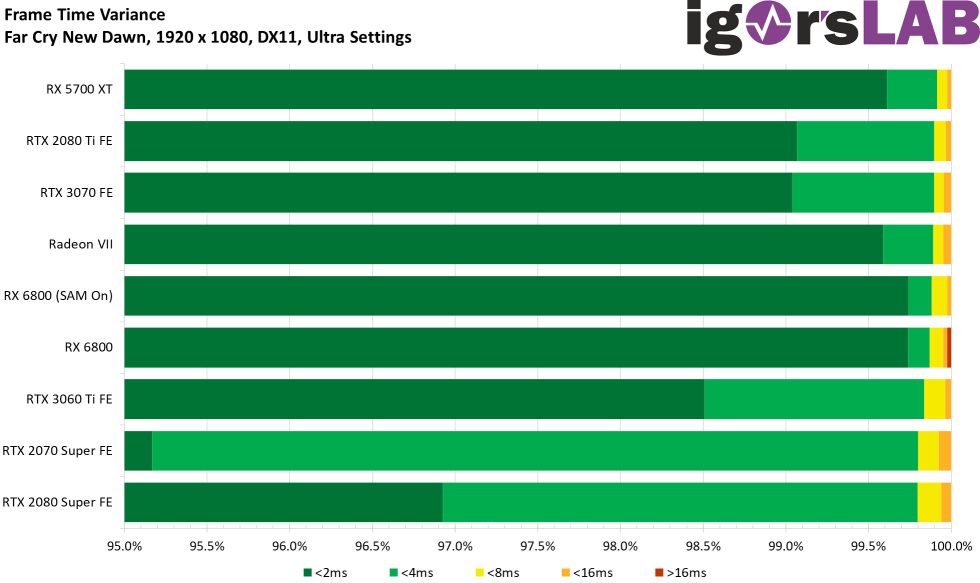
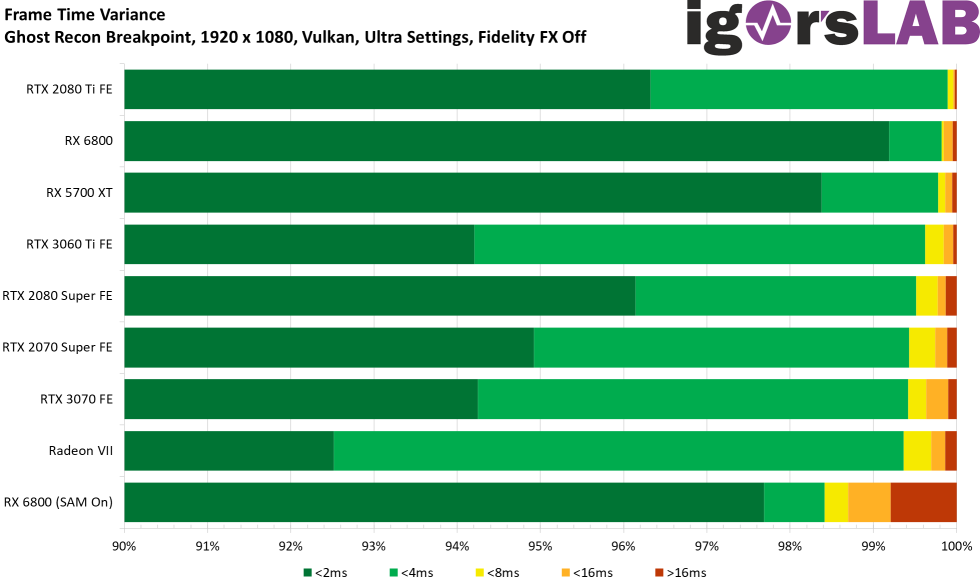
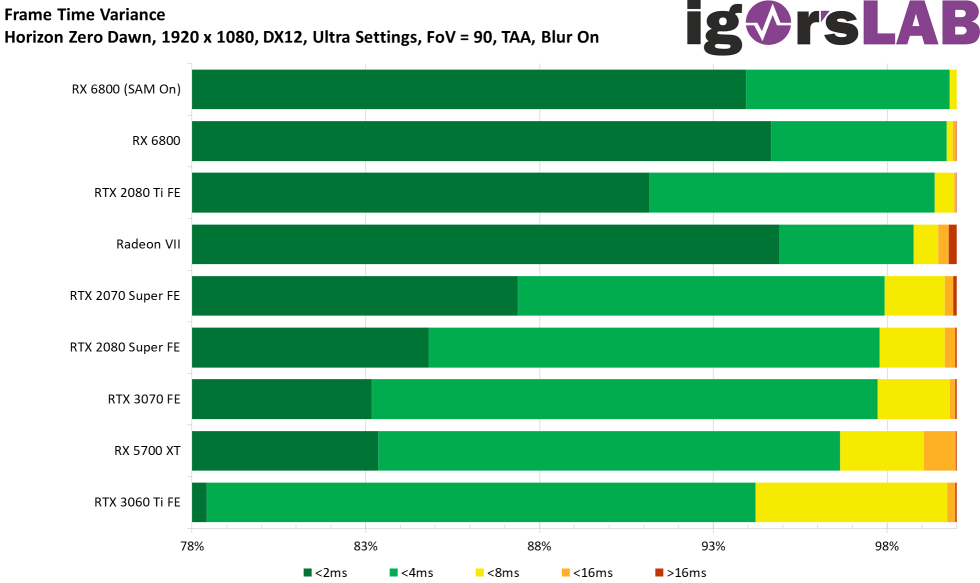
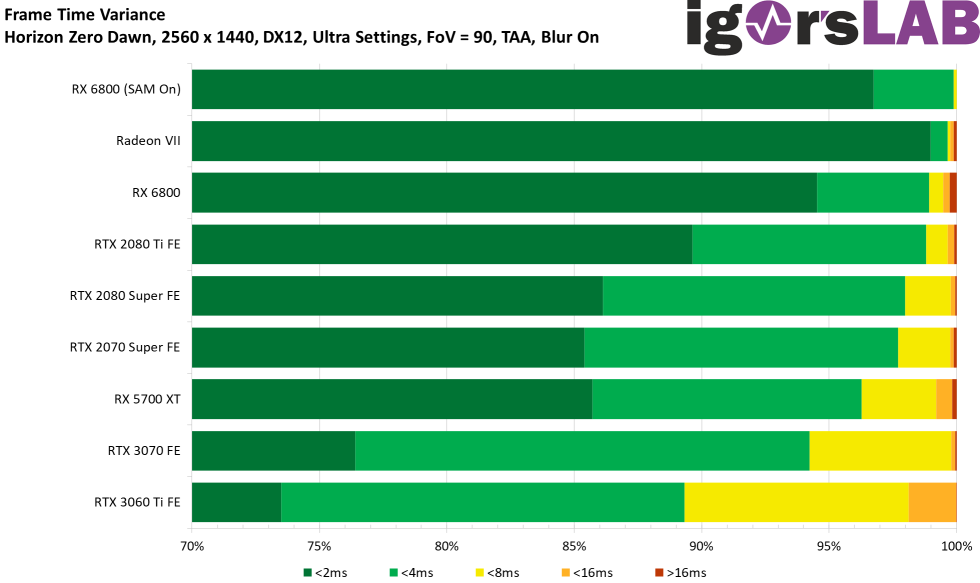
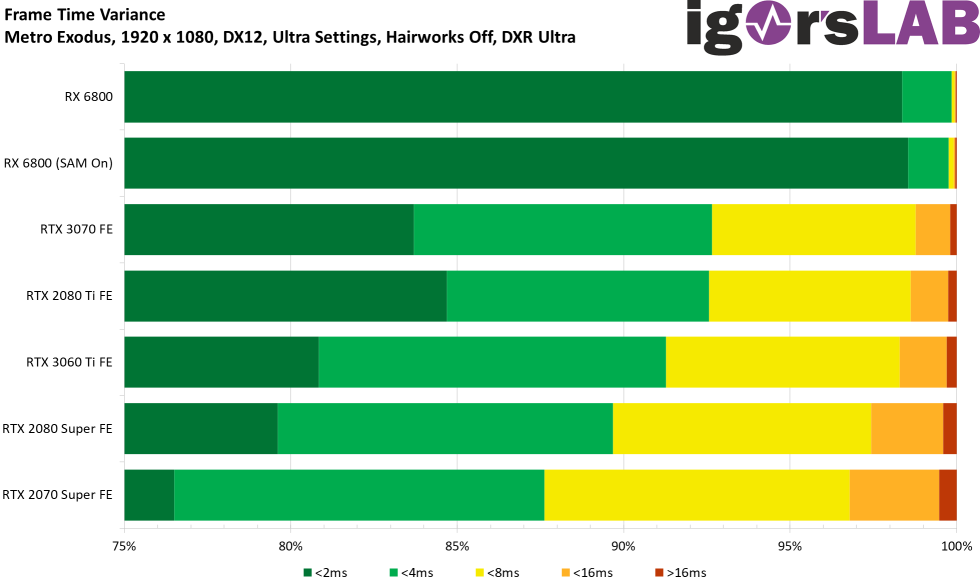
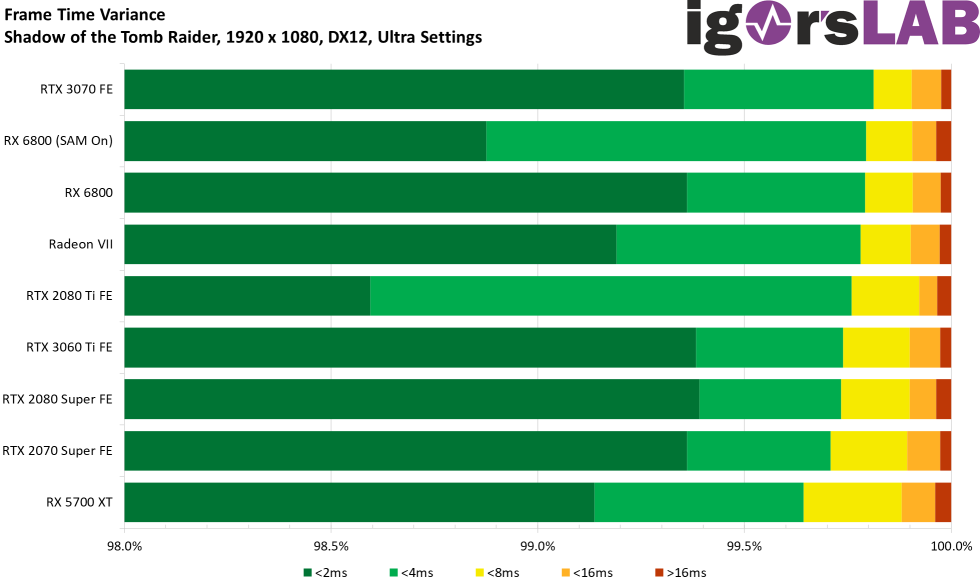
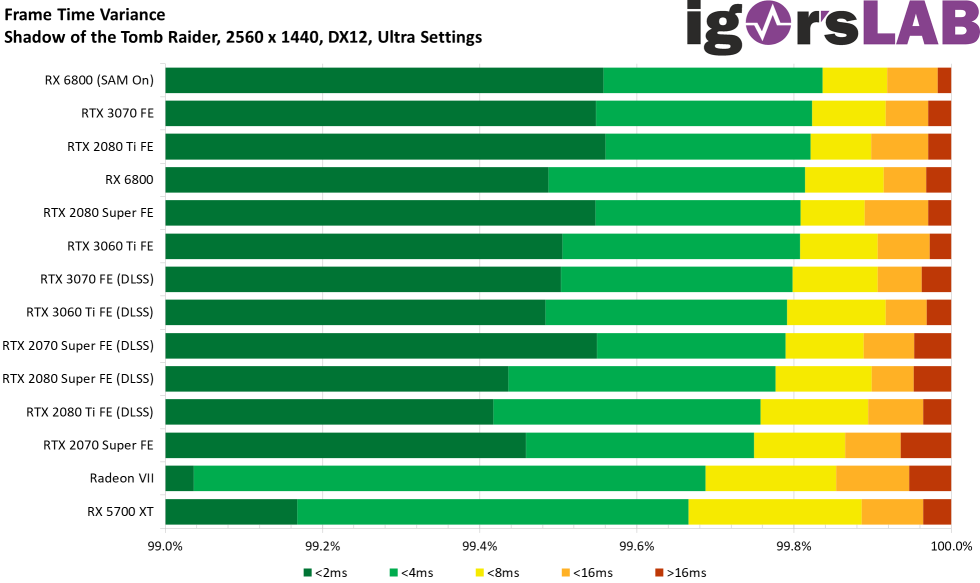
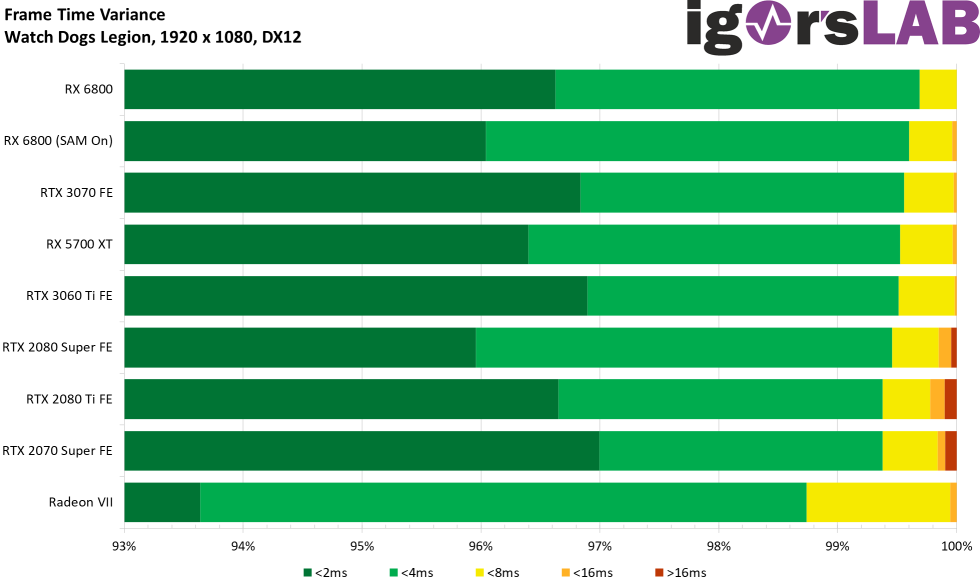
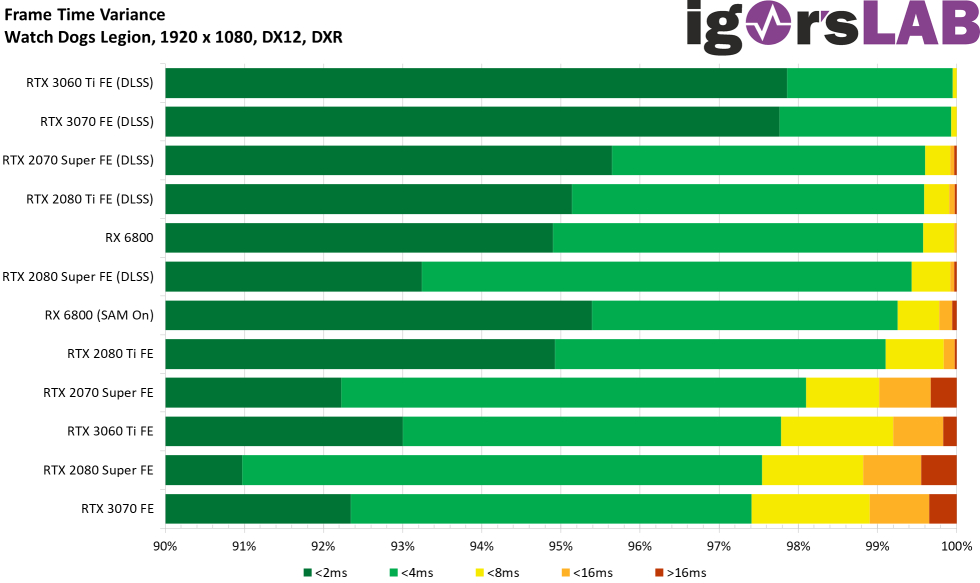
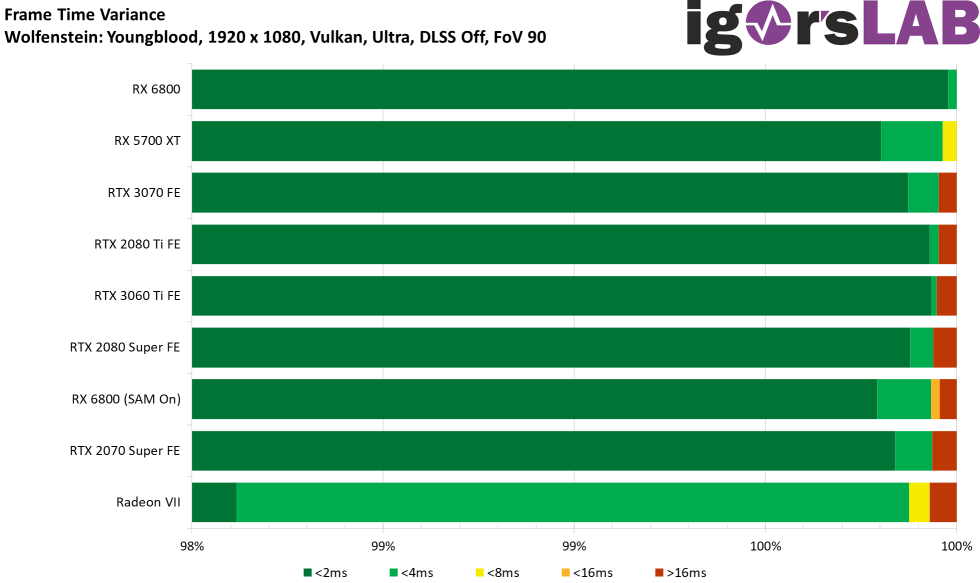
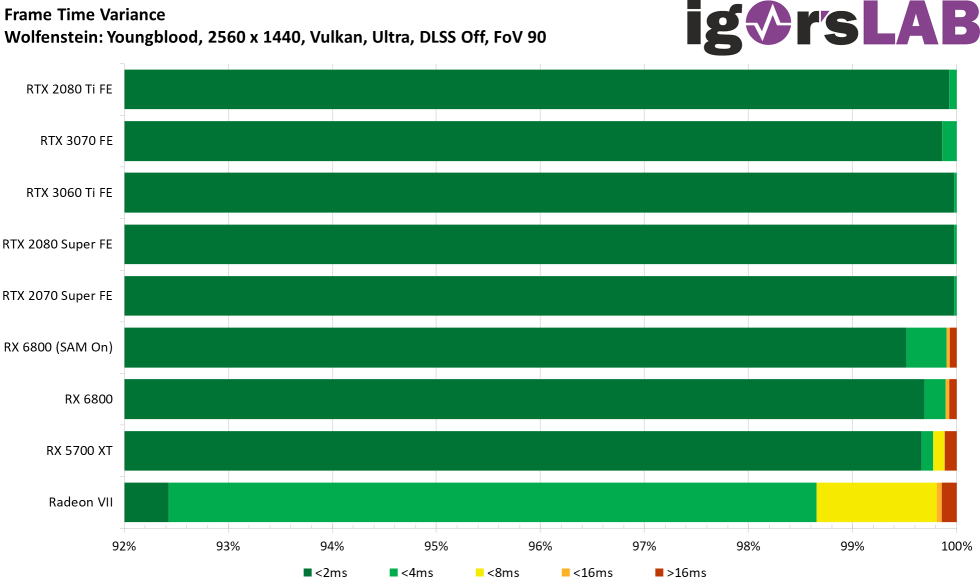
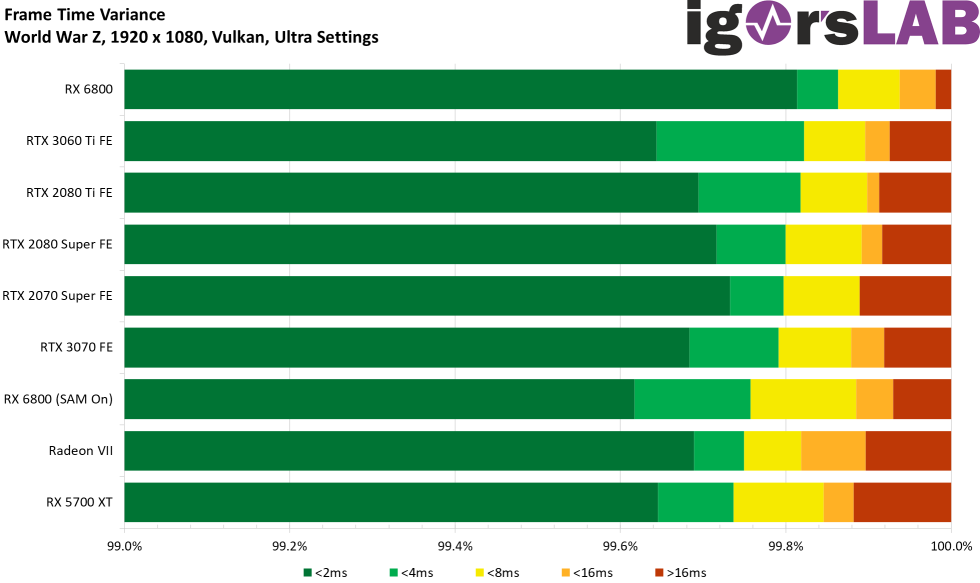
Frame Time Variances of all games and resolutions as bars
And since the eye is known to perceive more than it likes, we must also talk again about the variances. 100 FPS don’t have to be 100 FPS, if instead of 100 frames rendered at the same speed, you see 50 frames rendered very fast, 40 frames rendered fast and 10 frames rendered slow. This is a rather non-round story called variance, which is the time difference between two consecutive frames. This in turn must be displayed as a bar chart.


- 1 - Einführung und Testsystem
- 2 - Teardown, Platinenanalyse und Kühler
- 3 - Gaming Performance Full-HD
- 4 - Gaming Performance WQHD
- 5 - Detailauswertungen alle Spiele
- 6 - Workstation: CAD
- 7 - Studio: Rendering
- 8 - Studio: Video- und Bildbearbeitung
- 9 - Leistungsaufnahme und Effizienz der Einzelspiele
- 10 - Leistungsaufnahme: Übersicht & Netzteil-Empfehlung
- 11 - Temperaturen und Infrarot-Tests
- 12 - Geräuschemission / Noise
- 13 - NVIDIA Broadcast - Mehr als nur eine Spielerei?
- 14 - Zusammenfassung. Features und Fazit


Kommentieren