


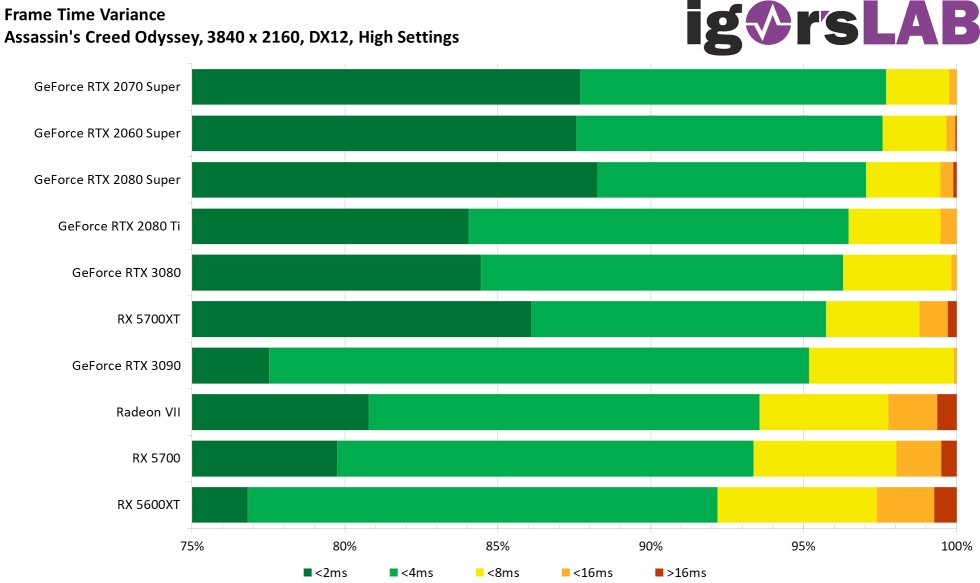
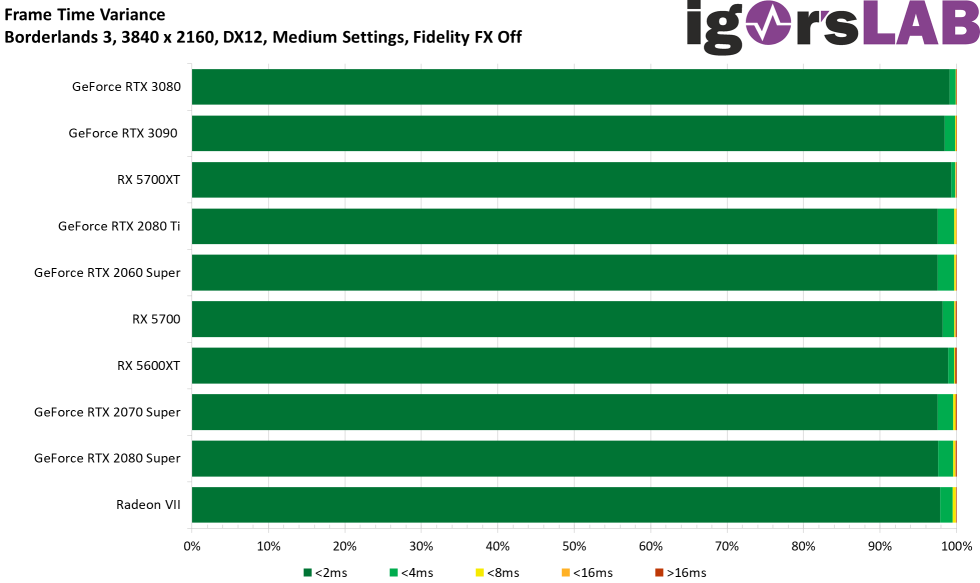
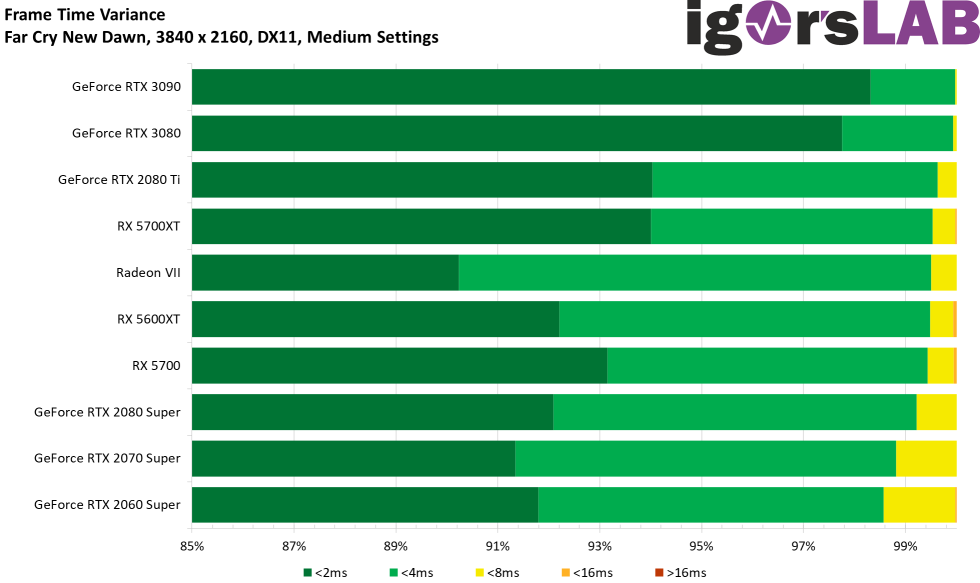
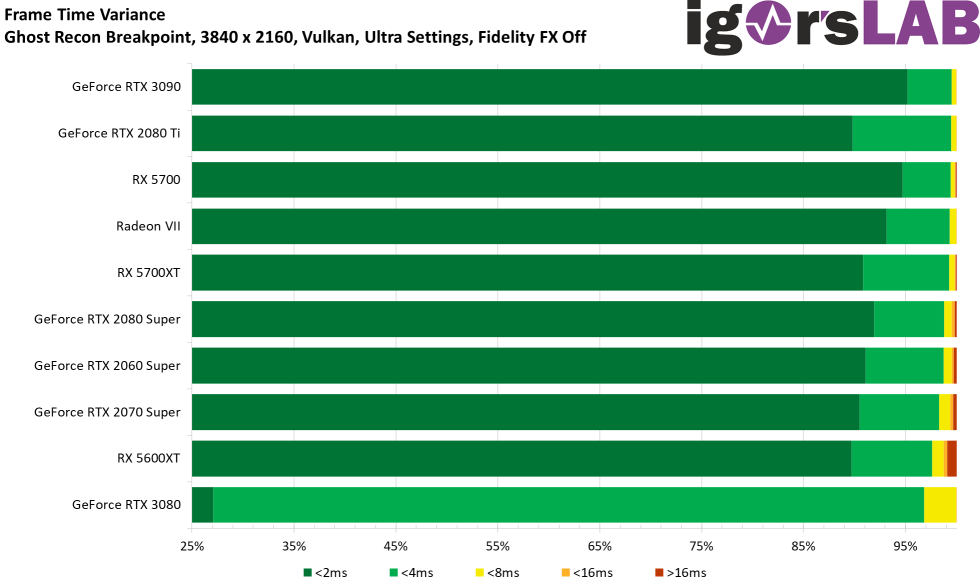
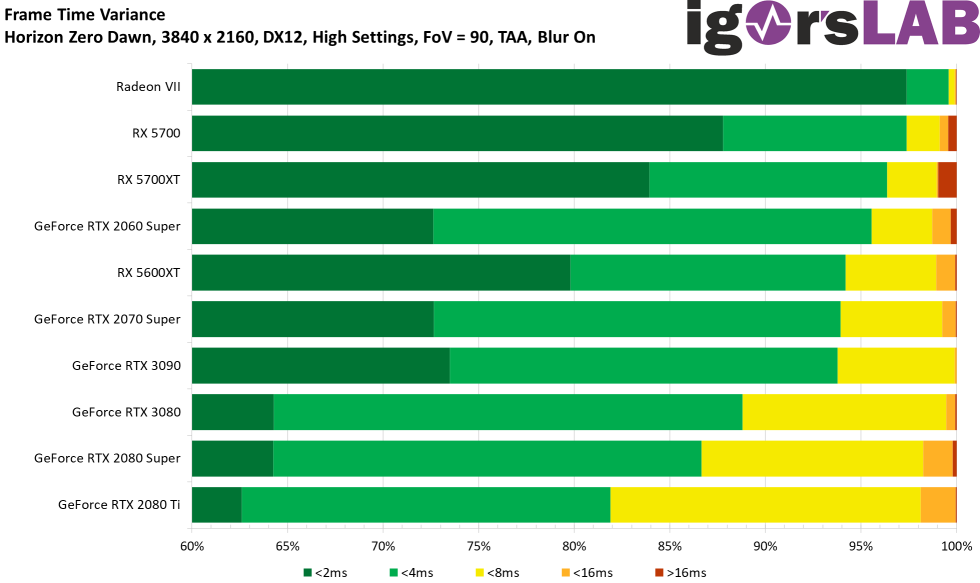
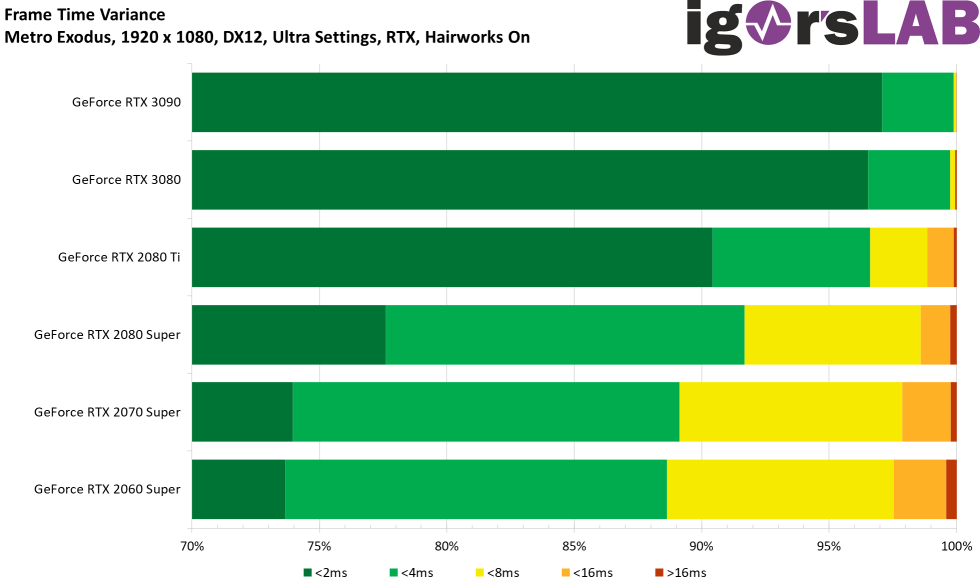
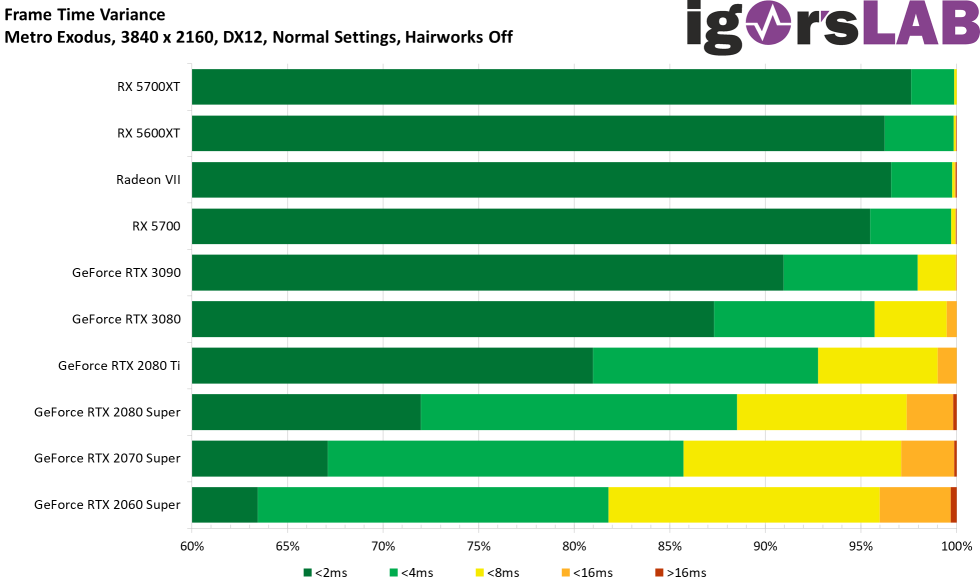
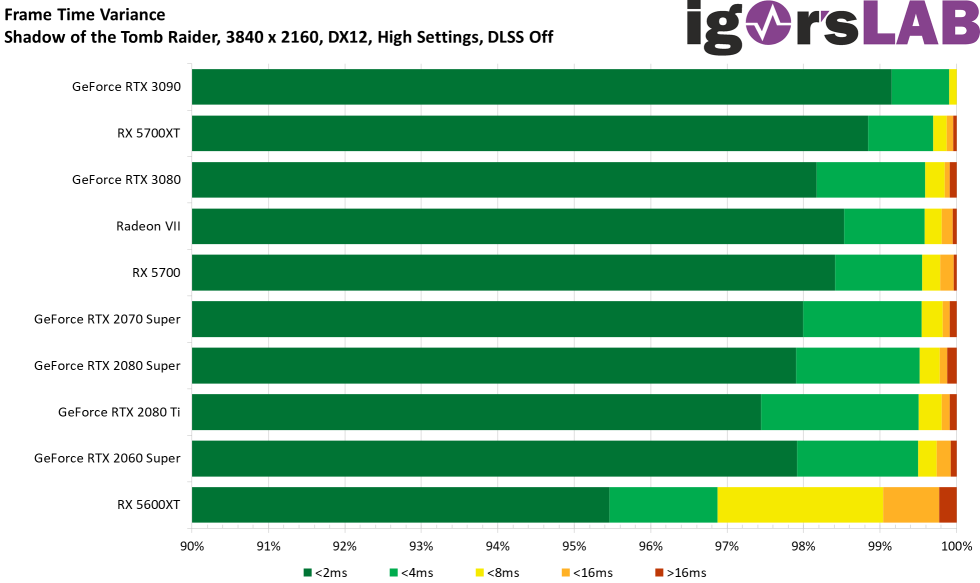
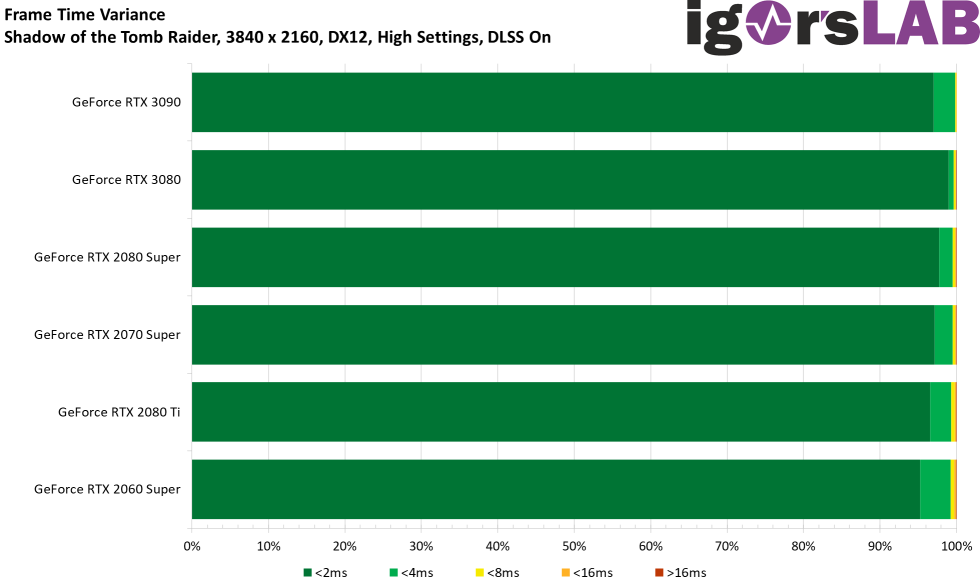
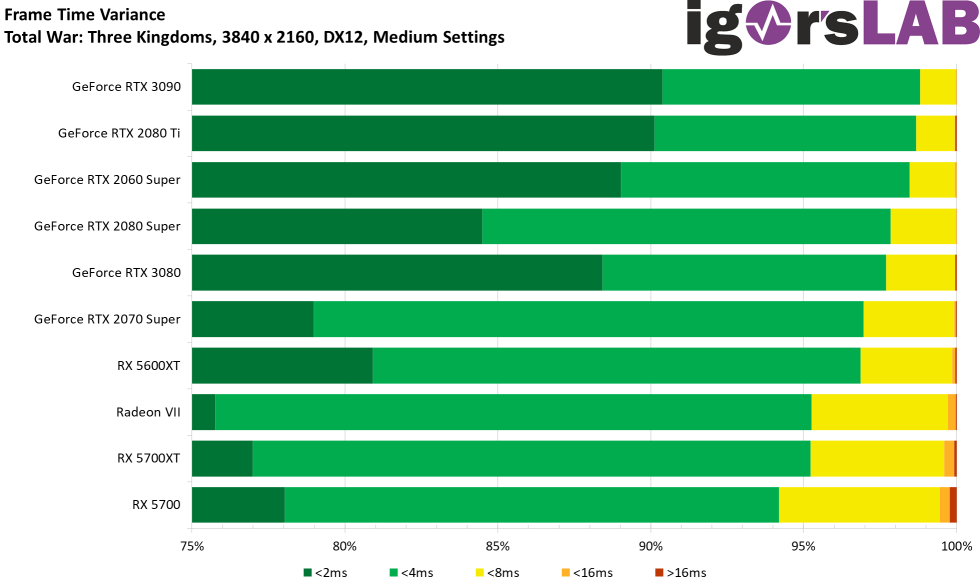
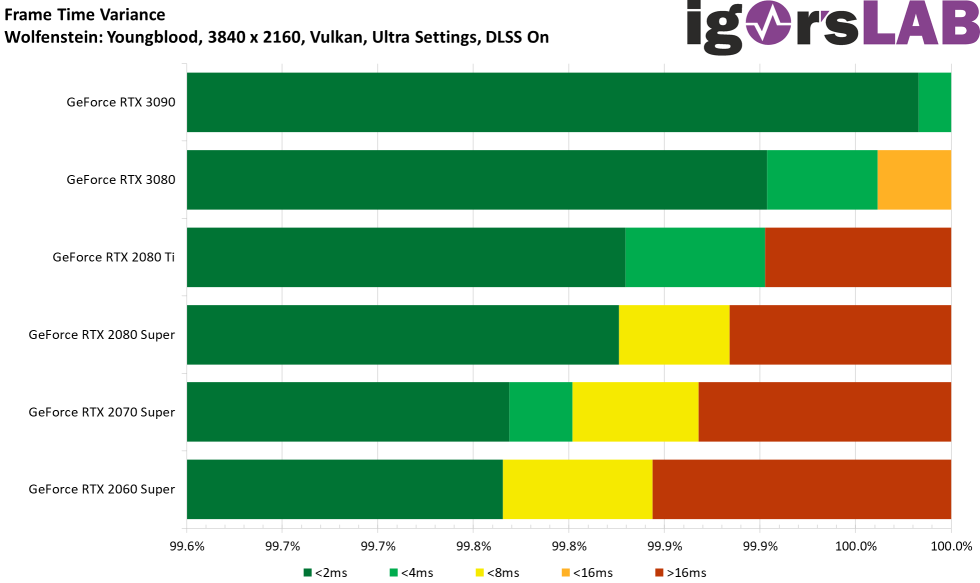
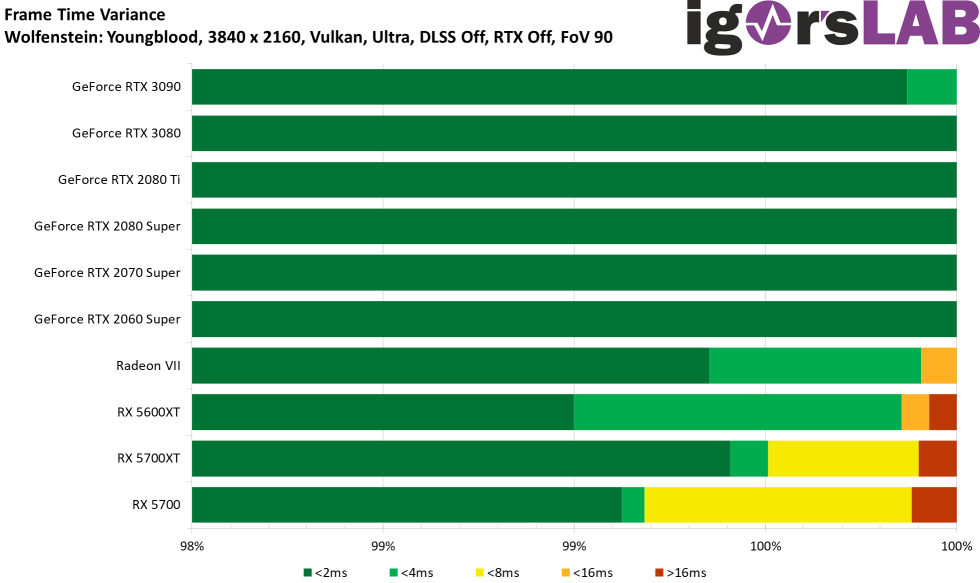
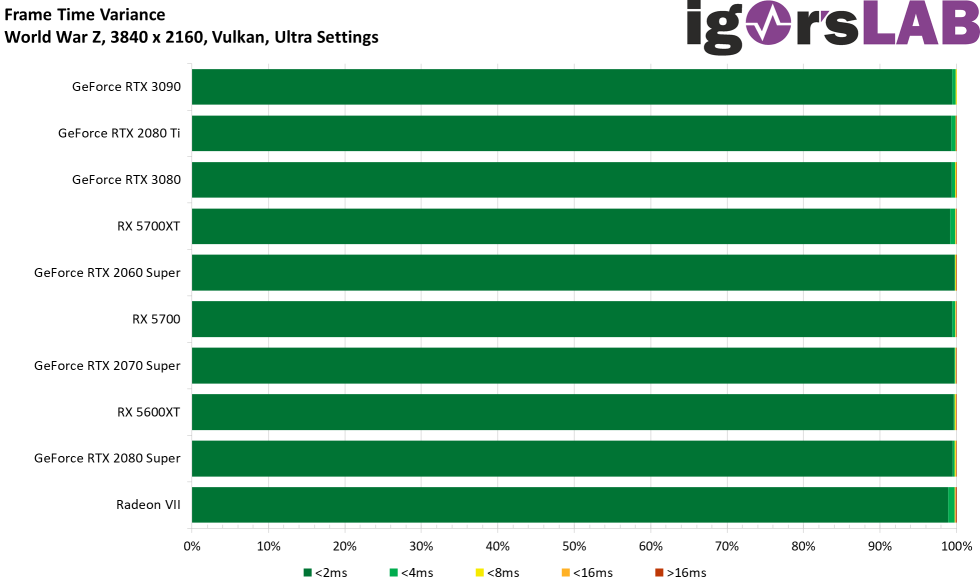
And since the eye is known to perceive more than it likes, we must also talk again about the variances. 100 FPS don’t have to be 100 FPS, if instead of 100 equally fast rendered frames you see 50 very fast rendered, 40 fast rendered and 10 slow rendered frames. This is a rather non-round story called variance, which is the time difference between two consecutive frames. This in turn must be displayed as a bar chart.
We see that the GeForce RTX 3080 performs “worse” than the RTX 3090 in some games and also some supposedly slower cards. The GeForce RTX 3090 helps the significantly larger memory expansion in any case to a “rounder” and smoother image flow. This is even subjectively noticeable (blind test with 3 persons).
- 1 - Intro, Unboxing and Test System
- 2 - Teardown, PCB and Cooler
- 3 - Gaming-Performance: FPS in Ultra-HD, DLSS and RTX On
- 4 - Gaming-Performance: FPS Curves
- 5 - Gaming-Performance: Percentile as Curves
- 6 - Gaming-Performance: Frame Time Curves
- 7 - Gaming-Performance: Frame Time Bar Charts
- 8 - Gaming-Performance: Variances
- 9 - Frame Times vs. Power Consumption
- 10 - Workstation: CAD
- 11 - Studio: Rendering
- 12 - Studio: Video- and Image Editing
- 13 - Power Consumption: GPU and CPU in all Games
- 14 - Page Title :Power Consumption: CPU in all Games (with Limits)
- 15 - Power Consumption: Efficiency in all Games
- 16 - Power Consumption: Summary, Details and PSU-Recommendation
- 17 - Clock Rate, OC, Temperatures and Thermal Imaging
- 18 - Fan Speed and Noise Level (Chamber)
- 19 - NVIDIA Broadcast - More than a Gimmick?
- 20 - Summary and Conclusion


Kommentieren