


For example, the result of the 3ds-max run is somewhat questionable. I manually ported the single tests of SEPCapc for the 2015 version to 2016 and ran parts of it. The performance almost exactly matches the results of the 2015 benchmark when you only see the graphics card.
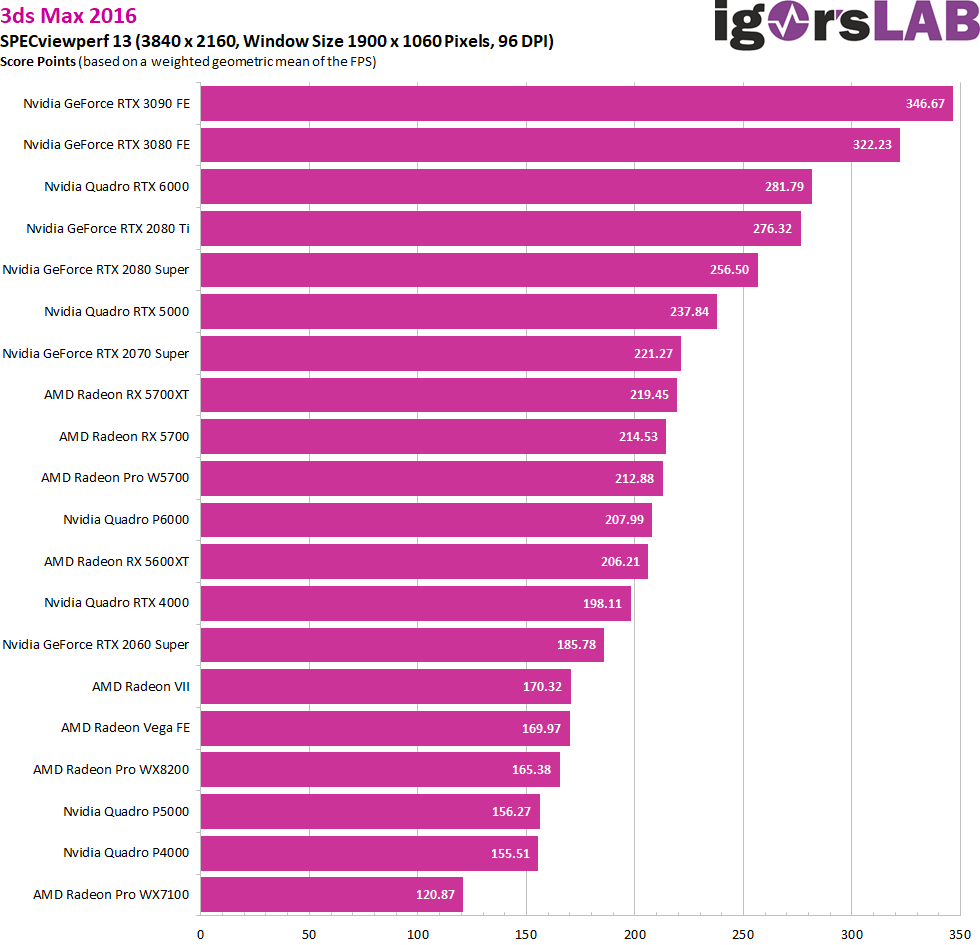
The SPECapc for 3ds Max 2015 is a performance evaluation software and includes 48 tests for comprehensive measurement of modeling, interactive graphics, visual effects, CPU and GPU performance. Features include DirectX 11 shader and vector maps, nitrous view improvements, and new dynamics and visual effects. Benchmark results are determined by calculating the total number of seconds required to perform each test based on a reference machine. The normalisation process provides a rating system where a higher score is better. I run the benchmark in maximum screen resolution (4K) and use 8x AA throughout. One should not be confused by the supposedly low score, as this is an overall index.
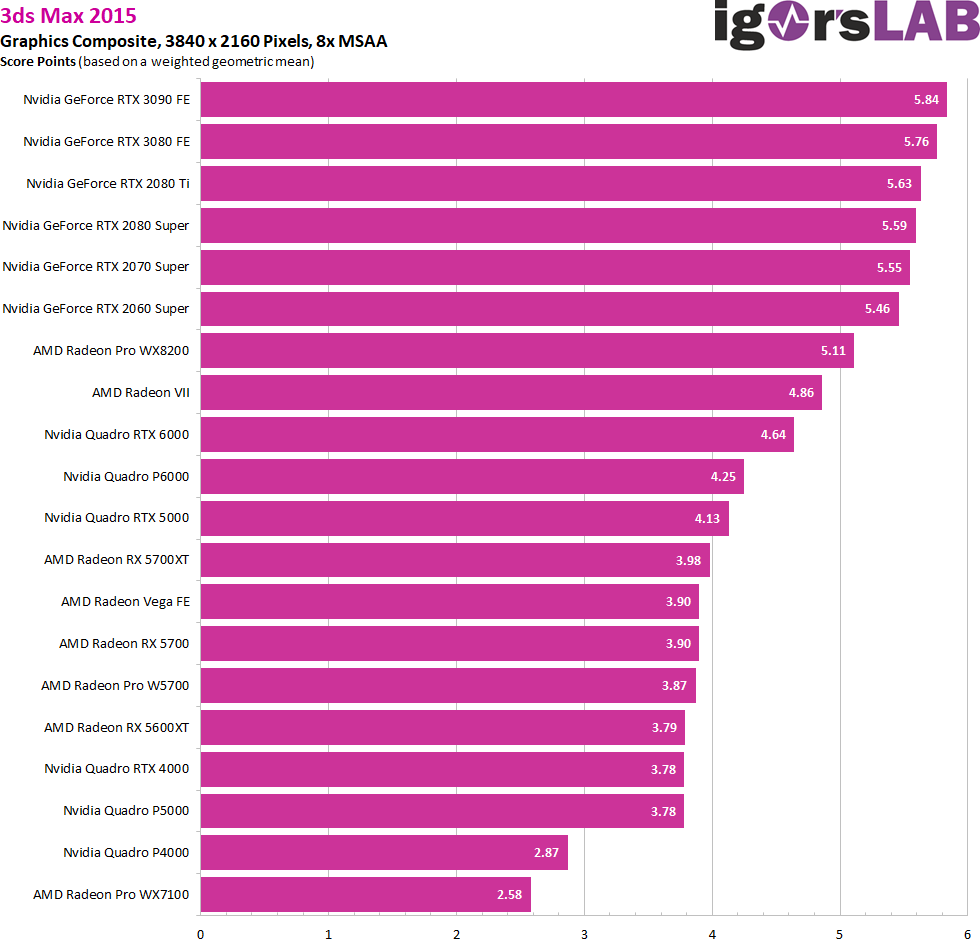
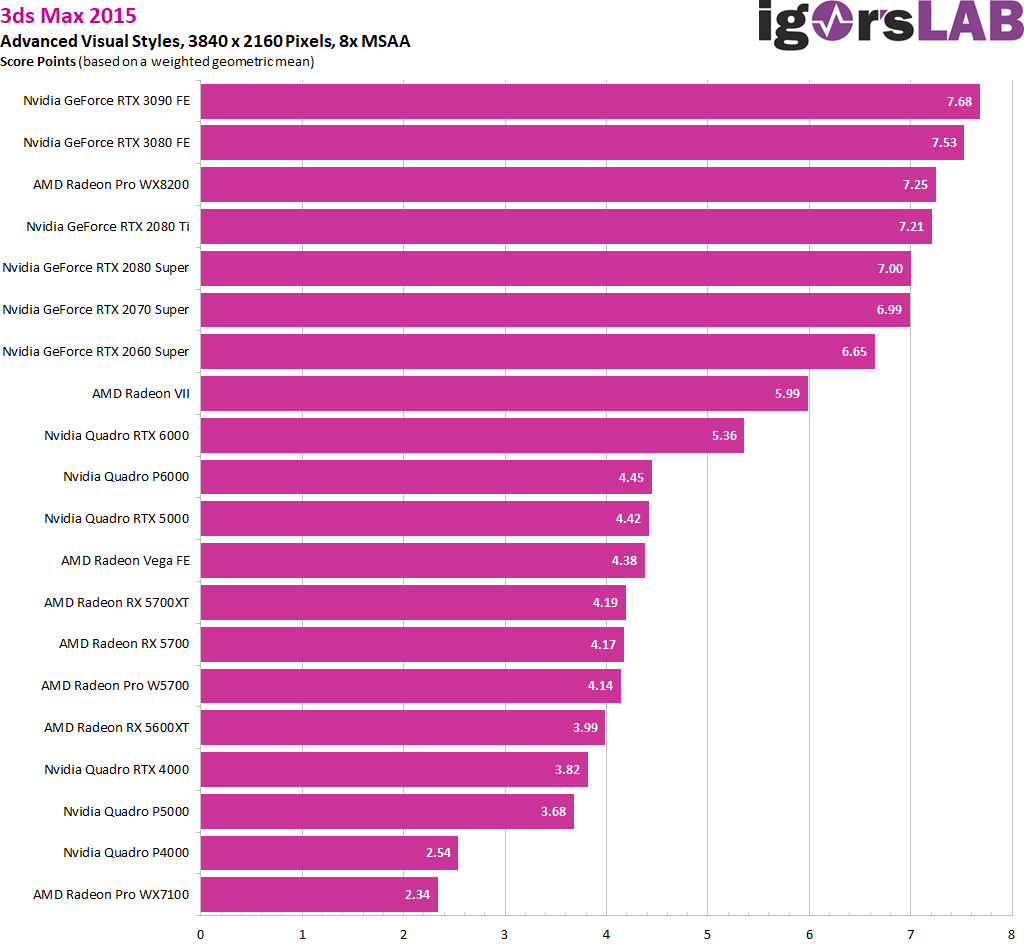
However, the GeForce RTX 3090 still shows the superior graphics performance very impressively despite various lin’mits of the platform. The full expansion of the TU102 in the form of the Quadro RTX6000 is almost declassified.
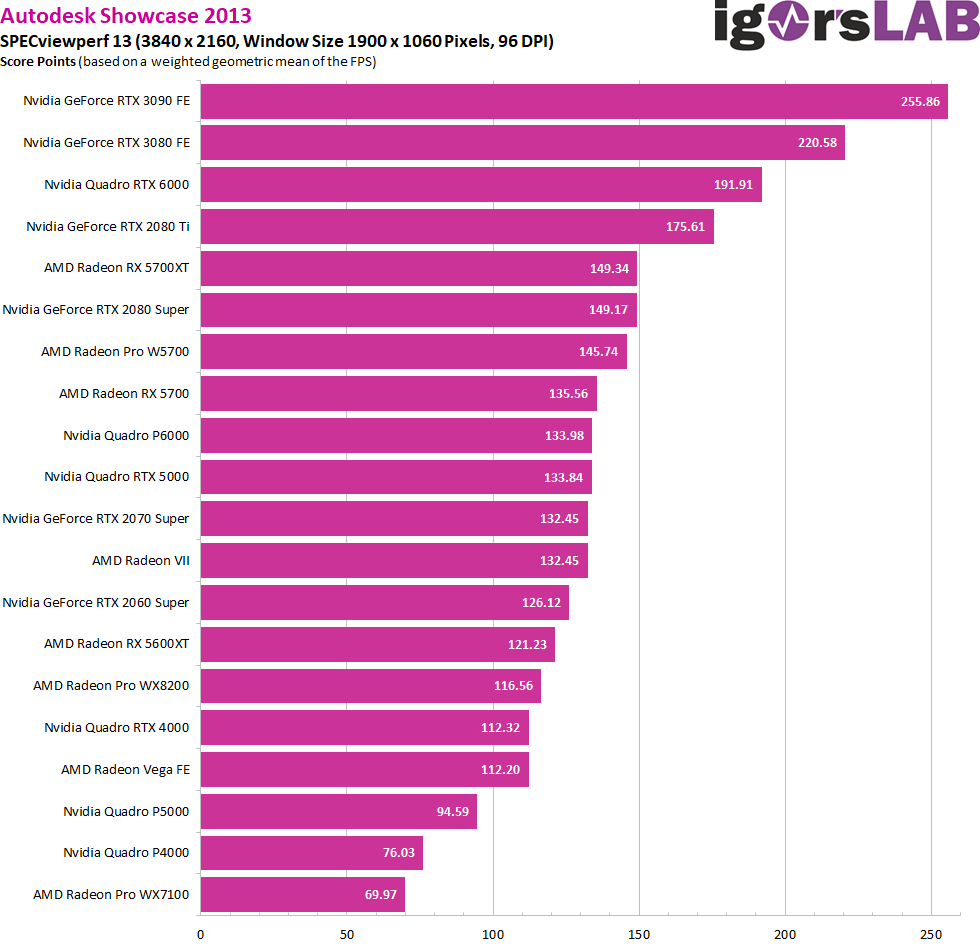
The same applies, even more so, to the older Showcase version, which relies on simple DirectX11. The difference to all other cards is almost frighteningly high.
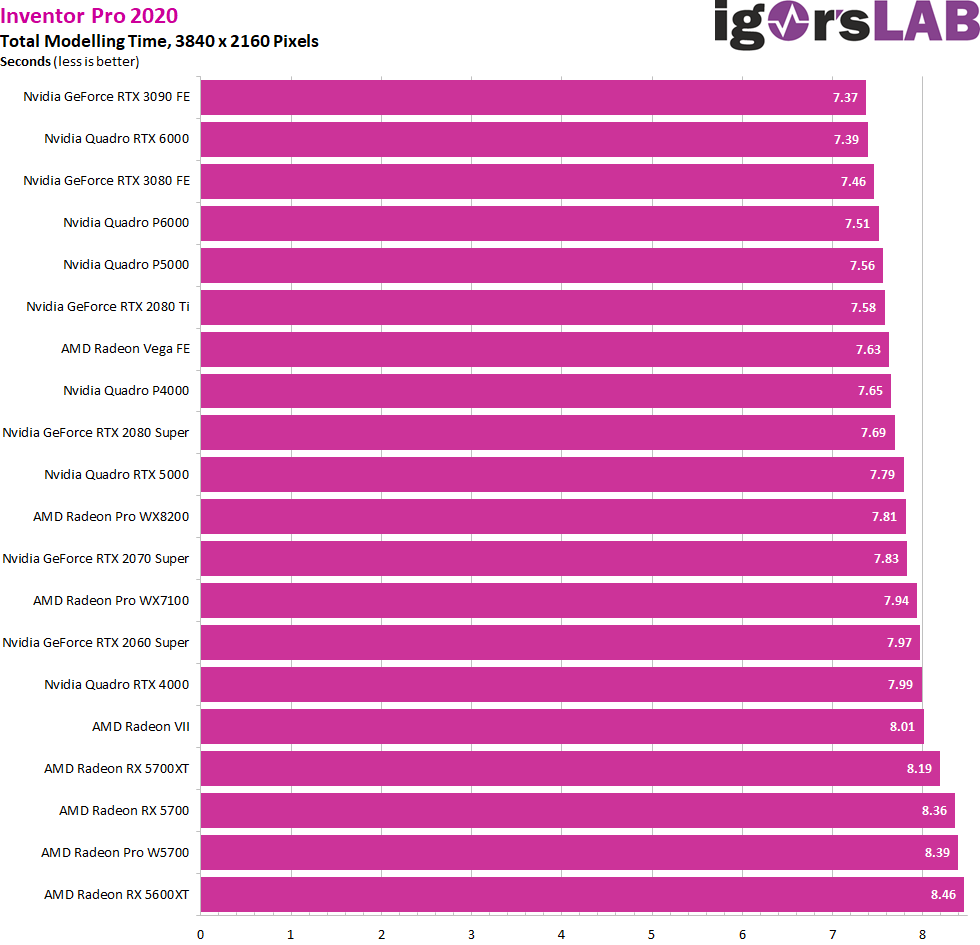
The benchmark for Inventor Pro 2020 is again a kind of total work of art for the entire system. The distance to the Quadro RTX 6000 is greater than its distance to the GeForce 2080 Ti. You don’t even have to think about the GeForce RTX 2080.
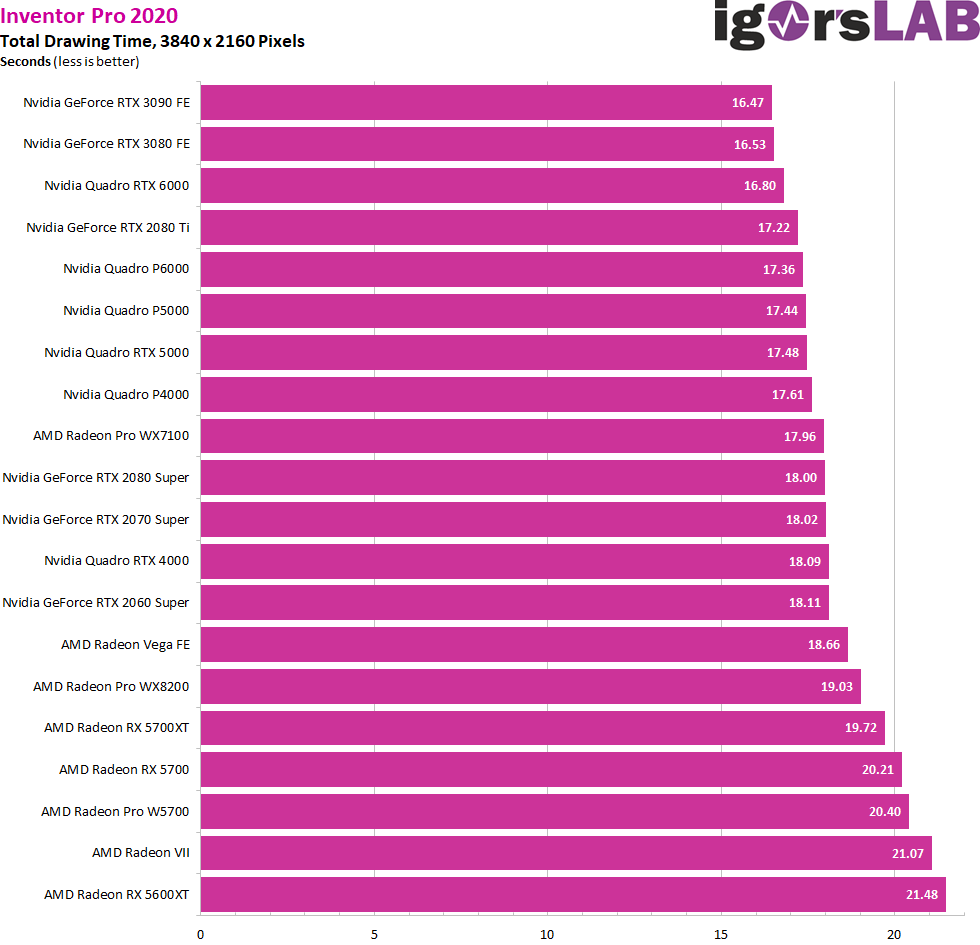
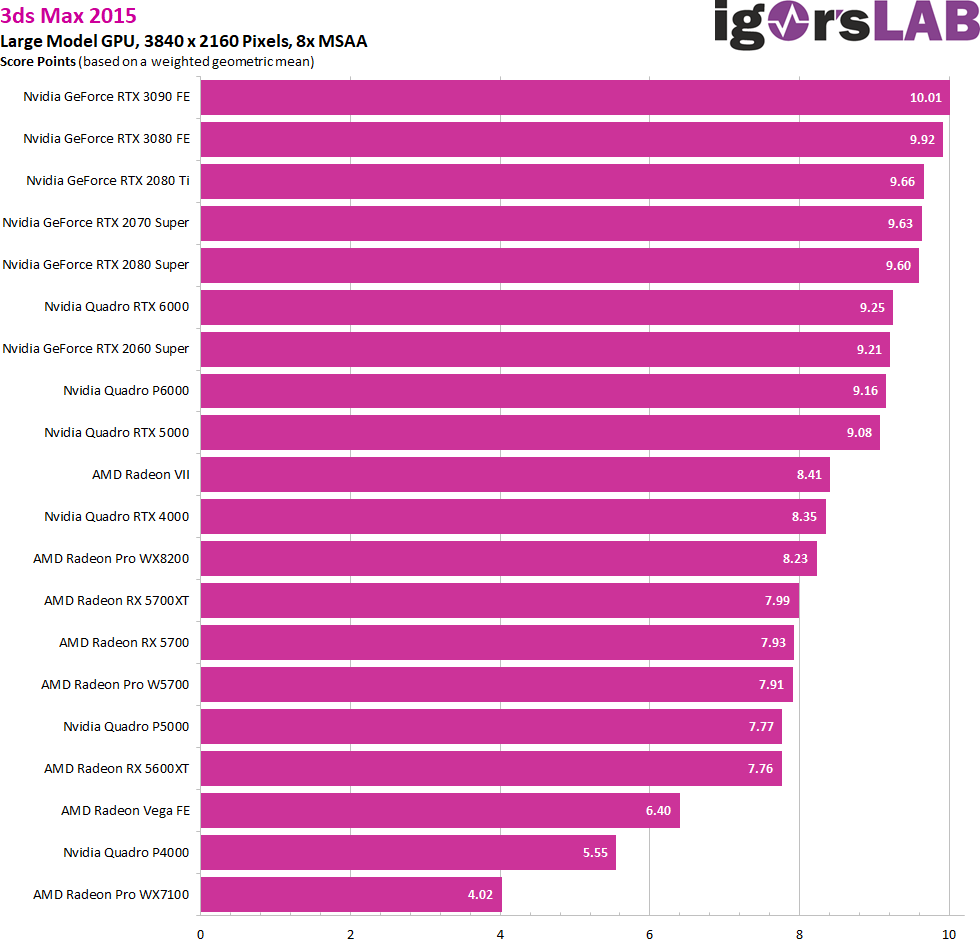
The same applies to the modelling time, although here of course the intervals are even smaller overall. the more complex the workload, the more the distances naturally increase. This then even happens in the same proportion, which pushes the strong cards forward immensely.
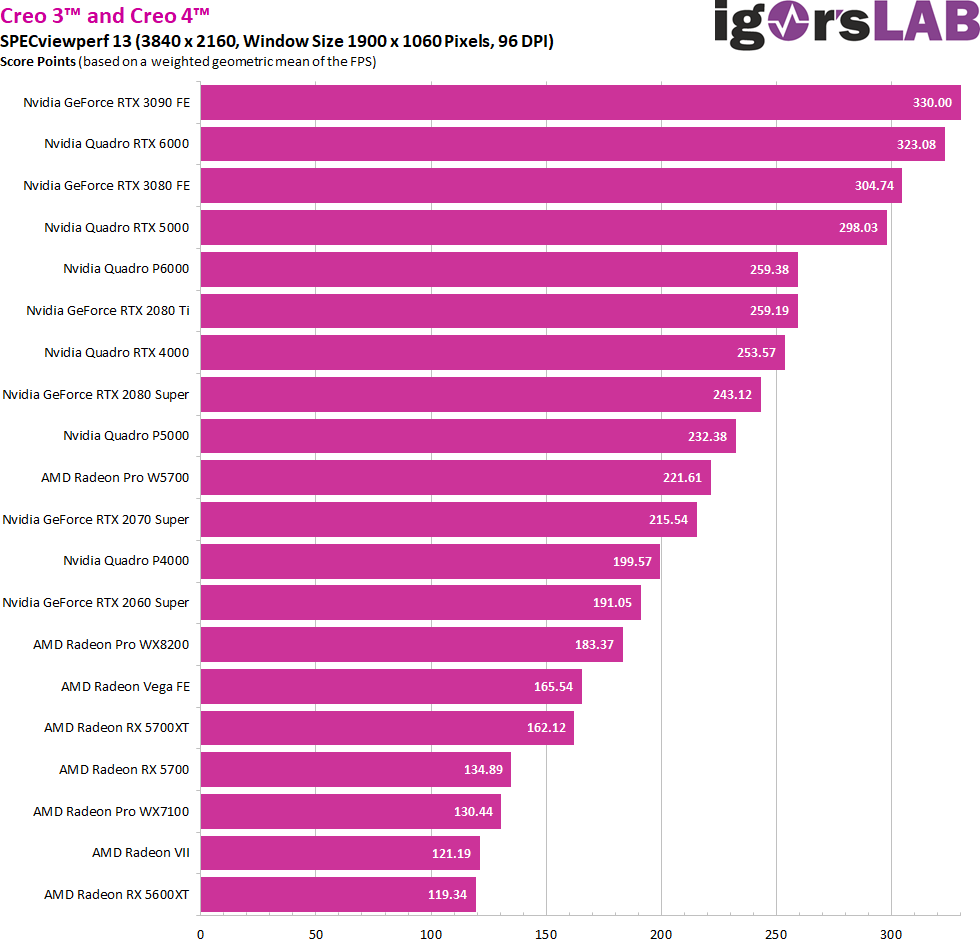
As long as no certified drivers are needed, Creo is a safe bank and even the RTX 6000 must fit.
- 1 - Intro, Unboxing and Test System
- 2 - Teardown, PCB and Cooler
- 3 - Gaming-Performance: FPS in Ultra-HD, DLSS and RTX On
- 4 - Gaming-Performance: FPS Curves
- 5 - Gaming-Performance: Percentile as Curves
- 6 - Gaming-Performance: Frame Time Curves
- 7 - Gaming-Performance: Frame Time Bar Charts
- 8 - Gaming-Performance: Variances
- 9 - Frame Times vs. Power Consumption
- 10 - Workstation: CAD
- 11 - Studio: Rendering
- 12 - Studio: Video- and Image Editing
- 13 - Power Consumption: GPU and CPU in all Games
- 14 - Page Title :Power Consumption: CPU in all Games (with Limits)
- 15 - Power Consumption: Efficiency in all Games
- 16 - Power Consumption: Summary, Details and PSU-Recommendation
- 17 - Clock Rate, OC, Temperatures and Thermal Imaging
- 18 - Fan Speed and Noise Level (Chamber)
- 19 - NVIDIA Broadcast - More than a Gimmick?
- 20 - Summary and Conclusion


Kommentieren