


Temperature behaviour under load
Let's first look at how temperatures develop. The advantage of the Direct Heat Exhaust (DHE) concept is clearly visible, as the final temperature is roughly the same and the increase in indoor gaming is initially even slower thanks to the fresh air supply. Otherwise, the curves are very similar, which also proves that the card is well suited for closed housings and for use in the tightest of spaces.
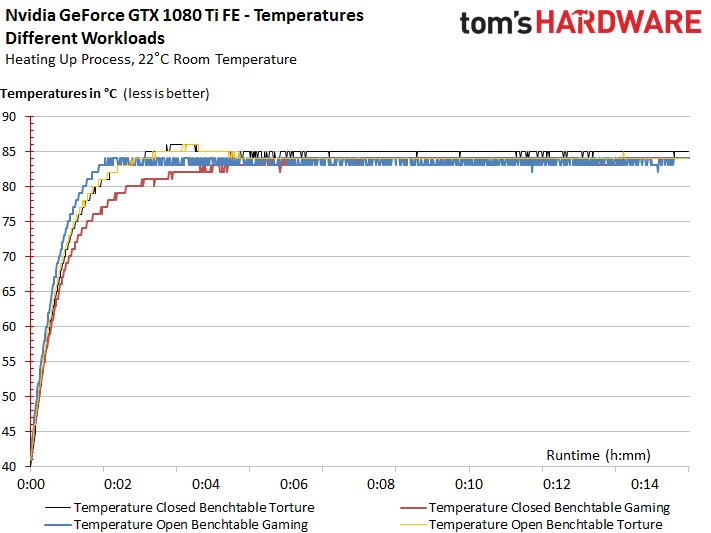
Based on the power consumption values and the clock rates at the respective temperatures, we were also able to prove that the map runs into a temperature limit in any case, just like the Titan X Pascal at the time. Of course, we also use our high-resolution infrared technology to accurately document these temperatures, because in the end, not only the GPU temperature counts, but also that of the other components.
Warm-up in video and images
We tested the warm-up process for the gaming and torture loop once in the open structure and in the closed housing, so that four videos were created at the end. Since the original runtime would definitely have been too long for the viewer, we use the 10:1 time lapse, which significantly shortens the runtime per video. In the video, however, only the GPU temperature is displayed as the main measurement field.
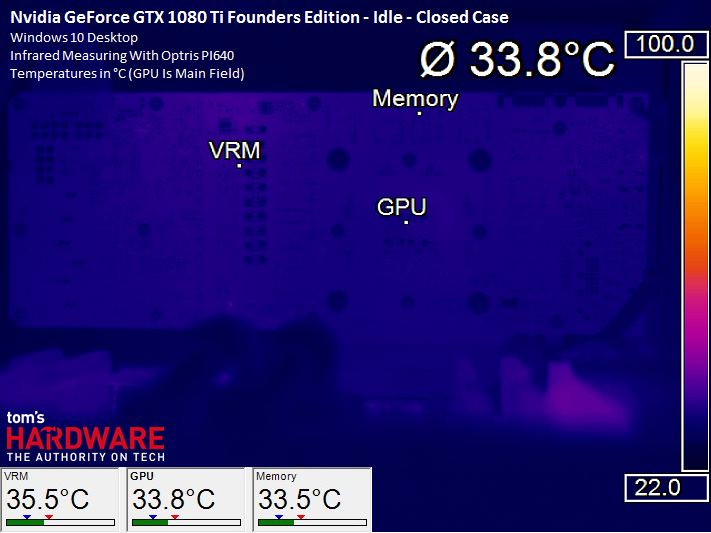
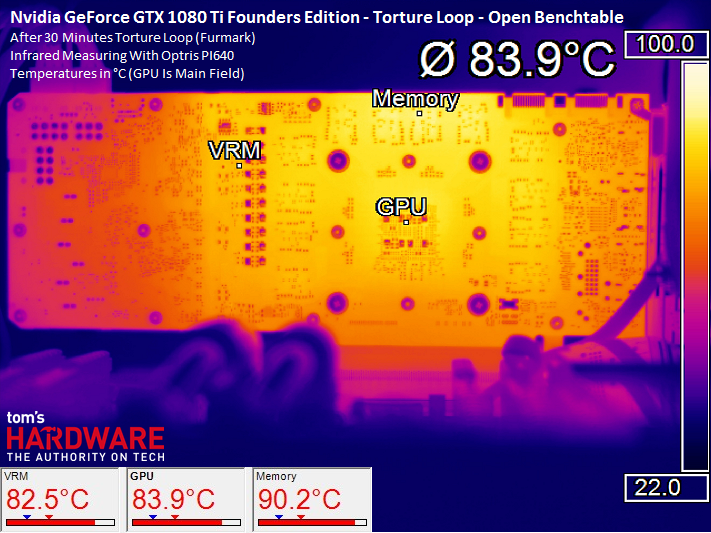
If all this went too fast or slow, you can now find the final result after the warm-up time as a still image for all scenarios with the further, important temperature values for voltage converters and memory.
Gaming Loop
In idle and at light load (browser, video) the worries with approx. 1000 rpm (and partly also significantly below) rotating fans for pleasant temperatures in the GTX microcosm.
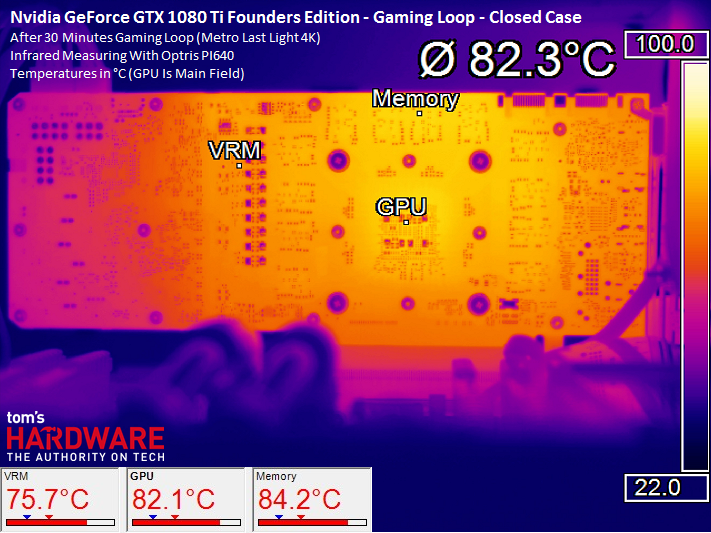
Once again, the measurements during heating under load confirm that it really does not (almost) matter where you install it in this map:
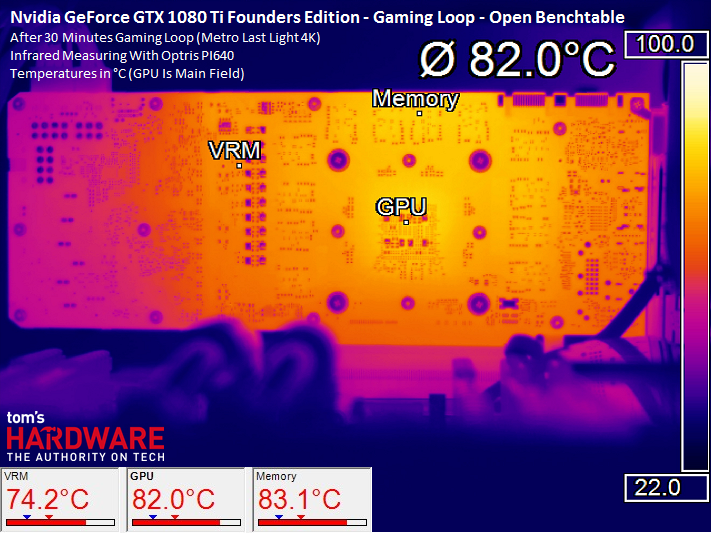 |
 |
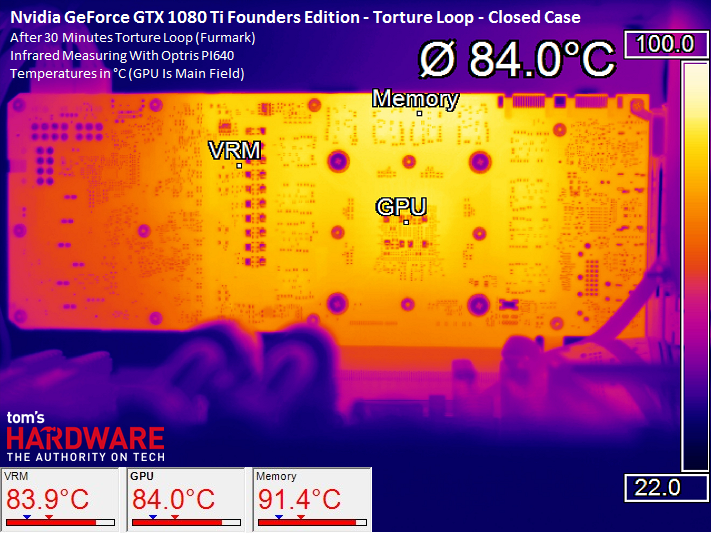
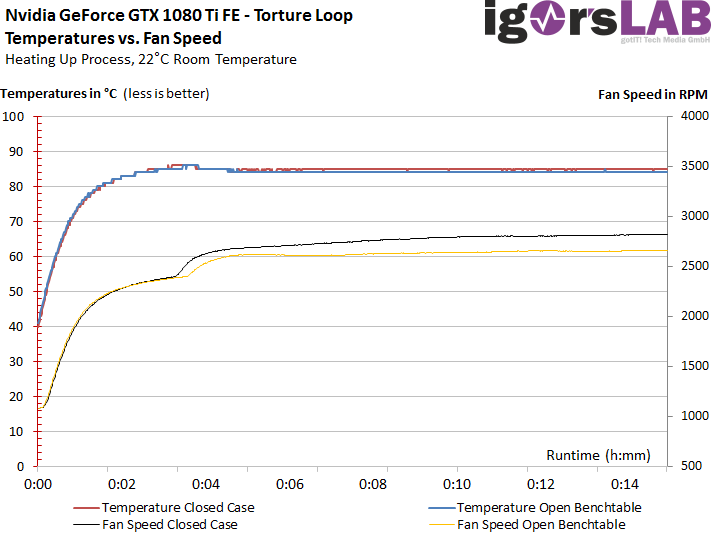
Torture Loop
Other loads, but same image. Only the memory is, where especially in gaming, approx. 1 Kelvin hotter. If this seems too much, please point out once again that the G5X memory has been specified by Micron up to 95°C and that you will hardly play Furmark.
 |
 |
Generally speaking, the cooling, especially that of the voltage converters, is quite confident, albeit acoustically a little dominant. We now see how loud it really is.
Noise emission ("volume")
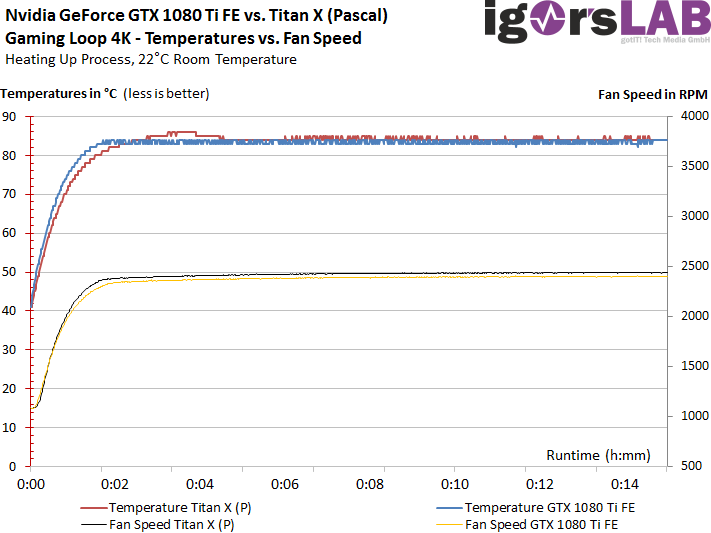
The operating noise in the warmed-up state is well audible, but despite everything still somewhere within the framework of what is just so tolerable. Quietly, however, things are different. First, let's put the fan speeds in relation to the temperature achieved in the gaming loop:
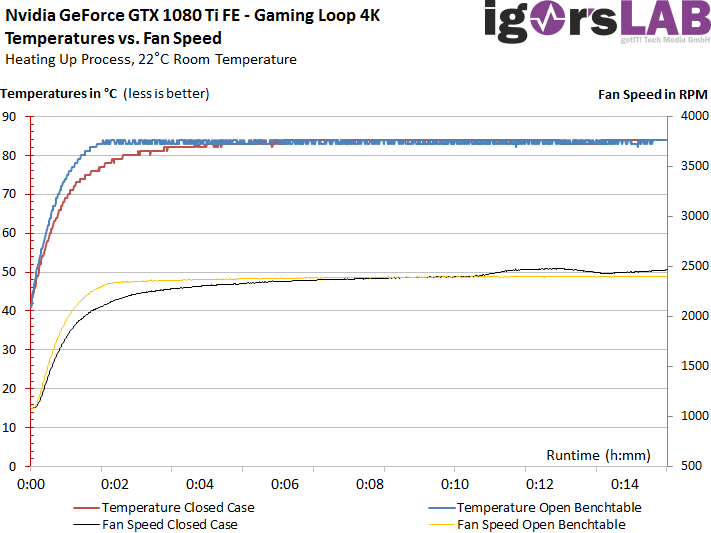
In the closed housing we notice that after a longer operating time the fan has to make another decent set upwards in order to keep the temperatures finally to the specified maximum.
If we look at the Titan X (Pascal) and the GeForce GTX 1080 Ti FE in direct comparison, we see virtually no difference, because the temperatures and fan speeds in the gaming loop are practically almost identical.
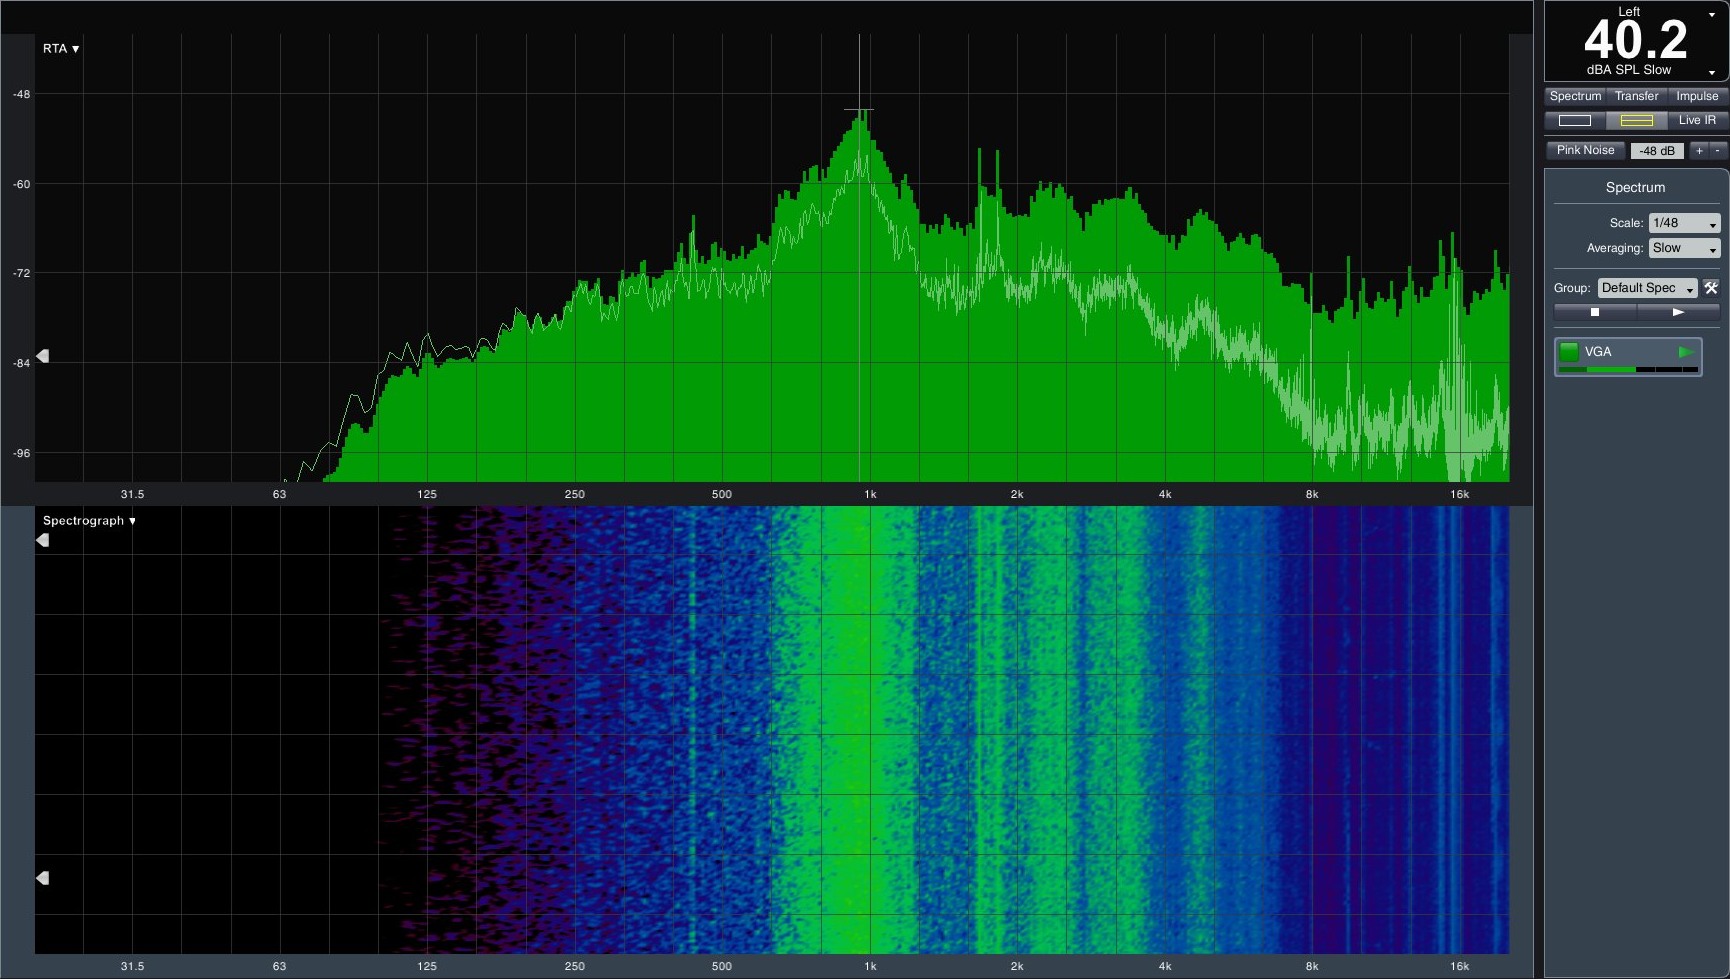
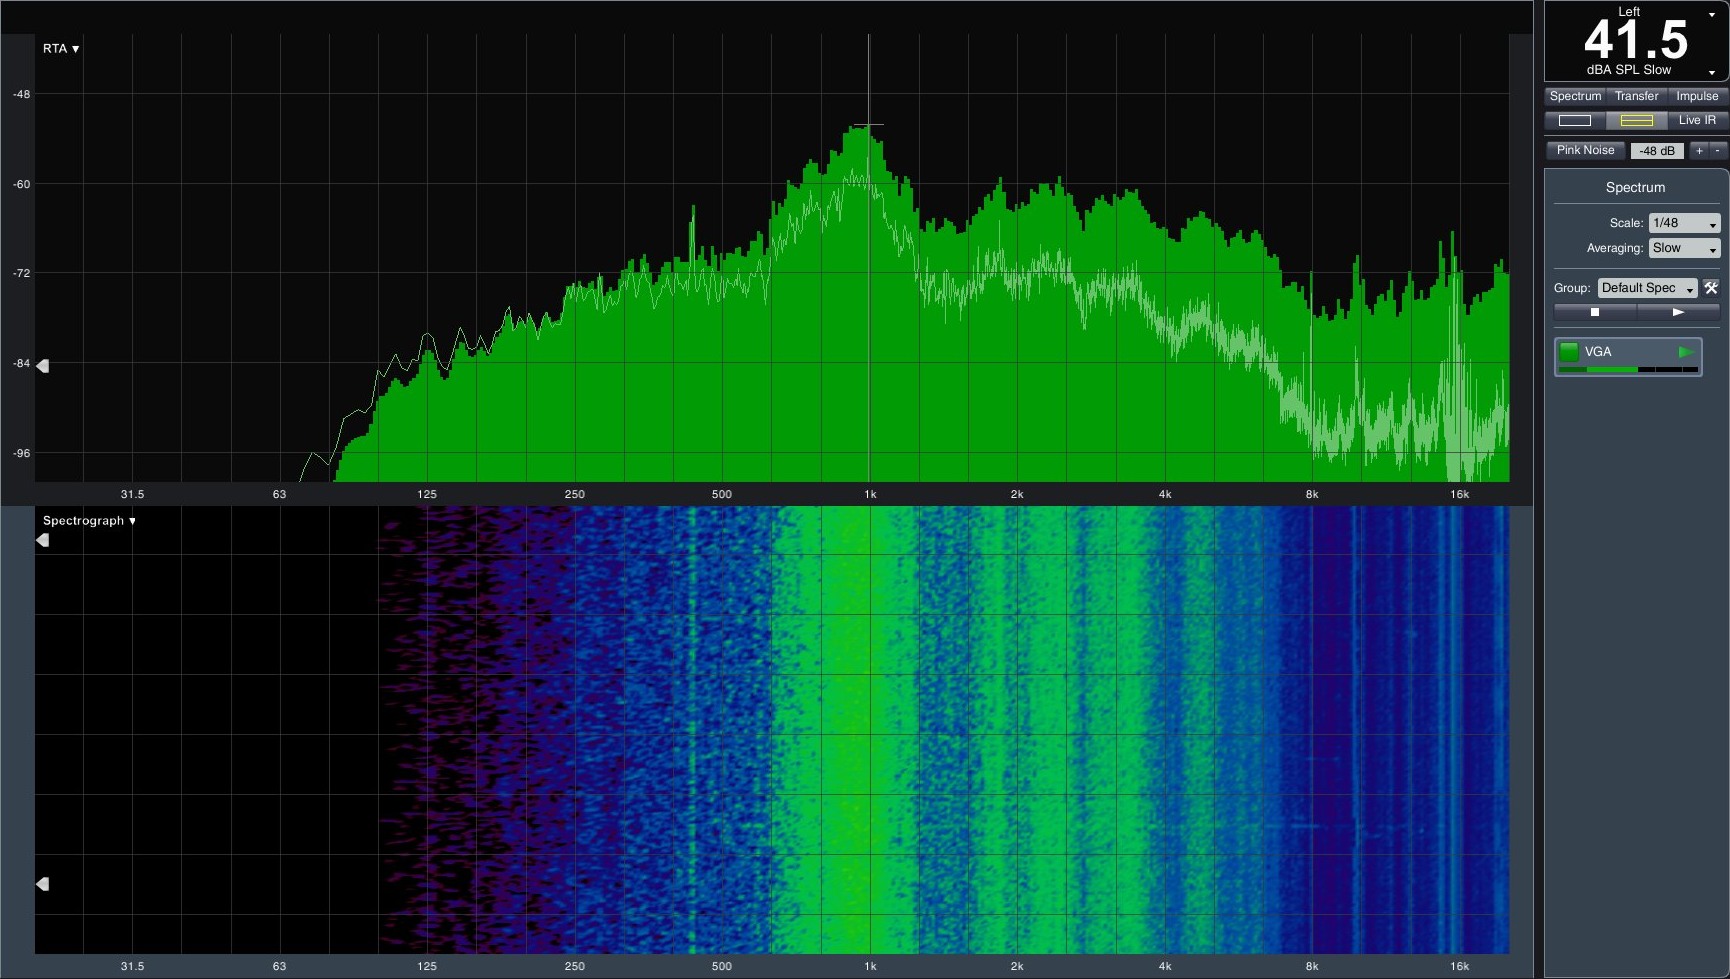
If Nvidia has perhaps really changed something physically on the radiator, then maximum at the respective air-flowing cooling chambers in the fan structure above the vapor-chamber, because the sound spectrum is slightly different from the Titan X (Pascal), although the subjective impression is absolutely congruent. The noise level is also almost the same and is only slightly higher after the final heating – despite slightly lower fan speeds. But the clock is a little higher for this and the rest could well be interpreted as a manufacturing tolerance.
In the Torture test, the level rises again a bit, although this is of course due to the fixed temperature target, that one wants to keep to Teufel komm out despite higher power consumption.
If you can draw an intermediate conclusion, then nothing is actually compared to the Titan X (Pascal) or that has hardly changed anything. Depending on your point of view, you can now find this good or less good.
| Test systems and measuring rooms | |
|---|---|
| Thermography: |
Optris PI640, infrared camera PI Connect evaluation software with profiles |
| Acoustics: |
NTI Audio M2211 (with calibration file) Steinberg UR12 (with phantom power for the microphones) Creative X7, Smaart v.7 own low-reflection measuring room, 3.5 x 1.8 x 2.2 m (LxTxH) Axial measurements, perpendicular to the center of the sound source(s), measuring distance 50 cm Noise in dBA (Slow) as RTA measurement Frequency spectrum as a graph |


Kommentieren