


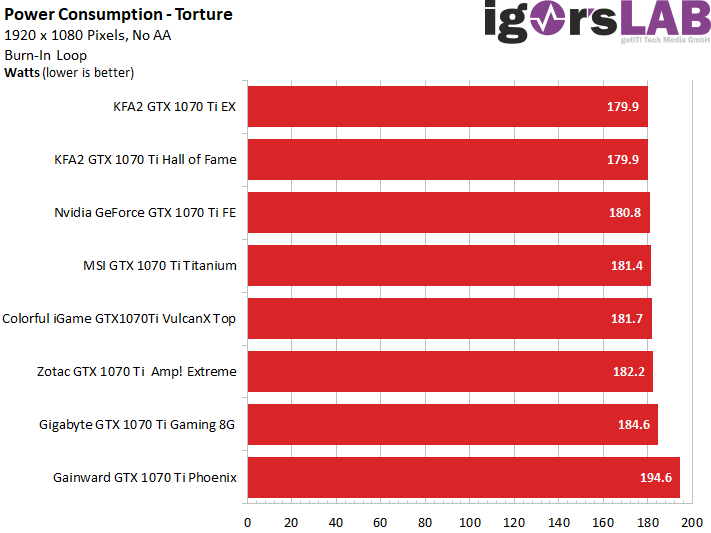
Power consumption
First of all, we compare all graphics cards in the main areas of gaming loop, stress test and idle in direct comparison, which lists all results in exactly this order as bar graphics:
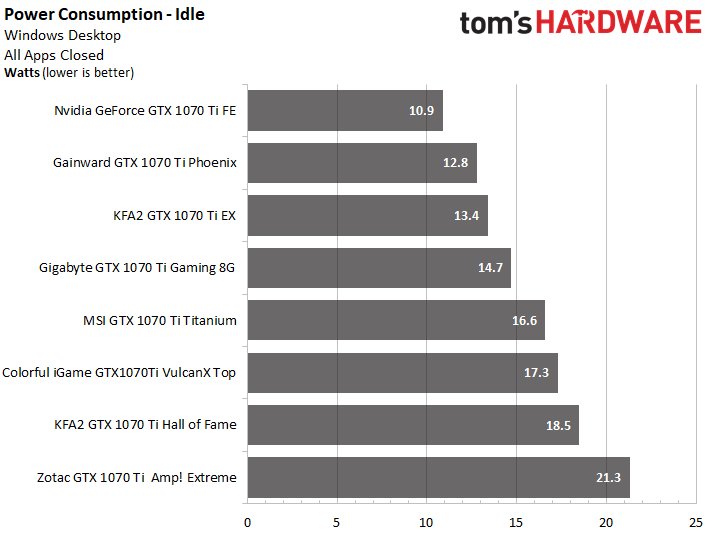
Depending on the power target set by the manufacturer, however, only negligible differences are usually measurable in gaming.
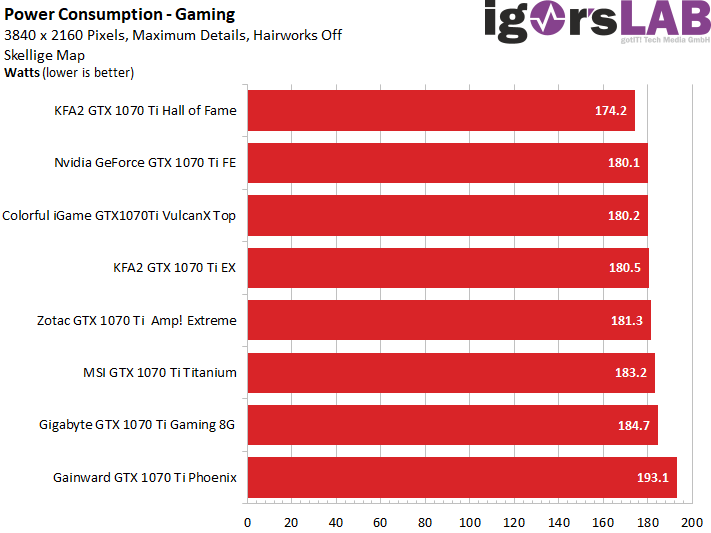
We also found that some cards with a rather tight power target had a slightly lower power consumption in the stress test due to down clocking. However, in none of the cases did this really negatively affect gaming performance, it only represents the absolute worst case.
Temperature behaviour
For this comparison, we share the bar graphics in gaming loop, stress test and the maximum reached temperatures of the voltage converter MOSFETs or other, absolute hot spots. The more detailed history curves and comments can be found on the individual tests corresponding pages for each map in this article.
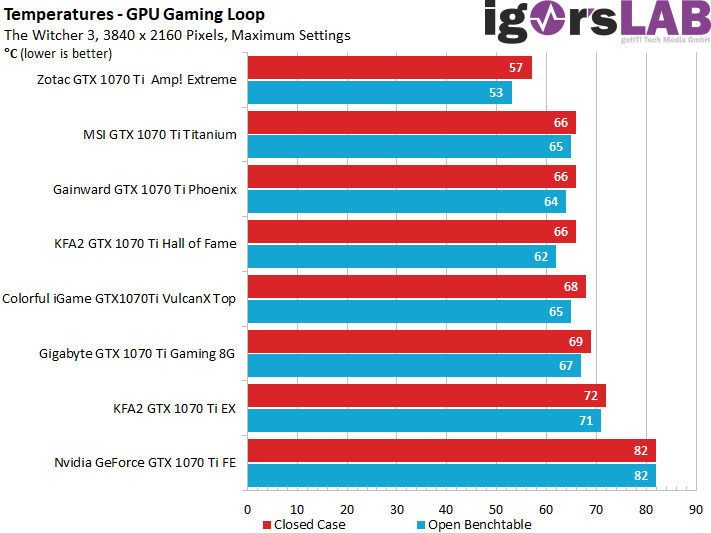
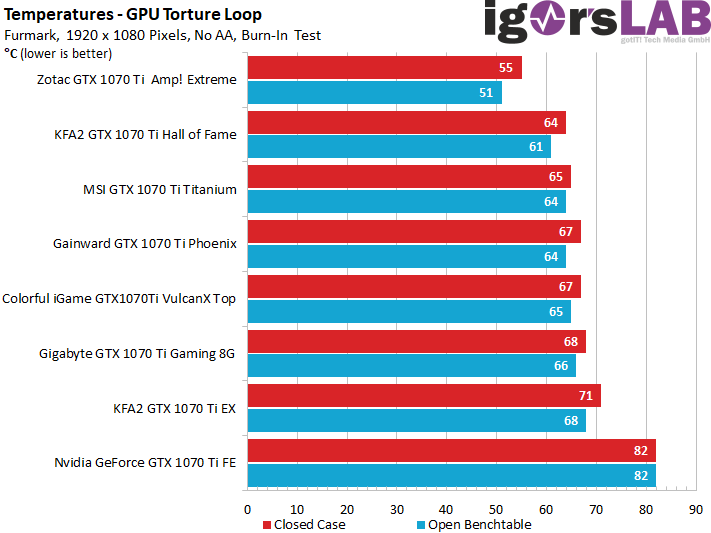
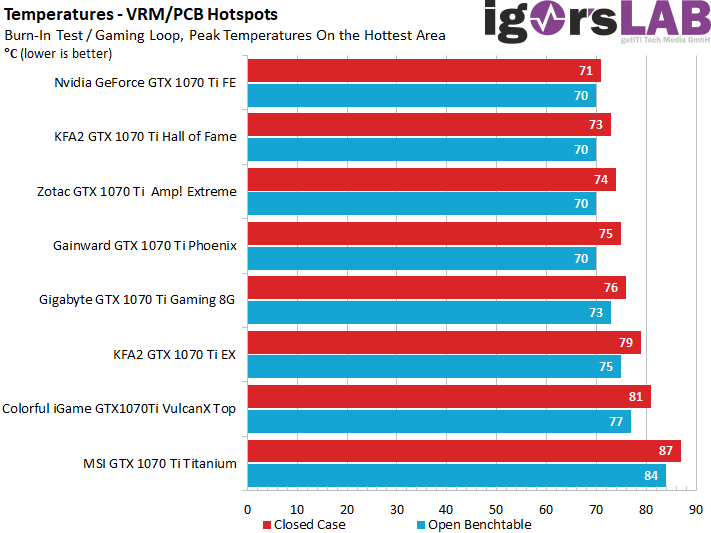
We reacted to the many reader opinions and compared the results of open benchtable and closed housing, so we had to perform each measurement twice. Nevertheless, the reference to reality gains enormously here and even weaknesses of some cooling designs are mercilessly visible.


Kommentieren