


CPUID powerMAX
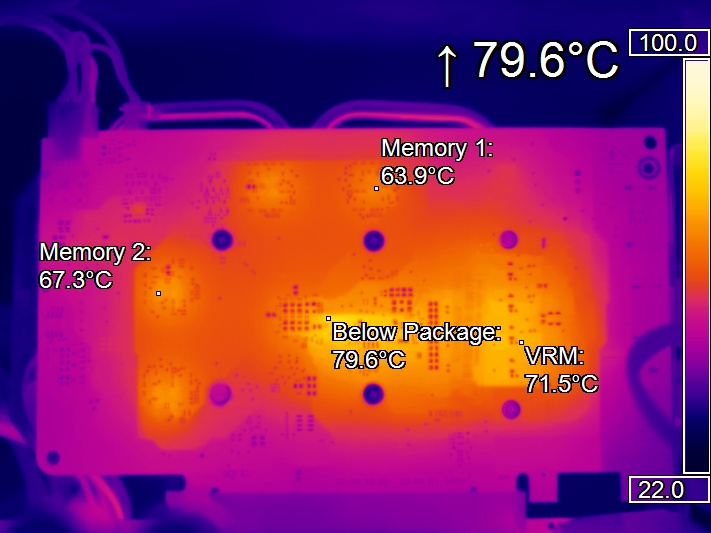
The combined CPU and GPU stress test still looks a little unfinished in the first version. This is also due less to the simple user interface or the rather limited range of functions, but to the actually procreative loads, which are not used anywhere for a real stability test. Even "powerMAX" still runs with overclocked graphics cards, when games have long since quit the service. And as a cooling test, not enough load is generated at the end. The free download is available here.

We will come back to this program during the CPU stress tests in the following article to test what goes then and whether it might even be useful for a combined stress test of GPU and CPU.
| Gpu |
Package |
Vrm |
Memory |
Performance |
|
|---|---|---|---|---|---|
| Reading |
64 °C | 79.6 °C | 71.5 °C | 67.3 °C | 96.2 W |
| Compared to The Max. |
98.5% | 88.3 % | 84.4 % | 92.6 % | 92.8 % |
| Review | – only medium power consumption – High GPU temperature for cooling tests – only average storage temperature – rather low VRM temperature |
||||
| Suitability | – supplementary stability tests – rather too weak for real stress tests |
||||
Aida64
The GPU stress test of Aida64 looks at first glance rather by average, because it does not achieve really absolute peak values in any of the measuring ranges. Load and temperatures are also rather below average. What makes Aida64 interesting, however, is the fact that it is a GPGPU implementation, i.e. a pure computational load that is not based on the usual fur cube donut mixture. The 30-day trial version can be downloaded here.
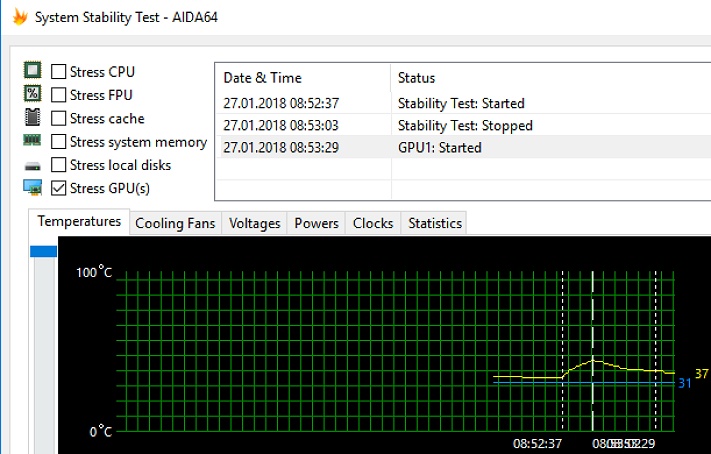
With Aida64 we were able to provoke mistakes during the stress test even when overclocking (calculation) errors, while Furmark, OCCT and other stress tests continued to run stable. Even a freeze or program crash can be an excuse to think about.
In addition to these stress tests, Aida64 is also well suited as a monitoring program and for reading out many values of the computer system, including various benchmarks. So if you want to know more about your PC, you can try it a little.
| Gpu |
Package |
Vrm |
Memory |
Performance |
|
|---|---|---|---|---|---|
| Reading |
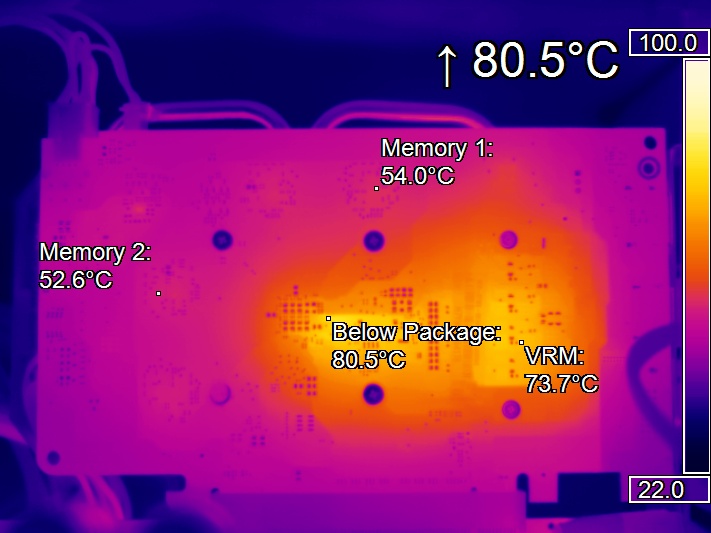
59 °C | 80.5 °C | 73.7 °C | 54.0 °C | 89.1 W |
| Compared to The Max. |
90.8% | 89.3 % | 87.0 % | 74.3 % | 85.9 % |
| Review | – low power consumption – Too low GPU temperature for cooling tests – comparatively low storage temperature – GPGPU instead of graphics load |
||||
| Suitability | – supplementary stability tests (computational load) – rather unsuitable for real stress tests |
||||
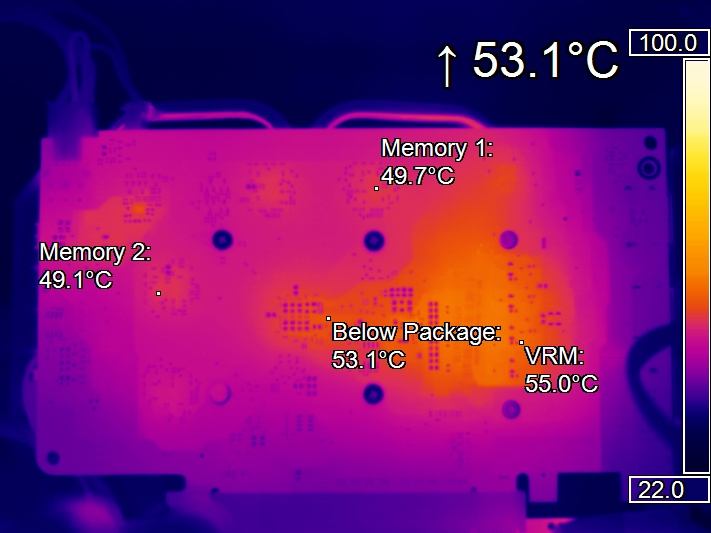
Heavy Load
Unfortunately, the name promises more than it can keep in reality, even if this tool is repeatedly praised and linked on many pages. We also go into this in the follow-up article on CPU and system loads, but for GPU tests, in whatever form, this program is definitely not to be used. If you still want to experiment with it, you can find it here.
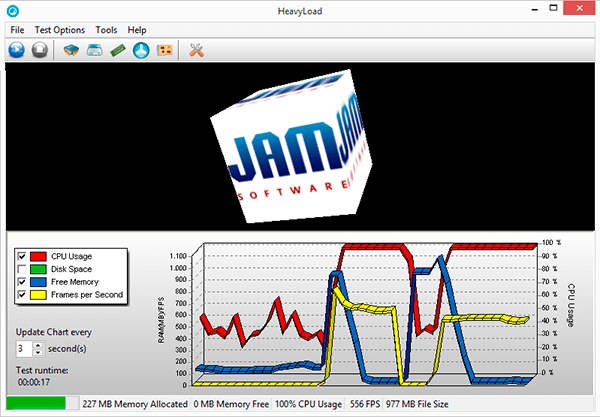
The GPU load generated was only between 25 and 35% at a time, which is also reflected in the power consumption and achievable temperatures. It is not useful to use as a real stability test for overclocked systems, nor for a system and cooler test. The data we log is actually self-explanatory.
| Gpu |
Package |
Vrm |
Memory |
Performance |
|
|---|---|---|---|---|---|
| Reading |
50 °C | 53.1 °C | 55.0 °C | 49.7 °C | 37.2 W |
| Compared to The Max. |
76.9% | 88.3 % | 84.4 % | 92.6 % | 35.9 % |
| Review | – too low power consumption – Too low GPU temperature for cooling tests – too low storage temperature – Too low VRM temperature – no real loads |
||||
| Suitability | – completely unsuitable | ||||
- 1 - Einführung und Testsystem
- 2 - Witcher 3, Doom (2016), Metro LL
- 3 - 3DMark Fire Strike, Time Spy, Sky Diver
- 4 - Unigine Valley, Unigine Superposition
- 5 - Furmark, OCCT
- 6 - MSI Kombustor
- 7 - powerMAX, Aida64, Heavy Load
- 8 - Leistungsaufnahme und GPU-Temperaturen
- 9 - Komponenten-Temperaturen (Memory, VRM, Package)
- 10 - Zusammenfassung und Fazit


Kommentieren