


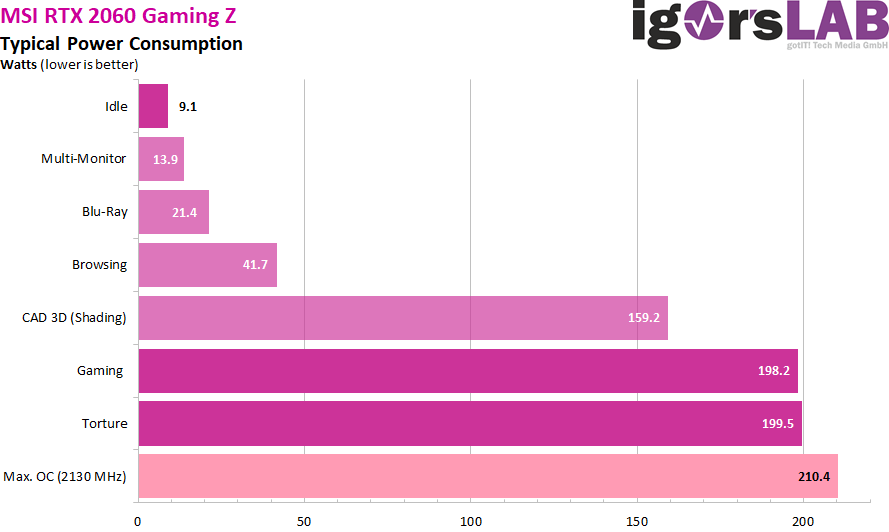
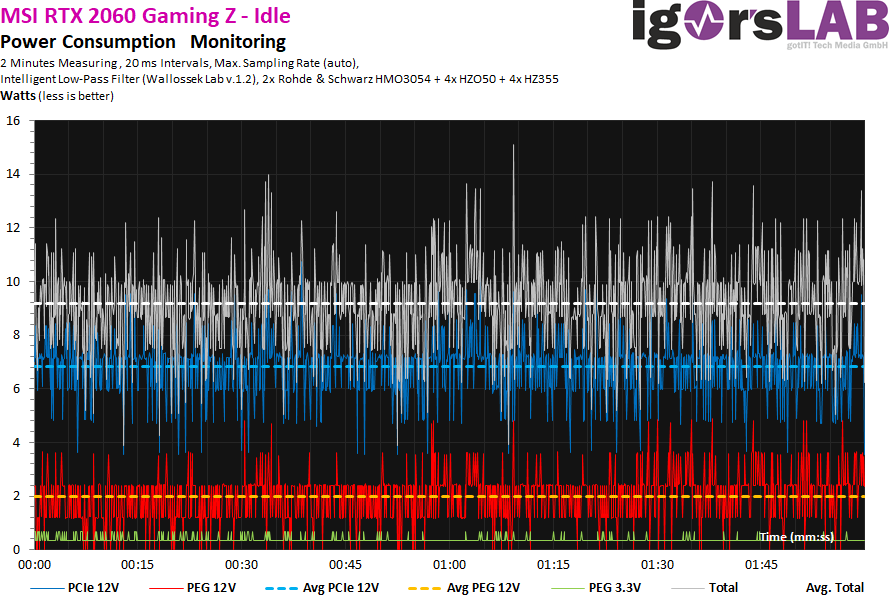
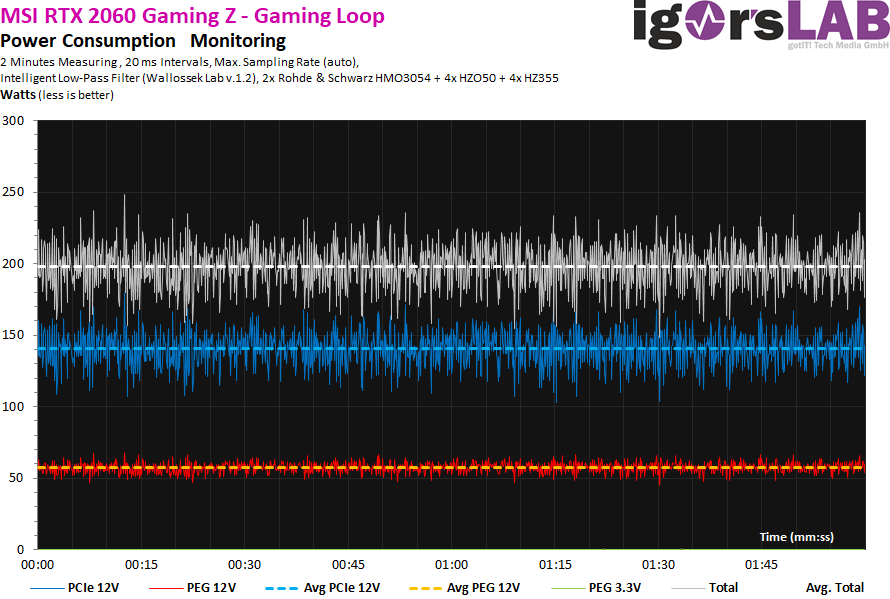
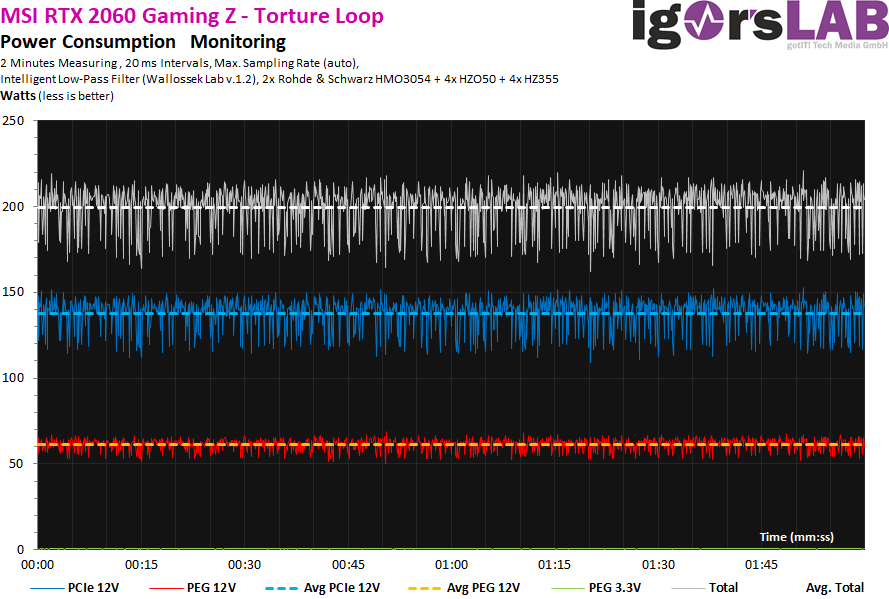
Power consumption and loads
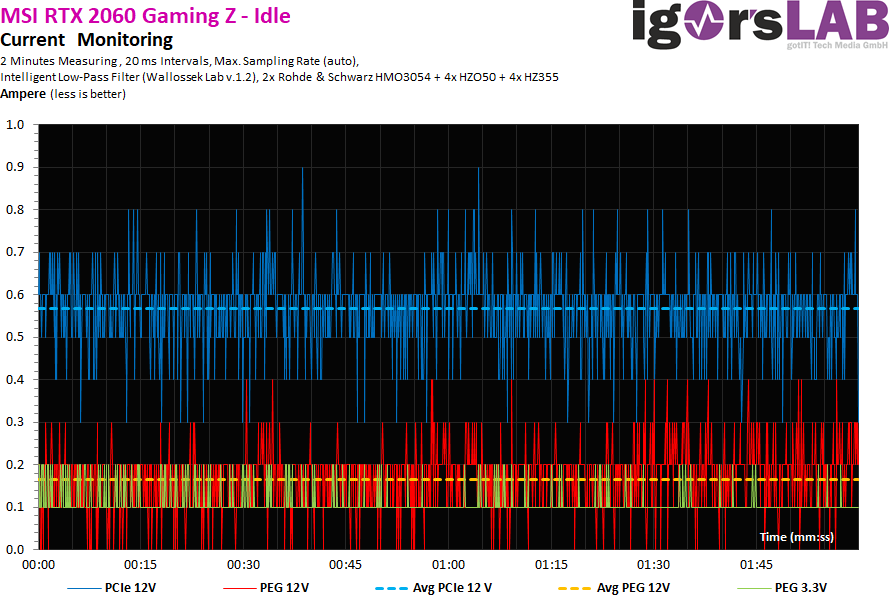
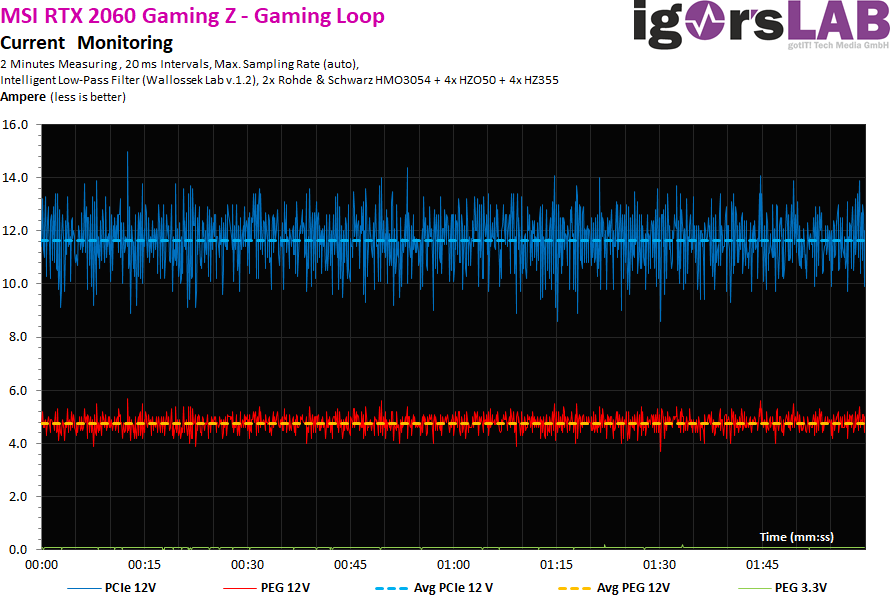
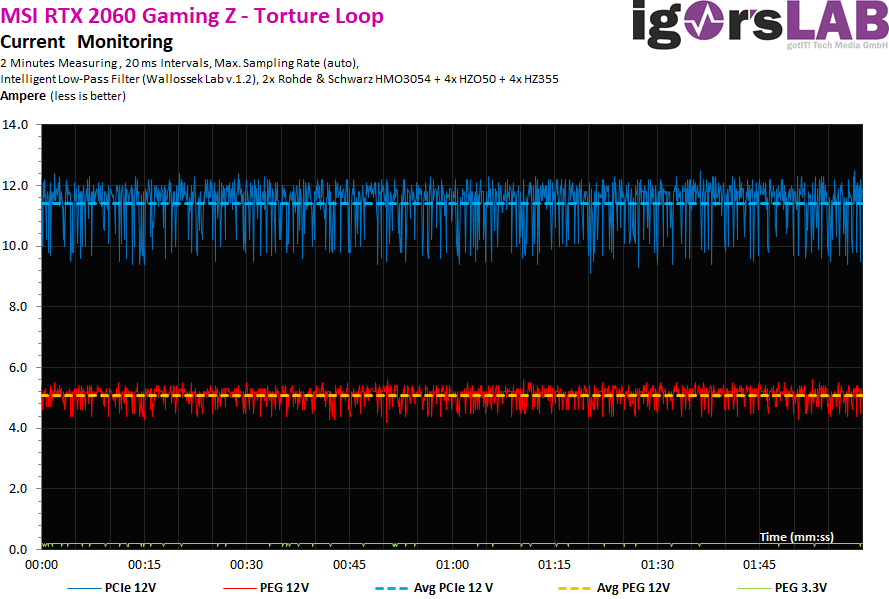
The power consumption of this card is fully on trend with a good 9 watts in the idle. For gaming and in the torture loop, the card is available at approx. 199 watts to 200 watts even far above the default power limit specified in the BIOS. If I overclock the card to its physical limit, then it is already a good 210 watts, so no more can be done. But according to BIOS, the limit is 200 watts. In the end, it is once again one of the cards that miraculously exceeds the BIOS specifications (approx. 5%).
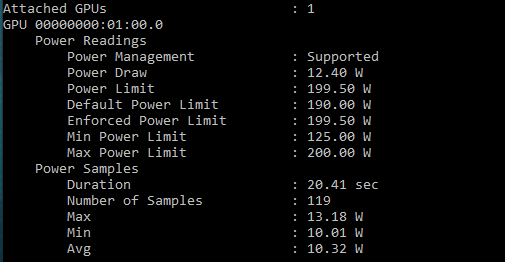
Here is a short excerpt from what MSI actually gave this card in the firmware of limits:
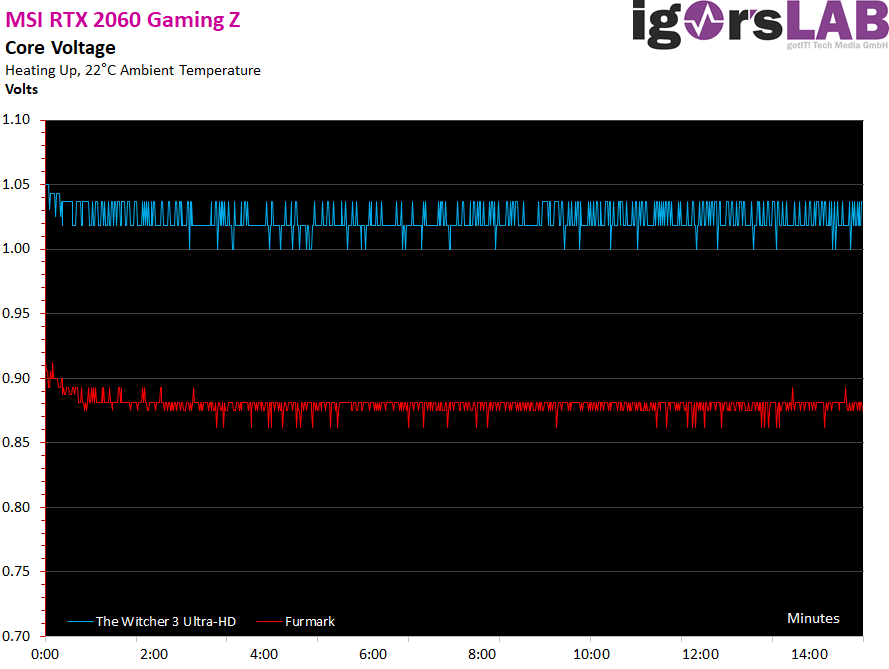
The voltages are in the expected range, whereby in the end the (again) permissible board power was the limiting factor in the OC, not the voltage. One notices very clearly that Nvidia deliberately limits here before a possible maximum is reached. Too bad or thank God?
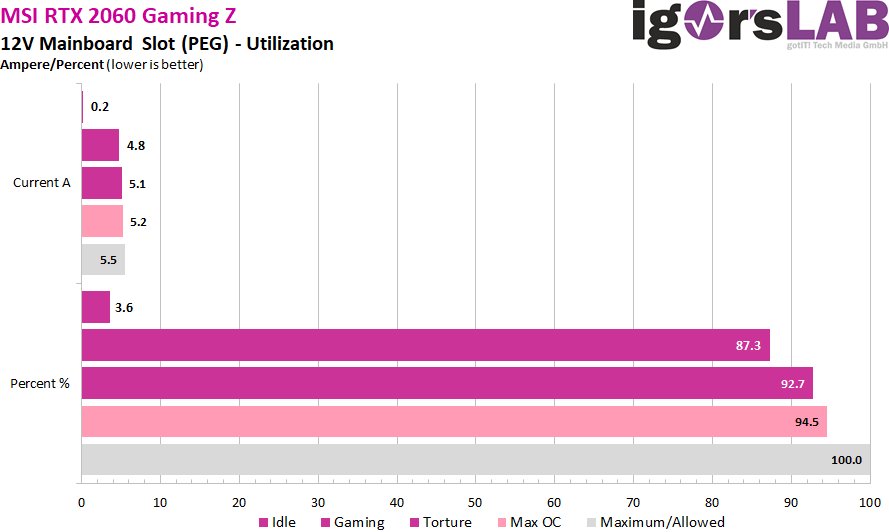
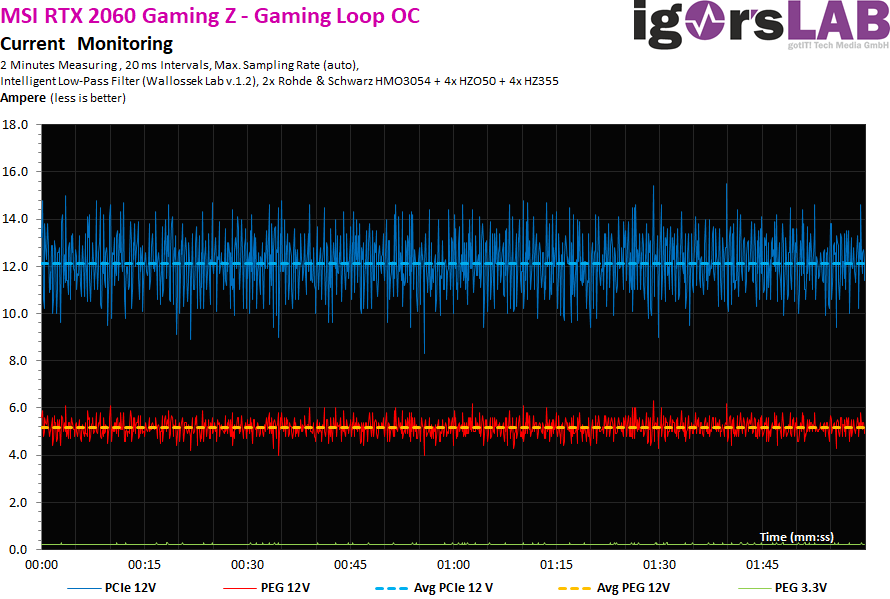
The load distribution on the rails is scarce but in accordance with the standards, because the maximum 5.5 amperes of the motherboard slot are never exceeded. However, the limitation to 5 instead of 6 possible phases already results in a slight shift in the direction of PEG.
Power supply design and peak loads/currents
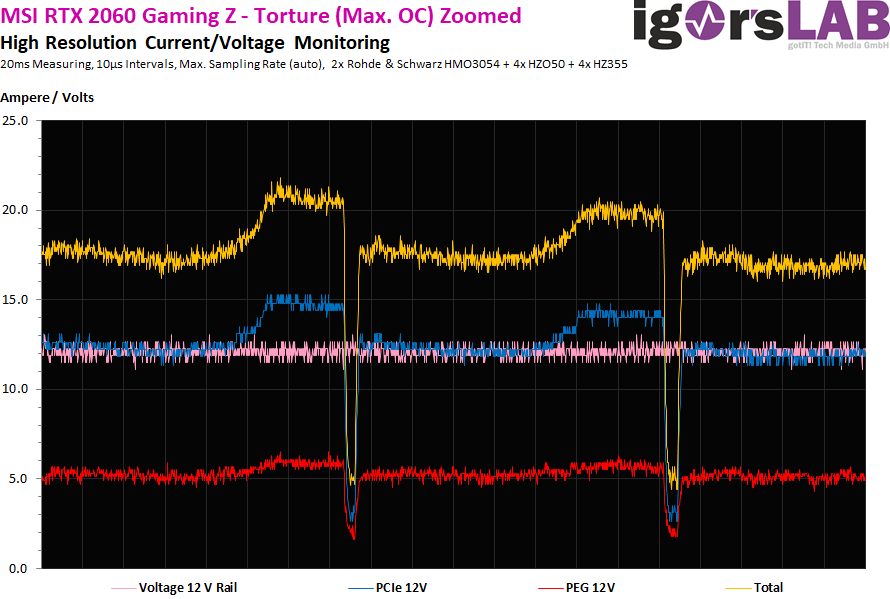
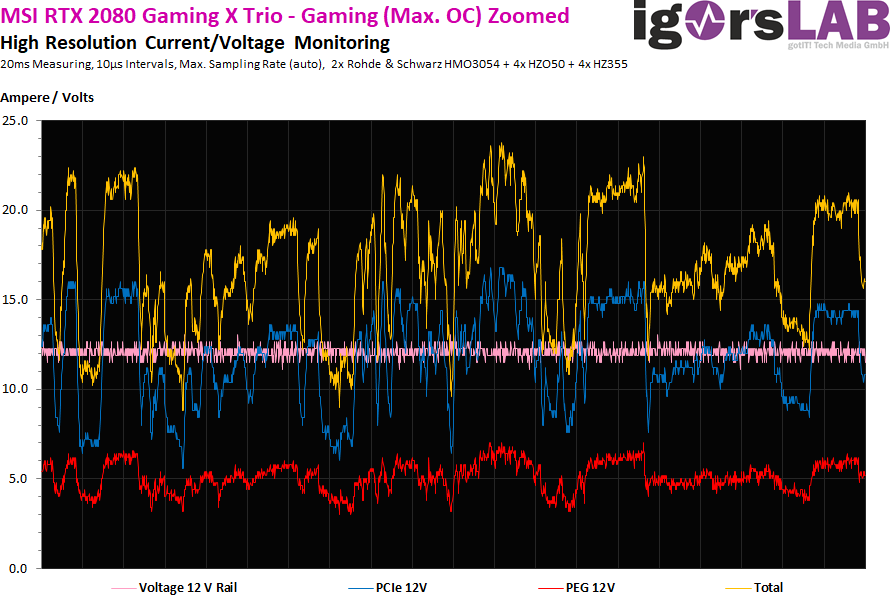
As I have already demonstrated in detail in my basic article "The fight of graphics card against power supply – power consumption and load peaks demystified", there are also temporarily higher loads in the millisecond range, which are unfavorable in case of unfavorable designed or improperly equipped power supplies can already lead to unexplained shutdowns. The TBP (Typical Board Power) measured by the graphics card manufacturer or the reviewers does not really help for a stable design of the system.
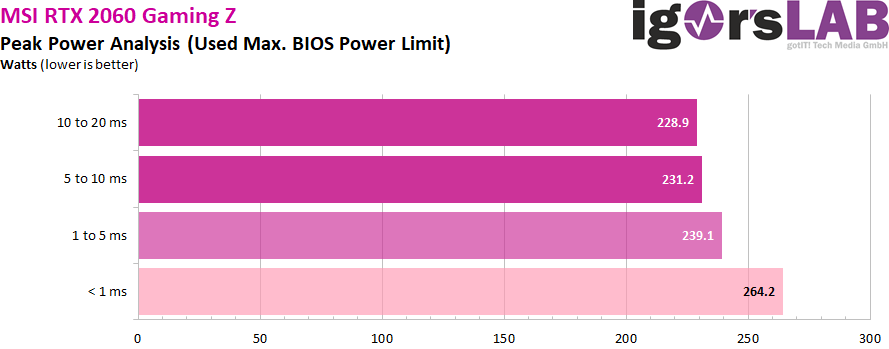
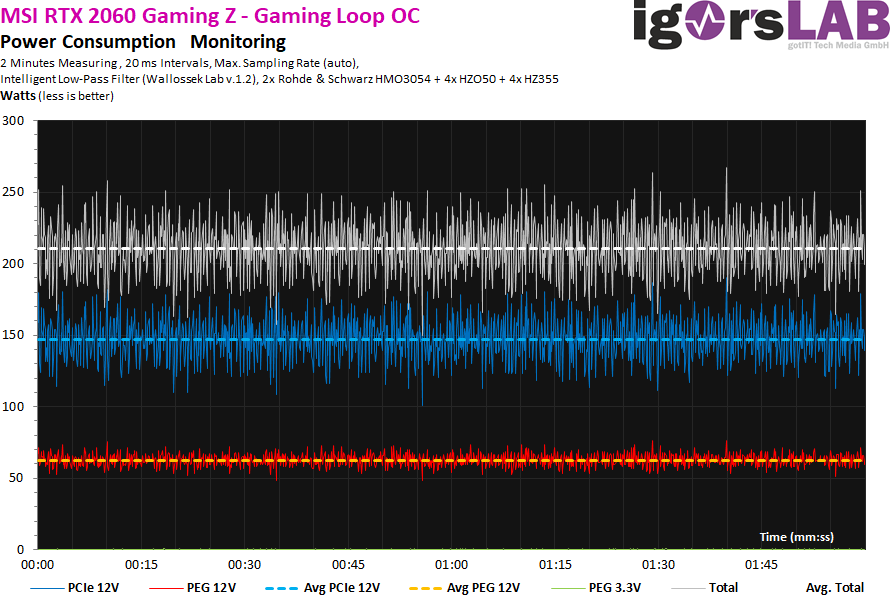
Peaks with intervals between 1 and 10 ms can lead to shutdowns with very fast-reacting protective circuits (OPP, OCP), especially for multi-rail power supplies, although the average power consumption is still in the norm. For the MSI RTX 2060 Gaming / I would therefore calculate with a maximum of 250 watts to have enough reserves in case of cases. A short excerpt with high resolution now shows us the 20 ms measurements (10 S intervals), how I run them automatically for valuation:
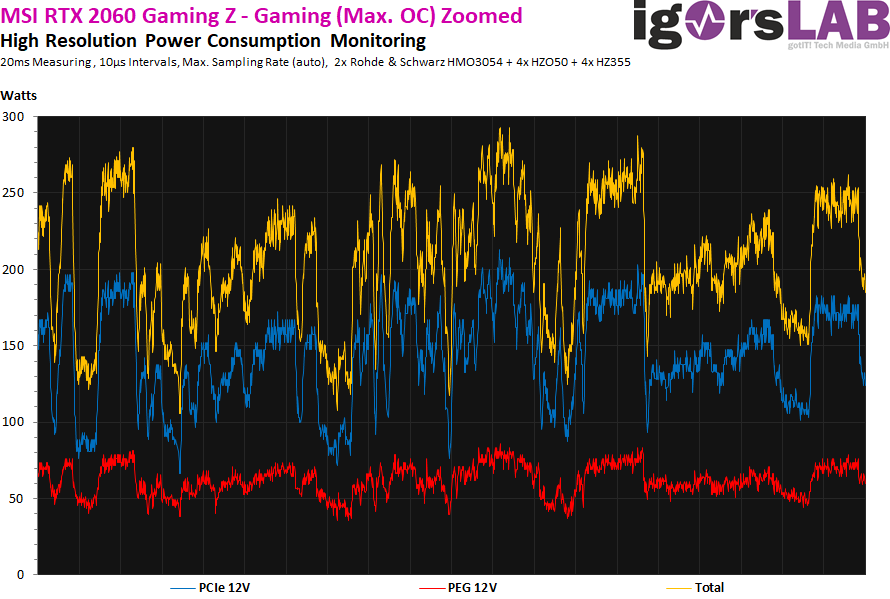
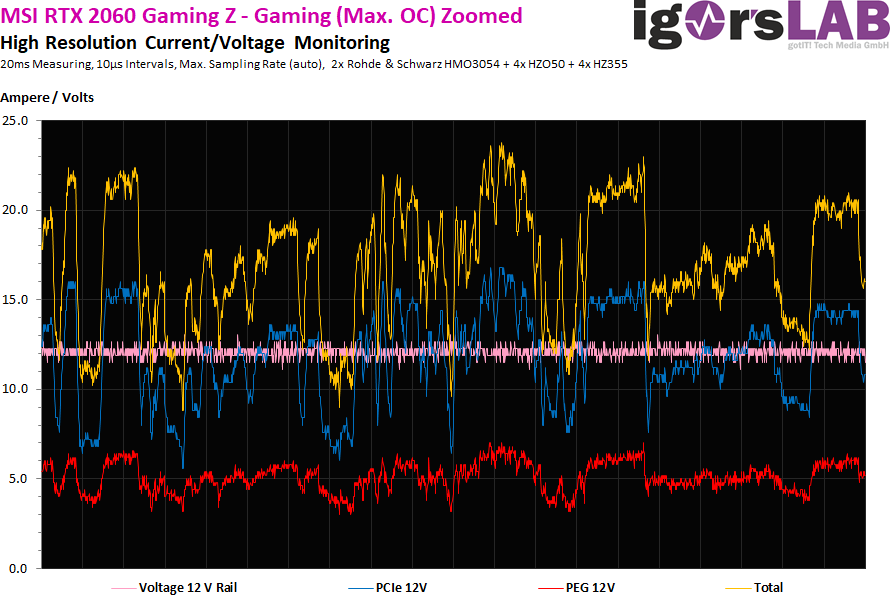
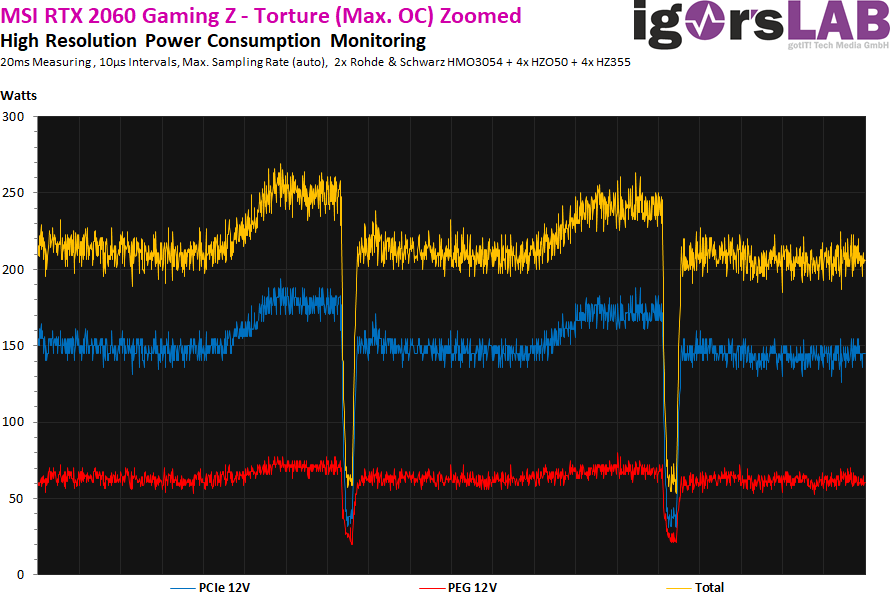
Detailed recording of average power consumption and flowing currents
As usual, I now also set aside the power consumption and the flowing currents as detailed graphics of my oscillograph measurements. A service that hardly anyone else offers and which shows how the maps "tick" in detail:


Kommentieren