


Cooling performance and volume flow
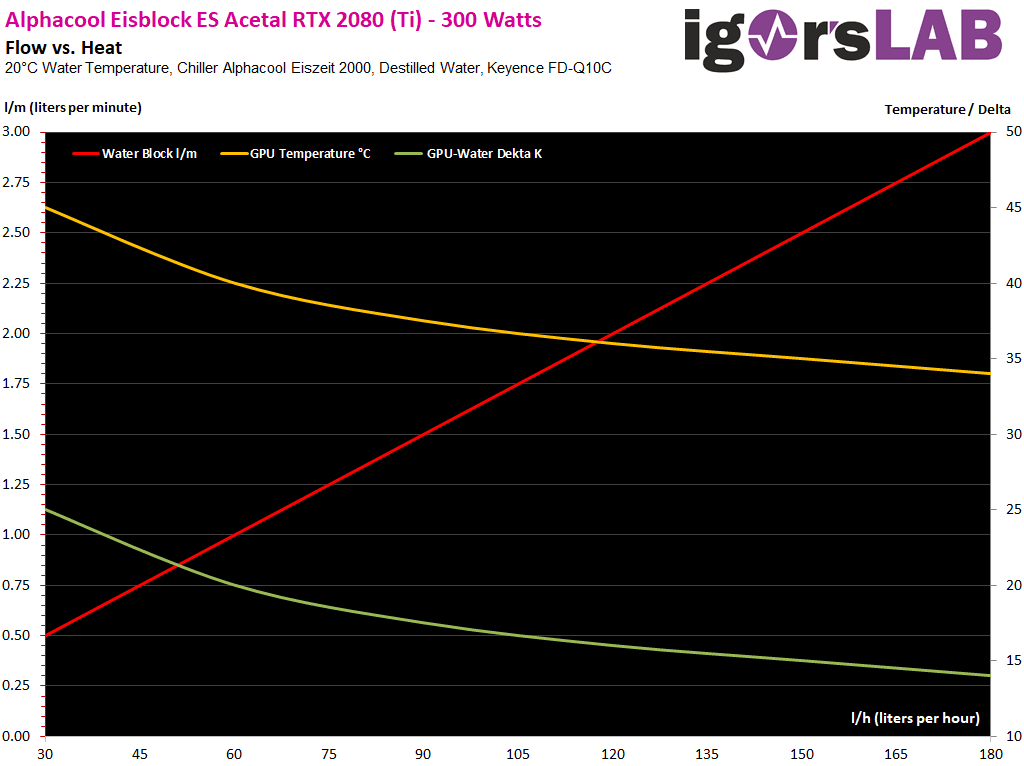
Now let's throw 300 watts of waste heat for the graphics card into the ring and watch exactly what happens now. This time I go a different way and leave the bypass B completely closed. The red curve shows the volume flow in the circuit with the test object and I now adjust the respective volume flow on the basis of the measuring instrument to the respective output, partial and final values between 0.5 l/m (30 l/h) and 3 l/m (180 l/h) and thus pretend that there are no losses, because I can easily compensate for them at the valve.
It can be seen from the temperatures that the curve of the temperature increase is below approx. 1 l/m (60 l/h) goes up significantly, while the increase up to that level was rather moderate. Here, too, the low-flow enthusiasts have to be rather brave, because everything under 1.5 l/m (60 l/h) performs a bit borderline. Those who plan such systems must therefore take a very careful look at the cooling blocks used and the pressure losses as a result, otherwise they must torment the pump, which is always at the expense of the operating noise.
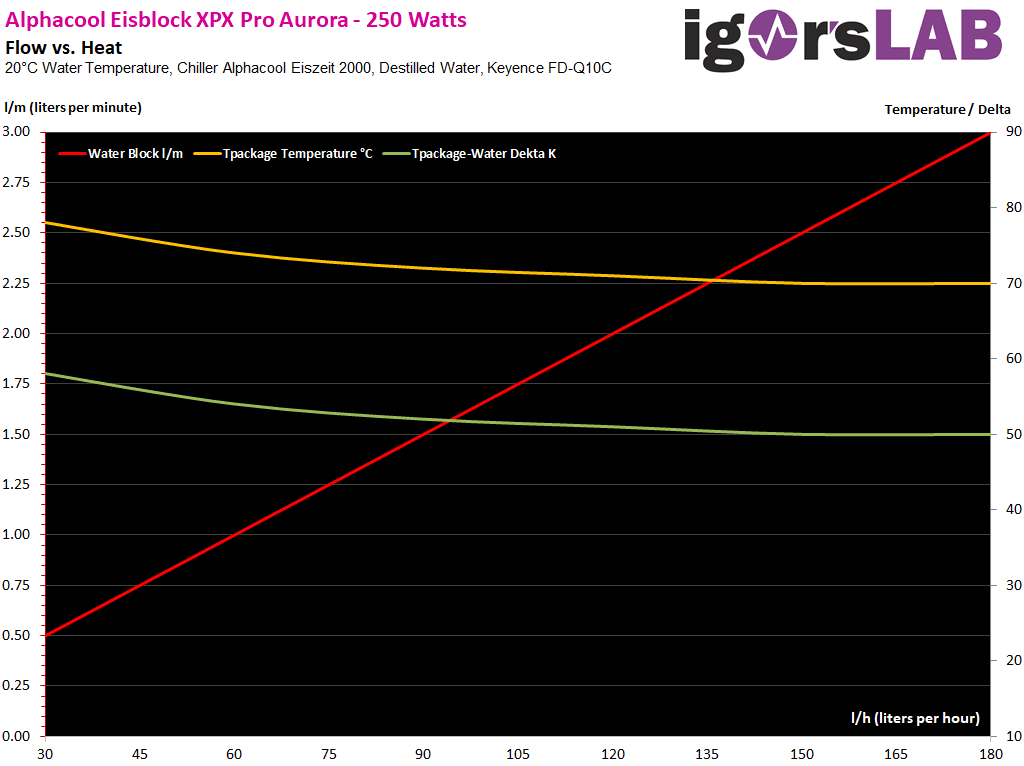
The CPU coolers can be tested using the same method, so from that point of view, this is no different. Also the construction of CPU and GPU coolers in series does not deviate. However, we also see large differences in cooling performance from the curve of the GPU block. I heat the Core i9-7980 XE with 250 watts (controlled via the BIOS) and then evaluate the temperature of the package (Tpackage). The performance remains similarly balanced, as with volume flow.
Everything from approx. 2.25 l/m (135 l/h) upwards then remains the same, the temperatures can no longer benefit from the higher volume flow. From cal 1 l/m (60 l/h) the temperature curve rises a little further, but these are real peanuts compared to the GPU. So it is very nice to see that a good CPU water block is much less dependent on the volume flow than a much more complex GPU water block with nested interior.
Testing other components
The evaluation of radiators in this setup is initially reduced to the pressure loss and then expands by the cooling performance, i.e. the value that defines the actual power output of the transported waste heat to the environment. Here I am still looking for a practical structure that allows consistent and later also reproducible results as often as desired. I have to test and plan a little longer and ask for your understanding.
Summary and conclusion
We have seen that CPU and GPU water blocks often have different rules. While low-flow systems are hardly a real hurdle for good CPU coolers, the temperature of THE GPU water blocks in particular suffers considerably due to pressure losses and too low volume flows. Even though I could only test three GPU blocks internally, they all have the same tendency and perform similarly poorly even when the volume flow decreases.
From this point of view, an enthusiast can almost be discouraged from a real low-flow system, if he also wants to cool the graphics card with. But maybe I still find a GPU water block that can do just that, even if it might not otherwise be the winner in the high-flow test. But it shows me once again that you can't test enough to really do justice to every product. Nevertheless, I won't save myself these few steps with upcoming products and maybe also test a few older test objects again.


Kommentieren