


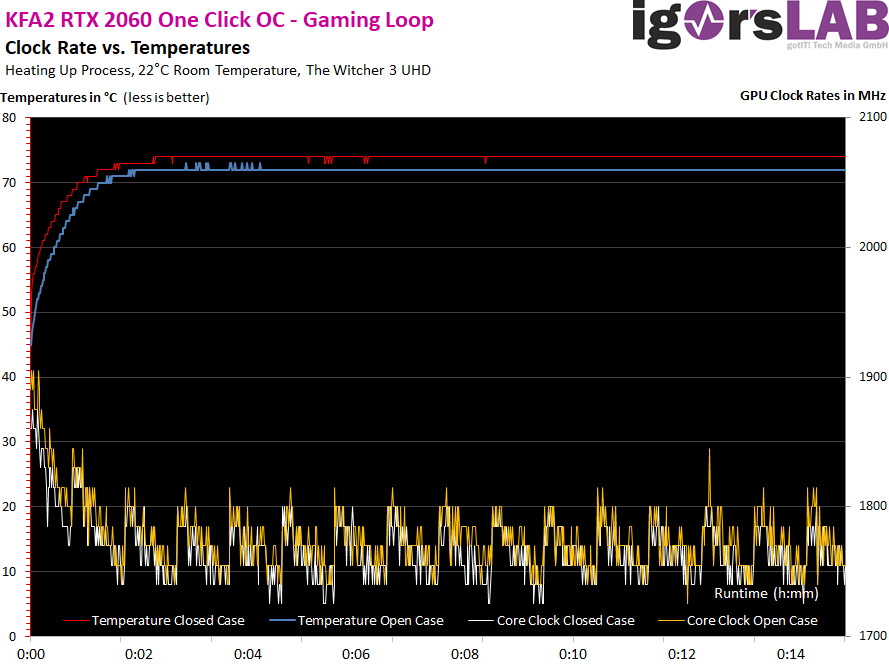
Temperature gradients and boost clock in detail
The cooler struggles and wins. But the secret winner is once again called Power Limit and so the beat flutters up and down, depending on the upcoming gaming load and mood. We have already seen this effect in the tensions, where the map reacted highly sensitively to load changes.
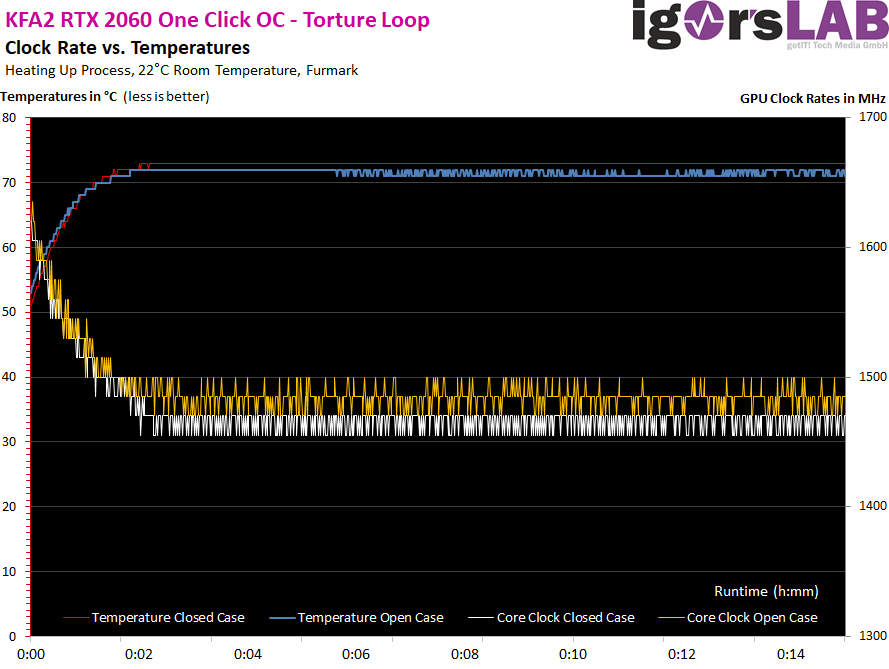
In the torture loop, these fluctuations are naturally lower, because the loads are constant (high).
And now the whole thing again in sober numbers in table form:
| Initial KFA2 RTX 2060 1-Click OC |
Final value KFA2 RTX 2060 1-Click OC |
|
|---|---|---|
| Open Benchtable | ||
| GPU Temperatures |
42 °C | 72 °C |
| GPU clock | 1905 MHz | 1755-1800 MHz |
| Ambient temperature | 22 °C | 22 °C |
| Closed Case | ||
| GPU Temperatures |
45 °C | 74 °C |
| GPU clock | 1895 MHz | 1755-1770 MHz |
| Air temperature in the housing | 23 °C | 43 °C |
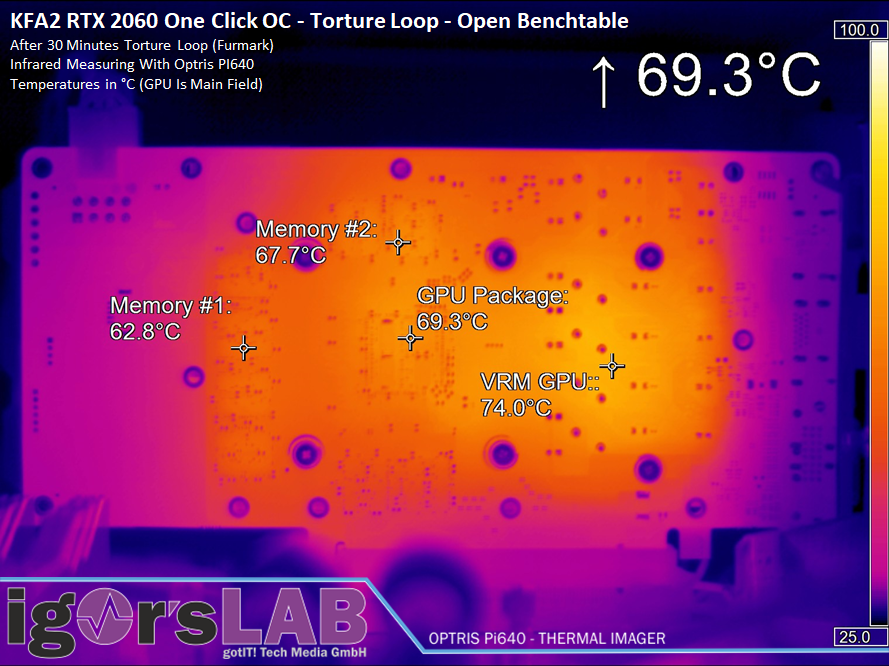
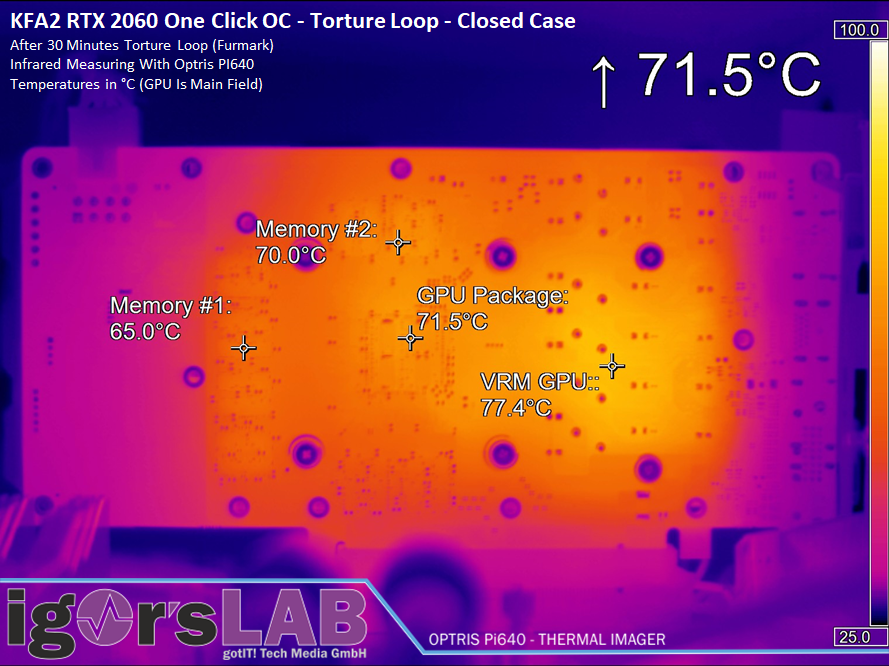
Board Analysis: Infrared Images
The following image gallery shows all infrared images for the gaming and the torture loop in the open structure and in the closed case. The differences are visible, but the cooler still acts quite confidently despite all the limitations and savings, because it is not so much hotter in the end in the closed housing. The large radiator floor absorbs all components to be cooled well and thus results in a large-area heat distribution without annoying and dangerous hotspots. For such a rather trivial piece of aluminium strand, this is more than ok.
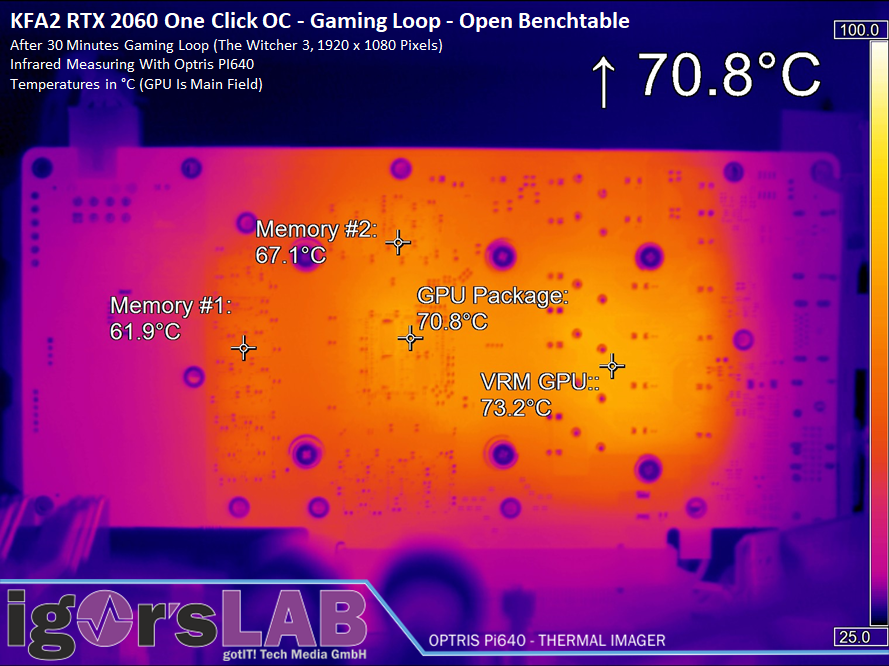
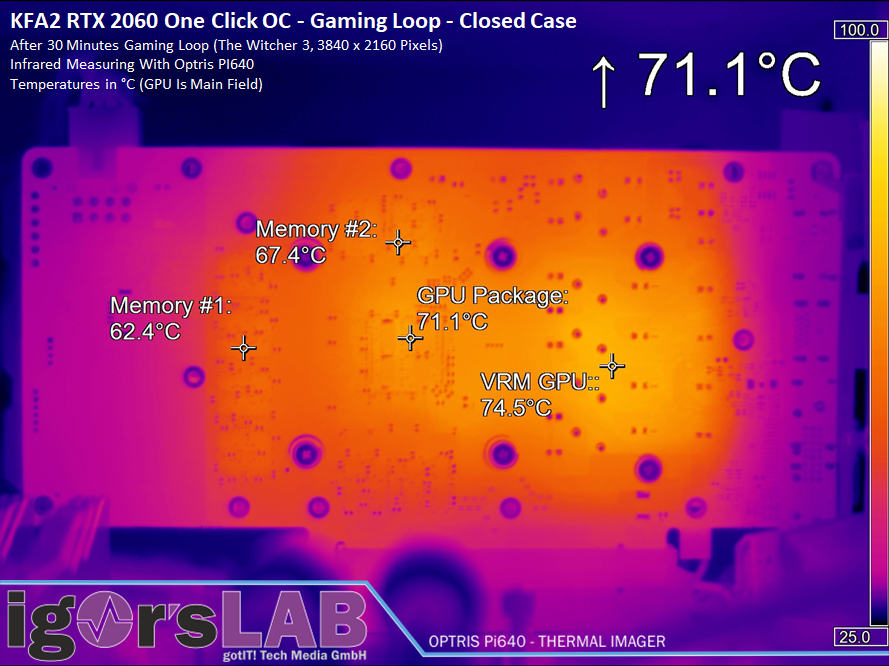
Even in the closed case, this all fits quite well and the one Kelvin more falls into the category “other background noise”.
In the stress test everything looks very similar. A feat, because the waste heat is only minimally higher.
This statement also applies, of course, to the stress test in the closed enclosure, whereby no one is likely to play furmark for more than 30 minutes. This fits everything and would even have loose air up for overclocking. But that bar remains ramshackle. We already know the reasons.


Kommentieren