


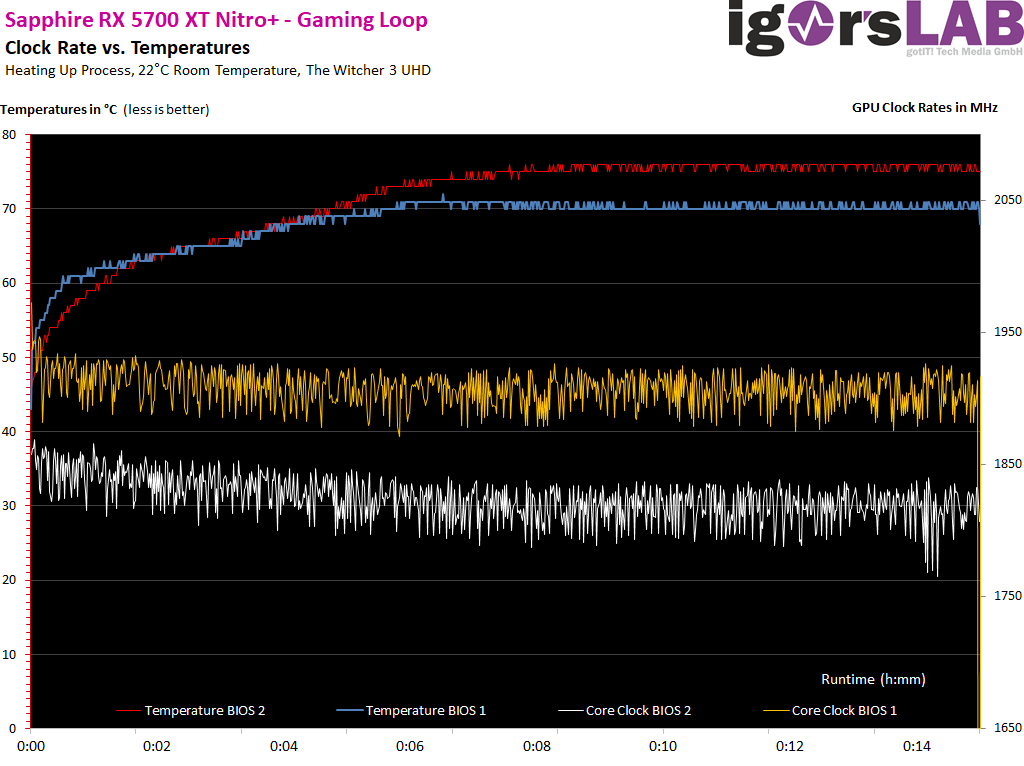
Temperature curves and boost clock in detail
The cooler works perfectly for its size and fan speeds, and since I want to compare the two BIOS versions, I completely dispense with the values of the open benchtable, which is unrealistic anyway. The comparison reveals very big differences both in the clock rate and the temperatures. The BIOS 1 allows temperatures from 70 to 71 °C, while the BIOS 2 allows temperatures between 74 and 75 °C. The BIOS 1 is very stable. Even though the BIOS 2 clock is slightly lower, this setting is certainly the more sensible choice.
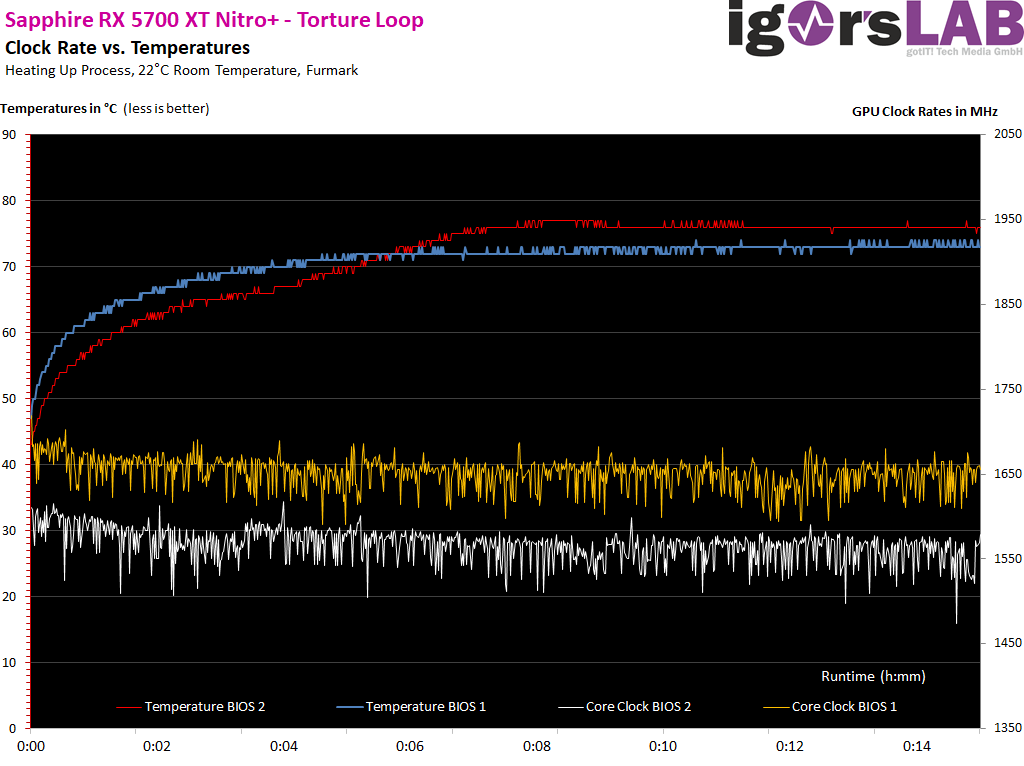
This doesn’t look any different in the stress test, as the waste heat is largely the same as the power consumption.
And now the whole thing again in sober numbers in table form, whereby I compare both BIOS versions in the closed case:
| Start Value BIOS 1 und 2 |
End Value BIOS 1 |
End Value BIOS 2 |
|
|---|---|---|---|
| GPU Temperatures |
37 °C | 70-71 °C |
74-75 °C |
| GPU Clock Rate |
1994 MHz | 1899 – 1932 MHz |
1791 – 1823 MHz |
| Room Temperature | 22 °C | 22 °C | 22 °C |
| Air Temperature Inside Case |
25 °C | 45 °C | 44 °C |
Board Analysis: Infrared Images
The following picture gallery shows all infrared images for the gaming and torture loop in a closed case, but with both BIOS versions as comparison. The pictures are self-explanatory and speak a clear language. And I would like to point out once again that the sensor values for the memory are absolute nonsense, as the temperature under the flip-chip modules of the memory is also measurably lower on the board side:
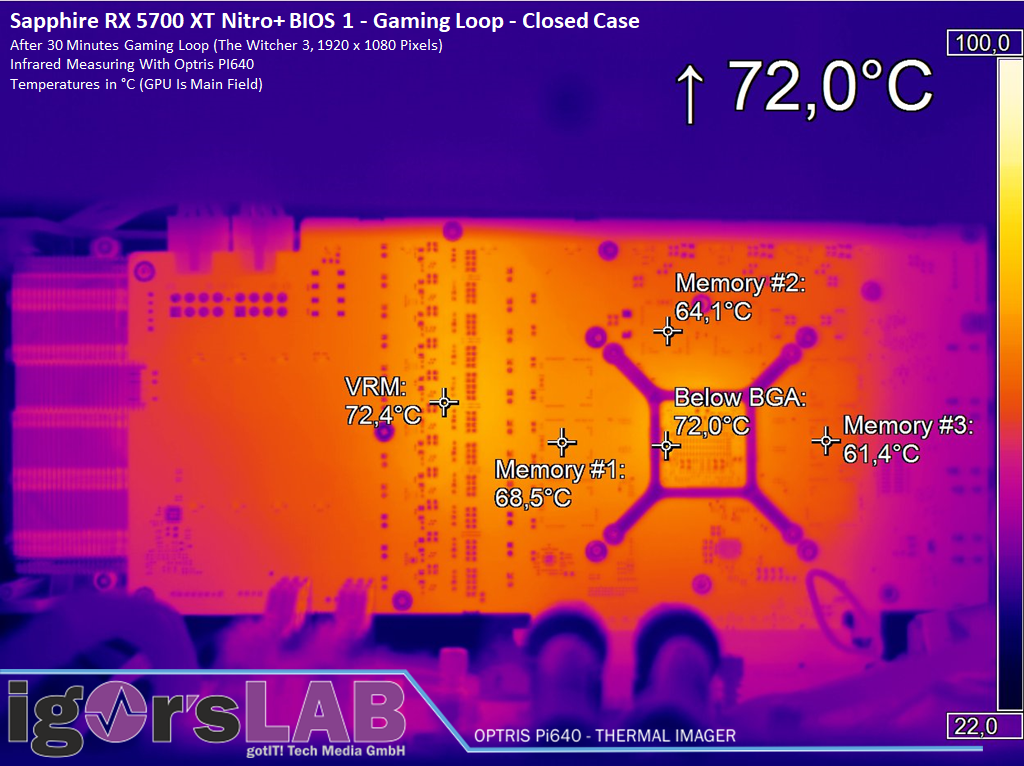
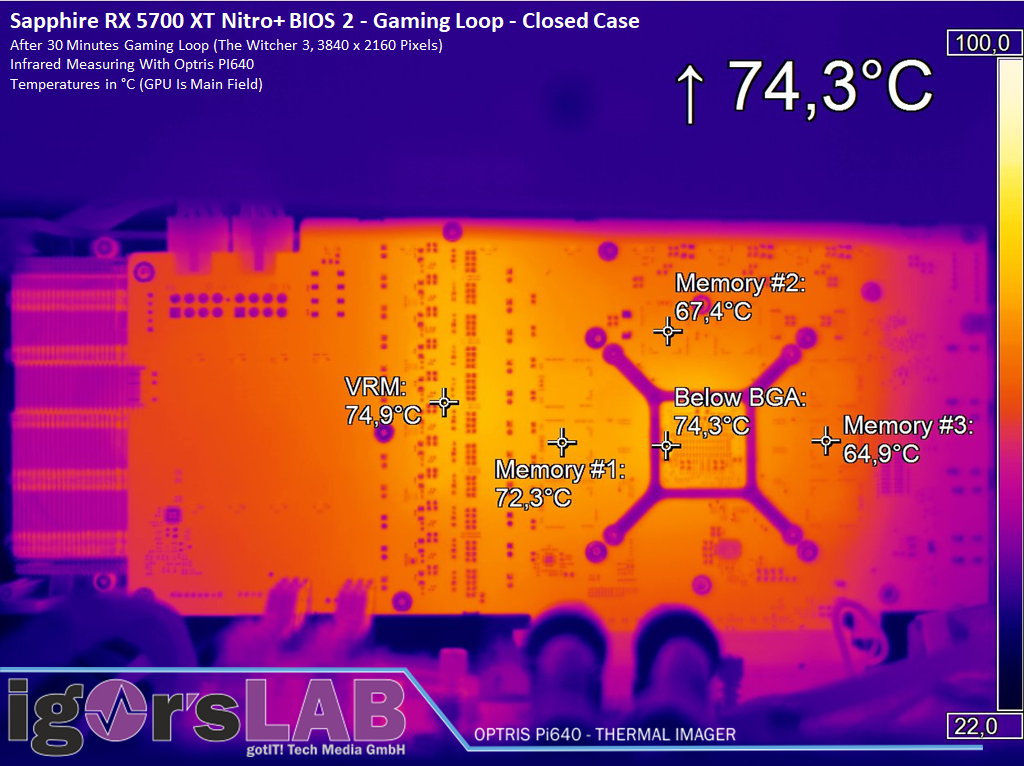
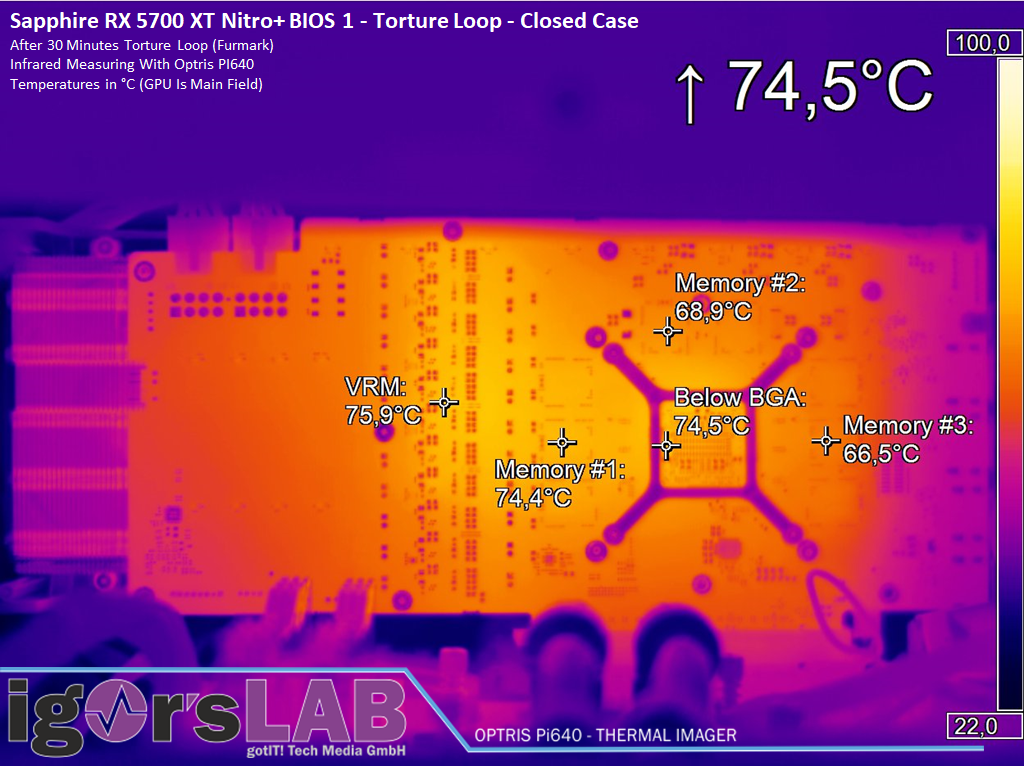
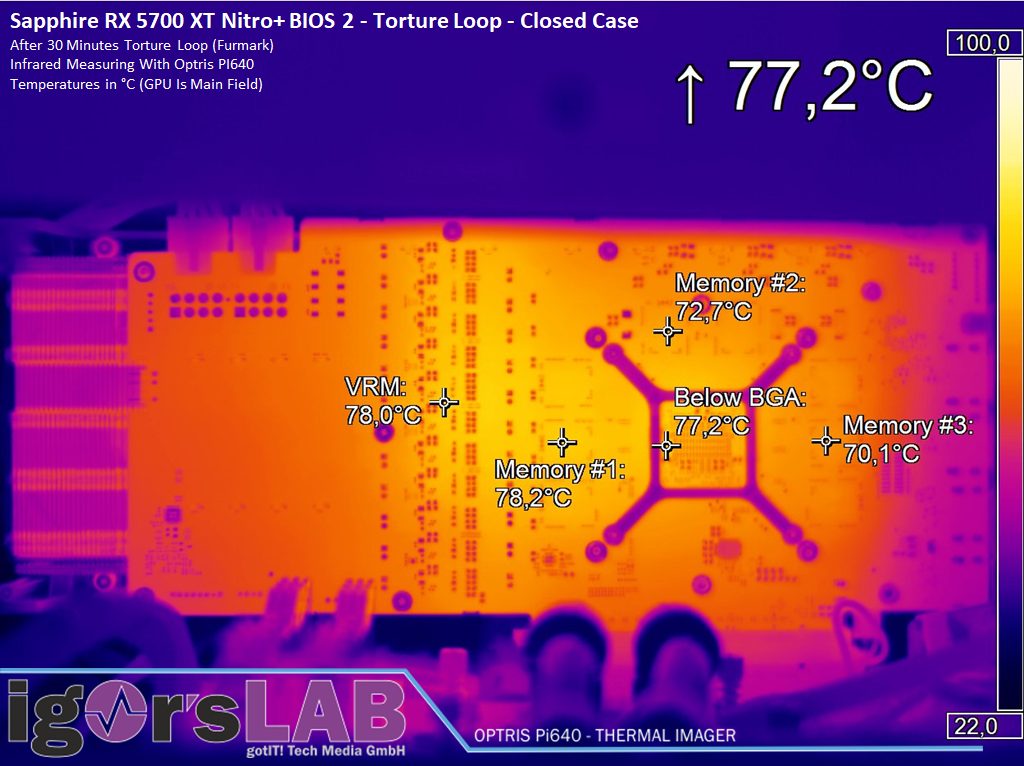
No matter which of the two BIOS variants, the cooler cools neatly and without significant hotspots on the circuit board.


Kommentieren